MTF Williams Vix Market Bottoms [CryptoSea]MTF Williams Vix Fix Indicator is a dynamic tool tailored for traders looking to capture market extremes with high precision. This multi-timeframe indicator leverages the concept of the Williams Vix Fix to spot potential reversals before they occur.
Key Features
Multi-Timeframe Analysis: Provides simultaneous visibility across multiple timeframes, enabling traders to assess market conditions comprehensively from a single chart.
Advanced Volatility Detection: Utilizes a modified Vix Fix formula to highlight extreme price deviations, which often precede significant market reversals.
Customizable Settings: Offers extensive input options to tweak the lookback periods, percentile thresholds, and visibility settings, aligning with various trading strategies.
Visual Band Indicators: Features upper bands and range highs that signal potential overbought and oversold conditions, enhancing trading decision-making.
Below, you can see how the indicator performs across different timeframes, providing valuable insights into market behavior.
How it Works
Vix Fix Calculation: Determines the worst-case 'panic' sell-offs in price as a percentage of the high, capturing the emotional extremes of the market.
Statistical Bands: Employs Bollinger bands over the Vix Fix values to define normal and extreme volatility conditions.
Color-Coded Indicators: Uses color differentiation to instantly highlight when readings surpass critical upper band or range high thresholds, signaling key trading opportunities.
For instance, in the analysis provided below, notice how the indicator flags significant market moves, allowing traders to anticipate potential entry or exit points.
Application
Risk Management: Aids in identifying extreme market conditions where prices may revert, helping in effective position sizing and risk management.
Strategic Planning: Enhances strategic trading plans by identifying not only when but also where market extremes may occur, considering multiple timeframes.
Customization: Adapts seamlessly to different market environments with adjustable settings for volatility thresholds and visual display preferences.
The MTF Williams Vix Fix Indicator by is an essential tool for traders aiming to leverage market volatility for optimal entry and exit, ensuring they are well-equipped to handle market extremes with confidence.
Reversal

Reversal Candlestick Structure [LuxAlgo]The Reversal Candlestick Structure indicator detects multiple candlestick patterns occurring when trends are most likely to experience a reversal in real-time. The reversal detection method includes various settings allowing users to adjust the reversal detection algorithm more precisely.
A dashboard showing the percentage of patterns detected as reversals is also included.
🔶 USAGE
Candlestick patterns are ubiquitous to technical analysts, allowing them to detect trend continuations, reversals, and indecision.
The proposed tool effectively detects reversals by using the confluence between candlestick patterns and a reversal detection method based on the stochastic oscillator, acting as a filter for the patterns. If a candlestick pattern occurs while conditions suggest a potential reversal then the pattern is highlighted.
The displayed candle coloring allows users to observe the reversal detection method, with colored candles indicating potential reversals.
Users wanting to detect longer-term reversals can use a higher "Trend Length" setting, this can however lead to an increased amount of displayed candlestick patterns.
To prevent false positives users also have control over a "Threshold" setting in a range between (0, 100), with values closer to 100 preventing candlesticks from being detected at the start of trends.
The "Warmup Length" serves a similar purpose, and aims to prevent sudden moves to be classified as reversals. Higher values of this setting will require trends to be established for a longer period of time for reversal conditions to be detected.
🔹 Dashboard
To evaluate the role of individual candlestick patterns as potential reversal signals relative to the proposed reversal detection method, a dashboard displaying the percentage of candlestick patterns displayed (that occur when a potential reversal is detected) over the total amount detected.
Hovering on the dashboard cells of the "Reversal %" column allows displaying the total amount of patterns detected.
🔶 CANDLESTICKS PATTERNS
This tool detects 16 popular candlestick patterns, each listed in the sub-sections below.
🔹 Bullish Patterns
Hammer - A bullish reversal pattern that forms after a decline, characterized by a small body at the upper end of the trading range and a long lower shadow.
Inverted Hammer - A bullish reversal pattern that forms after a downtrend, featuring a small body at the lower end of the trading range and a long upper shadow.
Bullish Engulfing - A bullish reversal pattern where a small bearish candlestick is followed by a larger bullish candlestick that completely engulfs the previous candle.
Rising 3 - A bullish continuation pattern that consists of a long bullish candlestick followed by three smaller bearish candlesticks and then another long bullish candlestick.
3 White Soldiers - A bullish reversal pattern consisting of three consecutive long bullish candlesticks, each opening within the previous candle's body and closing higher.
Morning Star - A bullish reversal pattern made up of three candlesticks: a long bearish candlestick, followed by a short candlestick, and then a long bullish candlestick.
Bullish Harami - A bullish reversal pattern where a small bullish candlestick is completely within a previous larger bearish candlestick.
Tweezer Bottom - A bullish reversal pattern identified by an initial bullish candle, followed by a bearish candle, both having equal lows.
🔹 Bearish Patterns
Hanging Man - A bearish reversal pattern that forms after an uptrend, characterized by a small body at the upper end of the trading range and a long lower shadow.
Shooting Star - A bearish reversal pattern that forms after an uptrend, featuring a small body at the lower end of the trading range and a long upper shadow.
Bearish Engulfing - A bearish reversal pattern where a small bullish candlestick is followed by a larger bearish candlestick that completely engulfs the previous candle.
Falling 3 - A bearish continuation pattern that consists of a long bearish candlestick followed by three smaller bullish candlesticks and then another long bearish candlestick.
3 Black Crows - A bearish reversal pattern consisting of three consecutive long bearish candlesticks, each opening within the previous candle's body and closing lower.
Evening Star - A bearish reversal pattern made up of three candlesticks: a long bullish candlestick, followed by a short candlestick, and then a long bearish candlestick.
Bearish Harami - A bearish reversal pattern where a small bearish candlestick is completely within a previous larger bullish candlestick.
Tweezer Top - A bearish reversal pattern is identified by an initial bullish candle, followed by a bearish candle, both having equal highs."
🔶 SETTINGS
🔹 Patterns
Group including toggles for each of the supported candlestick patterns. Enabled toggles will allow detection of the associated candlestick pattern.
🔹 Reversal Detection
Trend Length: Determines the sensitivity of the reversal detection method to shorter-term variation, with higher values returning a detection method more sensitive to longer-term trends.
Threshold: Determines how easy it is for the reversal detection method to consider a trend at an extreme point.
Warmup Length: Warmup period in the reversal detection method, longer values will require a longer-term trend to detect potential reversals.
🔹 Style
Color Candles: Enable candle coloring on the user chart based on the reversal detection method.
Use Gradient: Use a gradient as candle coloring.
Label Size: Size of the labels displaying the detected candlesticks patterns.
🔹 Dashboard
Show Dashboard: Display the dashboard on the user chart when enabled.
Location: Dashboard location on the user chart.
Size: Size of the displayed dashboard.

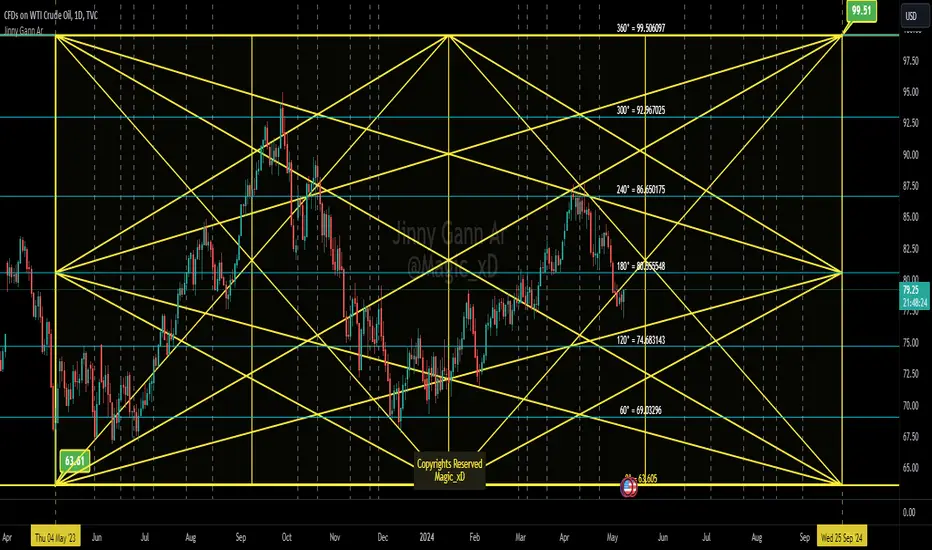
Jinny Gann ArJinny Gann AR is a comprehensive technical analysis indicator designed to empower traders with the tools to analyze market movements using Gann square of 9 theory. Developed by Magic_xD, this indicator integrates various features inspired by the legendary trader W.D. Gann's methods.
The trading techniques by WD Gann are widely seen as innovative and are still studied and used by traders today. He used angles and various geometric constructions. Gann angles divide time and price into proportionate parts and are often used to predict areas of support and resistance, key tops and bottoms and future price moves. The method is based on the notion that markets rotate from angle to angle and when an angle is broken, price moves towards the next one. Several angles together make up a Gann Fan.
- Jinny Gann AR Might accurately Shows you when and what price might be the end of the Cycle,
-Gives The important pivot points
- This Allows you to Detect Next Level of Resistance/Support And when a Possible Reversal might occur ahead so you can Catch a reversal in time.
- Its Multi Language User interface English - Arabic.
Ability to customize Every thing visually.
Some Features Explained on USOIL Chart :
Gann Square of 9 Levels for USOIL:
Charts Shows and Up Cycle Started 4 May 2023 From bottom of 63.61
Indicating Important Levels and Expected End of 1 Cycle at 99.5 on 25 Sep 2024
Gann Star With Levels And Time Lines :
Vertical Dashed Lines are The time lines
Jinny Gann Grid Based on Shape Type not Static 45 Angle:
Jinny Gann Grid + Levels :
Jinny Gann Fan For Up Cycle:
Jinny Gann Fan Reverse Same Cycle:
Ability To Show Both Up/Reversal Fans on The chart:
The Number of Fann Levels you need on the chart can be customized by changing Shape Type... But Price Will Respect it Pretty Well.
Key Features:
Direction Selection: Choose between "Up" or "Down" to specify the market direction you want to analyze.
Automatic Settings Adjustment: Enable this option to allow the indicator to automatically adjust settings for optimal analysis.
Original Gann Levels: Display original Gann theory levels Based on Gann Square of 9 Equations.
Auto Detect Tops/Bottoms: Determine the number of previous candles used to automatically detect Top or Bottom in the market.
Spacing Configuration: Adjust the spacing or offset between Gann levels to fine-tune your analysis.
Manual Starting Point: Manually set the starting point for your analysis.
Geometric Shape Selection: Choose from various geometric shapes including straight lines, triangles, quadrilaterals, and more...
Custom Angle Selection: Define custom angles for geometric shapes .
Time Interval Selection: Select time intervals such as 360 or 720 Etc...
Cycle Analysis: Determine the number of cycles to analyze market movements effectively.
Decimal Precision: Customize the number of decimal places displayed for accurate analysis.
Automatic Spacing (Under Development): Future feature to automatically select spacing for enhanced user experience.
Time Levels Display: Visualize time levels to gain insights into market timing.
Gann Star Display: Show Gann stars to identify critical market points.
Star Modification: Modify the appearance of Gann stars for better visualization.
Gann Grid Display: Display Gann grids to identify key support and resistance levels.
Grid Extension: Extend Gann grid lines for extended analysis.
Gann Fan Display: Show Gann fans to analyze trend lines and potential reversals.
Reverse Fan Display: Visualize Gann fans in reverse to explore alternative analysis perspectives.
Additional Fan Options: Explore more options for Gann fan analysis.
Time Line Adjustment: Move time lines to the right or left for flexible analysis.
Star Line Extension: Extend Gann star lines for deeper insights.
Fan Line Extension: Extend Gann fan lines for comprehensive trend analysis.
Customizable Colors: Customize colors for various indicators to suit your preference.
Width Adjustment: Adjust the width of trend lines for better visualization.
Label Customization: Customize colors and positions of level and price labels for clarity.
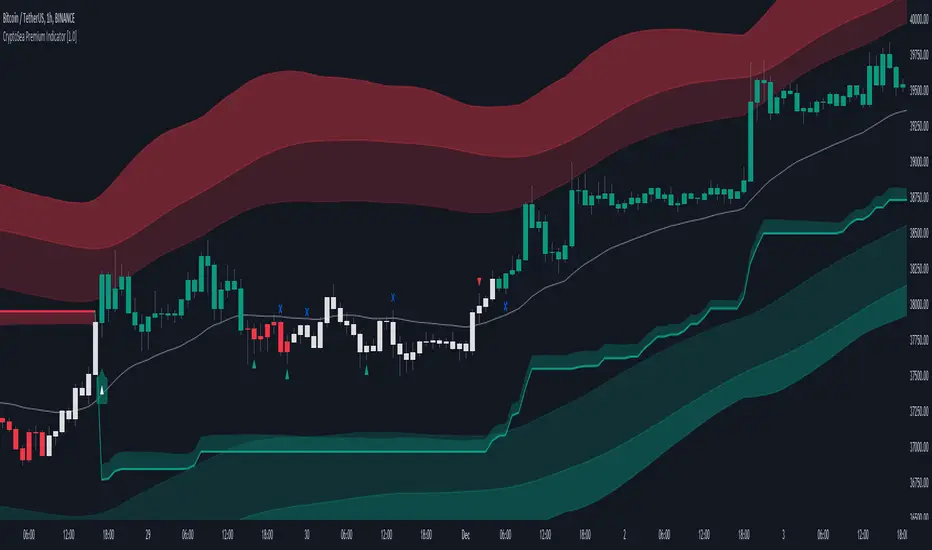
CryptoSea Premium IndicatorCryptoSea Premium Indicator: Enhanced Trading Precision through Advanced Integration
The CryptoSea Premium Indicator is designed to equip traders with a sophisticated tool that synthesizes traditional and modern analytical methods. By integrating proven technical tools with custom enhancements, it aims to provide a deeper, more actionable insight into market dynamics, enhancing the analysis and decision-making process for traders.
Integration and Unique Features:
Support and Resistance Dynamics: Leveraging a blend of standard deviation and moving averages akin to the methodology of Bollinger Bands, this feature dynamically identifies potential market pivot points. It calculates these points based on historical price volatility, which serves as a probabilistic guide to potential price movements, rather than a definitive prediction.
Trend Reversals and Continuations: This function integrates the Relative Strength Index (RSI) with a custom-tailored trend filter that employs shorter cycle moving averages to refine the traditional use of RSI. This enhancement is designed to pinpoint more accurate entry and exit points during trend phases by filtering out market noise and focusing on significant movements, though it does not ensure the avoidance of all false signals.
Smart Trail Closure and New Trends: Utilizing the Average True Range (ATR), this advanced feature dynamically adjusts stop-loss settings according to changes in market volatility. This adaptation seeks to better align stop-loss orders with current market realities, helping to protect against sudden market shifts while allowing traders to capitalize on new trends as they emerge.
Ranging Signals: By employing dual moving averages that calculate the upper and lower bounds of price movements, this feature refines the approach to range-bound trading. It uses statistical measures to adjust these bands in real-time based on the latest market data, enhancing traders' ability to make informed decisions during lateral market movements.
Dynamic Candles: This feature colors candles based on a complex algorithm that assesses immediate price action within the context of longer-term trends. This visual tool aims to simplify market sentiment analysis by providing intuitive color-coded feedback on the prevailing market conditions, thereby assisting traders in quickly assessing the market environment.
Scalping Signals: Generated by a high-frequency trading algorithm that scrutinizes short-term price fluctuations, these signals are designed to aid traders in making swift, informed trading decisions in fast-paced market conditions. They optimize the identification of micro-trends and potential reversal points essential for scalping strategies, though they do not guarantee success in every trade.
Originality and Practical Application:
Each component of the CryptoSea Premium Indicator is carefully selected and integrated to offer a tool that enhances more than the sum of its parts. This integration provides a comprehensive and nuanced view of the market, aiding traders in navigating complex market dynamics more effectively than traditional, single-function indicators.
Disclaimer and Usage Tips:
Trading involves risks. The CryptoSea Premium Indicator should be used as one of several tools in a comprehensive trading strategy. It is intended to supplement, not replace, thorough market analysis and personal due diligence. Past performance is not indicative of future results, and no claims are made regarding the guaranteed accuracy of provided signals.
Crypto Realized Profits/Losses Extremes [AlgoAlpha]🌟🚀 Introducing the Crypto Realized Profits/Losses Extremes Indicator by AlgoAlpha 🚀🌟
Unlock the potential of cryptocurrency markets with our cutting-edge On-Chain Pine Script™ indicator, designed to highlight extreme realized profit and loss zones! 🎯📈
Key Features:
✨ Realized Profits/Losses Calculation: Uses real-time data from the blockchain to monitor profit and loss realization events.
📊 Multi-Crypto Compatibility: The Indicator is compatible on other Crypto tickers besides Bitcoin.
⚙️ Customizable Sensitivity: Adjust the look-back period, normalization period, and deviation thresholds to tailor the indicator to your trading style.
🎨 Visual Enhancements: Choose from a variety of colors for up and down trends, and toggle extreme profit/loss overlay for easy viewing.
🔔 Integrated Alerts: Set up alerts for high and extreme profit or loss conditions, helping you stay ahead of significant market movements.
🔍 How to Use:
🛠 Add the Indicator: Add the indicator to favorites. Customize settings like period lengths and deviation thresholds according to your needs.
📊 Market Analysis: Monitor the main oscillator and the bands to understand current profit and loss extremes in the market. When the oscillator is at the upper band, this means that the market is doing really well and traders/investors will be likely to take profit and cause a reversal. The opposite is true when the oscillator reaches the lower band. The main oscillator can also be used for trend analysis.
🔔 Set Alerts: Configure alerts to notify you when the market enters a zone of high profit or loss, or during trend changes, enabling timely decisions without constant monitoring.
How It Works:
The indicator calculates a normalized area under the RSI curve applied on on-chain data regarding the number of wallets in profit. It employs a custom "src" variable that aggregates data from the blockchain about profit and loss addresses, adapting to intraday or longer timeframes as needed. The main oscillator plots this normalized area, while the upper and lower bands are plotted based on a deviation metric to identify extreme conditions. Colored fills between these bands visually denote these zones. For interaction, the indicator plots bubbles for extreme profits or losses and provides optional bar coloring to reflect the current market trend.
🚀💹 Enjoy a comprehensive, customizable, and visually engaging tool that helps you stay ahead in the fast-paced crypto market!

Trend and Reversal ScannerHello Traders!
The TRN Trend and Reversal Scanner highlights in a user-friendly and easy to read table trend and reversal signals from up to 20 assets of your choosing. With it, you can efficiently monitor your preferred instruments simultaneously without jumping from one chart to the next. You will never miss a signal again. The indicator automatically finds swing-based up and down trends, bullish and bearish divergences, detects ranges and range breakouts as well as trend and reversal signals by the built-in trend detection algorithm called TRN Bars. Furthermore, you can conveniently stay updated with real-time alerts, notifying you whenever the scanner finds interesting market situations.
Feature List
Swing-based up and down trend detection
Divergence detection for any given (Custom) Indicator
Price range and breakout detection
Bar trend and reversal detection
Scanner alerts
The value of this indicator is to support traders to easily identify trend-based signals in an automated way and across many different markets at the same time. The trader saves a lot of time scanning the markets for up and down swings, divergences, consolidations and bar pattern-based trends and reversals, since finding and alerting these signals is done automatically for the trader.
For a visualization of the detected signals, you can add the TRN Bars and the Swing Suite indicator to your chart.
How does Trend Scanner work?
On the right side of the chart, you can find a table displaying the symbols monitored by the TRN Trend and Reversal Scanner for signal detection (first column). The table provides information on the status of each symbol. This visual representation allows you to quickly identify evolving signals across different symbols, helping you stay informed and make timely trading decisions.
The scanner operates specifically on the timeframe you are currently viewing, ensuring that the detected signals align precisely with your trading perspective.
In the following, we will describe the different signals displayed in the different columns of the table
Column 1 – Symbols
Column 2 – Bar Trend & Signals
Column 3 – Up & Down Swing Trend
Column 4 – Ranges & Range Breakouts
Column 5 – Bullish Divergences
Column 6 – Bearish Divergences
Bar Trend & Signals
In the second column, you can observe the status of TRN Bars, the built-in trend detection algorithm.
UP – Uptrend
DN – Downtrend
REV (Green) – Bullish Reversal Bar
REV (Red) – Bearish Reversal Bar
CON (Green) – Bullish Continuation Bar
CON (Red) – Bearish Continuation Bar
B/O (Green) – Bullish Range Breakout Bar
B/O (Red) – Bearish Range Breakout Bar
TRN Bars is designed to spot bullish and bearish trends and reversals. The trend analysis is based on a new algorithm that weights several different inputs:
classical and advanced bar patterns and their statistical frequency
probability distributions of price expansions after certain bar patterns
bar information such as wick length in %, overlapping of the previous bar in % and many more
historical trend and consolidation analysis
It provides high-probability trend continuation analysis and reversal detections.
Up and Downtrend
The second column (Trend) indicates whether the price of the asset moves within an uptrend (UP) or a downtrend (DN), as detected by our unique swing detection algorithm, on the selected timeframe.
The swing detection algorithm identifies pivot points (swings) with high accuracy. It works in real-time and does not need a look-a-head to find swings.
Ranges & Range Breakouts
The third column provides insights into the price behavior of a symbol within the selected timeframe, as analyzed by the range feature of the TRN Bars algorithm.
ACTIVE – Price moves within a price range
UP – Breakout detected
DN – Breakdown detected
UP CONF – Breakout confirmed
DN CONF – Breakdown confirmed
The bar range feature automatically finds consolidations where the price range of several consecutives bars is rather small. The detection of the bar ranges includes among other things the overlapping percentage of these bars.
Divergence Detection for any given (Custom) Indicator
The divergence detector finds with unrivaled precision bullish and bearish as well as regular and hidden divergences. The main difference compared to other divergences indicators is that this indicator finds rigorously the extreme peaks of each swing, both in price and in the corresponding indicator. This precision is unmatched and therefore this is one of the best divergences detectors.
The build in divergence detector works with any given indicator, even custom ones. In addition, there are 11 built-in indicators. Most noticeable is the cumulative delta indicator, which works astonishingly well as a divergence indicator. Full list:
External Indicator (see next section for the setup)
Awesome Oscillator (AO)
Commodity Channel Index (CCI)
Cumulative Delta Volume (CDV)
Chaikin Money Flow (CMF)
Moving Average Convergence Divergence (MACD)
Money Flow Index (MFI)
Momentum
On Balance Volume (OBV)
Relative Strength Index (RSI)
Stochastic
Williams Percentage Range (W%R)
Another highlight of the divergence detection is that it works with every indicator, even custom ones. To do this, you must add the (custom) indicator to your chart. Afterwards, simply go to the “Divergence Detection” section in the indicator settings and choose "External Indicator". If the custom indicator has one reference value, then choose this value in the “External Indicator (High)” field. If there are high and low values (e.g. candles), then you also must set the “External Indicator Low” field.
The visualization of the divergence detection is represented in the fifth column (Div Bull) and the sixth and last column (Div Bear).
REG – Regular divergence detected
HID – Hidden divergence detected
Scanner Alerts
You can opt to receive alerts for the following scenarios:
Detected up and down swings
Detected bullish and bearish divergences
Detected bar trend changes
Confirmed Reversal Bars
Confirmed Continuation Bars
Confirmed ange breakouts
The alert function is activated for all symbols listed in the scanner and corresponds to the timeframe of the chart you are currently viewing. This ensures that you receive alerts specifically tailored to the symbols and timeframe you are interested in.
Risk Disclaimer
The content, tools, scripts, articles, and educational resources offered by TRN Trading are intended solely for informational and educational purposes. Remember, past performance does not ensure future outcomes.

Candlestick Reversal and Trend Signals [AlgoAlpha]🚀 Unleash your charting capabilities with the Candlestick Reversal and Trend Signals indicator by AlgoAlpha, your go-to tool for spotting pivotal market movements! This script enhances your trading experience by identifying key candlestick patterns and trend changes, perfect for traders aiming for precision in their technical analysis.
🛠 Key Features:
- 🔄 Multi-Timeframe Analysis : Leverages a timeframe multiplier to analyze levels on higher timeframes, enhancing the depth and applicability of insights.
- 🧩 Diverse Pattern Detection : Capable of detecting a wide array of patterns including Bull/Bear Engulfings, Dojis, Haramis, Piercing Lines, Dark Cloud Covers, and Morning/Evening Stars, each contributing to a robust trading strategy.
- 🔍 Dynamic Trend Filters : Utilizes three exponential moving averages (EMAs) and volume filters to decisively confirm trend directions and strength, providing a clearer picture of market dynamics.
- ⚙️ Customizable Settings : Features adjustable settings for filter period, signal thresholds, and appearance, allowing for a tailored analysis experience to fit individual trading styles.
- 📉 Swing Levels Identification : Marks significant high and low swing points on the chart, highlighting potential pivot points and trend reversals for strategic trading decisions.
📈 Quick Guide to Using the Candlestick Reversal and Trend Signals Indicator
1. 🛠 Add the Indicator : Add the indicator to your favorites. Adjust the settings to match your analysis needs.
2. 📊 Analysis : Keep an eye out for the specific symbols plotted on your chart that indicate various candlestick patterns. Use these signals to enhance your market analysis.
3. 🔔 Set Alerts : Enable alerts for the patterns you are most interested in to get notified of potential trading opportunities without needing to monitor the charts constantly.
Embark on your enhanced trading journey with this powerful tool! 🚀✨ Happy trading!
🧐 How It Works:
The Candlestick Reversal and Trend Signals indicator operates by integrating several candlestick patterns and trend analysis features to assist in making informed trading decisions. Initially, it gathers user-defined settings like the period for filtering, signal thresholds, and the desired patterns to detect. It analyzes candlestick formations such as Bull/Bear Engulfings, Dojis, Haramis, and more, by comparing the current candlestick's attributes (such as body length and direction) with previous data to identify potential market reversals or confirmations. The indicator enhances its accuracy through additional filters like volume ratios and exponential moving averages (EMAs) that help validate the strength and direction of trends. By marking these patterns and trends visually on the chart, it provides clear signals that aid traders in identifying significant market movements efficiently. The script is then complemented with the 3 EMA indicator for trend detection and swing levels for added confluence.

[Support and Resistance with Trend Lines] with Backtest (TSO) with Backtest (TSO)
===========================================================================
===========================================================================
This indicator serves as a comprehensive full-cycle trading system, providing alerts at each stage of the trade, from opening to closure. The algorithm uses most recent and historical S&R (Support and Resistance) levels with most recent and historical Trend Lines, generating signals for trades when Breaks/Bounces occur (Trade Open Signal triggers can be configured via very customizable indicator Input "Signal Trigger Matrix" settings). With signal for trade open, TP (Take Profit and SL (Stop Loss) levels are calculated as well and marked on the chart including alerts for each action of the trade. The indicator offers a variety of automated approaches for TP (Take-Profit) and SL (Stop-Loss) settings. These include static current/historical S&R (Support and Resistance) levels or S&R/Trend Lines dynamic breaks for TP (Take-Profit) and various SL (Stop-Loss) approaches, including ATR Trailing SL, opposite S&R (Support and Resistance) levels SL, opposite Trend Lines SL and more. This diverse set of tools ensure flexibility in tailoring TP (Take-Profit) and SL (Stop-Loss) parameters to different market conditions, contributing to a more adaptive and robust trading system. Additionally, a series of signal analysis tools, including market sentiment, candle bar analysis, divergence, and volume, enhance the precision of trading signals.
* Works with popular timeframes: 1M, 3M, 5M, 15M, 30M, 45M, 1H.
* Works well with Futures and Indices, can be used to trade Stocks, Crypto and FOREX.
* Includes LIVE alert/labels Breakouts and Bounces signal trigger feature, which can be used for scalping (NOTE: This approach cannot be backtested).
* Every action of the trade is calculated on a confirmed closed candle bar state (barstate.isconfirmed), so the indicator will never repaint.
==============================================================
Indicator examples:
---------------------------------------------------------------------------
Strategy Config: SRTL_MES_15M3Y_EODoff_ALL
Here is a nice example of MES (Micro E-Mini S&P 500 Index Futures) configuration, which uses S&R (Support and Resistance) breakouts as signal trigger with Elliot Wave confirmation and previous S&R historical levels for TP (Take-Profit).
---------------------------------------------------------------------------
An example of an intraday Tesla trade. Also the green arrows will be displayed IMMEDIATELY when Breakout/Reverse Bounce occurs (same an Alert will be triggered immediately).
===========================================================================
Trading open/close/TP/SL labels, plots and colors explanations:
---------------------------------------------------------------------------
>>> S&R (Support and Resistance) levels/lines: orange - support, blue - resistance (can be hidden).
>>> Trend Lines: yellow - support, green - resistance (can be hidden).
>>> Blue labels show resistance breakouts and bounces, light-blue - bullish, dark-blue - bearish
>>> Yellow labels show resistance breakouts and bounces, light-yellow - bullish, dark-yellow - bearish
>>> Green/Red arrows on top/bottom of candle bar will show LIVE breakouts (if turned on)
>>>>> LONG open: green "house" looking arrow below candle bar.
>>>>> SHORT open: red "house" looking arrow above candle bar.
>>>>> LONG/SHORT take-profit target: green/red circles (multi-profit > TP2/3/4/5 smaller circles).
>>>>> LONG/SHORT stop-loss target: green/red + crosses.
>>>>> LONG/SHORT take-profit hits: green/red diamonds.
>>>>> LONG/SHORT stop-loss hits: green/red X-crosses.
>>>>> LONG/SHORT EOD (End of Day | Intraday style) close (profitable trade): green/red squares.
>>>>> LONG/SHORT EOD (End of Day | Intraday style) close (loss trade): green/red PLUS(+)-crosses.
===========================================================================
STATS TABLE ///////////////////////////////////////////////////////////////
---------------------------------------------------------------------------
>>> Trading STATS table on the chart showing current trade direction, Last TP (Take-Profit) Taken, Current Trade PL (profit/loss in price difference from trade open to the very current state).
---------------------------------------------------------------------------
CUSTOM TRADING DATE RANGE /////////////////////////////////////////////////
---------------------------------------------------------------------------
>>>>> This feature can be used to manually set indicator trading range from and to a specific date and time. NOTE: This is not intended for a very long date range backtesting, utilize TradingView Strategy Tester for that.
* Use TradingView “Strategy Tester” to see Backtesting results
NOTE: If Strategy Tester does not show any results with Date Ranged fully unchecked, there may be an issue where a script opens a trade, but there is not enough TradingView power to set the Take-Profit and Stop-Loss and somehow an open trade gets stuck and never closes, so there are “no trades present”. In such case - manually check “Start”/“End” dates or use “Deep Backtesting” feature!
---------------------------------------------------------------------------
INTRADAY ACTIVE TRADING SESSION CONFIGURATION /////////////////////////////
---------------------------------------------------------------------------
>>> Regional Active Trading Session Hours Schedule: If selected - trades will only open during regional active trading session, if 'OFF', there will be no trading schedule and trades will open 24/7.
>>> EOD(End of Day) Close - On/Off: Close the trade if it's still open at the end of active trading session (on the very last candle bar). NOTE: If no region is selected at 'Regional Active Trading Session Schedule' - there will be no EOD(End of Day) Close and trades will run overnight until either SL(Stop-Loss) or TP(Take-Profit) is hit!
>>>>> EOD(End of Day) Close - 1 candle bar before last: This is specifically for stocks as while usually indices can be closed 15minutes after the market closes, for stocks - the last candle bar closes at the same time with the market active trading session, which if closed - trades can't be closed until next day/session! Enable this setting for the trade to close/alert 1 candle bar before the last one, so there is still time to close the trade at the Broker (NOTE: depending on the timeframe, 1 candle bar can be: 15sec, 30sec, 1min, 3min, 5min, 15min, 30min, 45min, 1h).
---------------------------------------------------------------------------
SIGNAL TRIGGER MATRIX ////////////////////////////////////////////////
---------------------------------------------------------------------------
>>> Trading Engine: This setting turns on TradingView Strategy trading engine for backtesting.
>>> Market Session Only: With this setting turned on, all signal trigger Breaks/Bounces will be hidden during Pre/Post market time.
>>> Plot S&R Levels/Lines: Plot S&R (Support and Resistance) on chart. Note: historical levels/lines will only be plotted if hit (Break/Bounce).
>>> Plot Trend Lines Levels/Lines: Plot Trend Lines levels/lines on chart. Note: historical levels/lines will only be plotted if hit (Break/Bounce).
>>> Use S&R Current Levels | Use S&R Historical Levels | Use Trend Lines Current Levels | Use Trend Lines Historical Levels |: Choose which levels should be used for Breaks/Bounces to be captured on. If all triggers are turned on/checked - whatever happens 1st wins the trigger.
>>> Breaks | Bounces: 'Breaks': Turn on Breaks through levels/lines signal trigger. | 'Bounces': Turn on Bounces off levels/lines signal trigger.
>>> Signal: Regular | Signal: S&R Combo | Signal: TL Combo | Signal: S&R + TL Combo | Signal: Repeat Action |: Trade open signal trigger execution approach MATRIX (If 1 or more turned on at the same time - whatever comes first will be the trade signal trigger). 'Regular': A single Break/Bounce must occur on a closed bar for signal trigger. 'S&R Combo': A combination of 2 Current + Historical S&R (Support and Resistance) Break/Bounce must happen in the same direction on same bar for signal trigger. 'TL Combo': A combination of 2 Current + Historical Trend Lines Break/Bounce must happen in the same direction on same bar for signal trigger. 'S&R + TL Combo': a combination of ANY S&R and Trend Line Break/Bounce must happen in the same direction on same bar for signal trigger. 'Repeat Action': Initial and then confirmation (2nd/3rd/etc. consecutive occurence) Break/Bounce must occur on same level/line for signal trigger.
>>> Historical - Look Back (# of days): How far back (in # of days) will historical S&R/Trend Lines will be used for Trade Open signals/TP/SL/etc.
>>> Historical - Look Back Invalidation (# of days): IF THERE IS TOO MUCH HISTORICAL LEVELS/LINES ON CHART - LOWER THIS SETTING + MAKE SURE IT'S SMALLER THAN 'Historical - Look Back (# of days)'. With big Look back period (5+ days) - it can become very messy with too many historical levels/lines. To clear oldest historical levels/lines - set Look Back Invalidation # of days to less than Historical Look Back # of days. (After X # of Look Back Invalidation days - older levels/lines will become invalidated and no longer used for opening trades/TP (Take-Profit)/SL (Stop-Loss), while newer levels/lines will still be discovered.
>>> S&R/Trend Lines - Support/Resistance combined into 1 entity: Every level or a line becomes simply a level or a line, regardless if it originally was a support or resistance. By default, depending on the level/line originally being support or resistance - the signal direction will be such as: Resistance is broken > LONG / bounced > SHORT; Support is broken > SHORT / bounced > LONG; with this setting on, either level or line can be both broken or bounced off in ANY direction, trade open direction will depend on current market sentiment only.
---------------------------------------------------------------------------
S&R CONFIGURATION ////////////////////////////////////////////////
---------------------------------------------------------------------------
>>> S&R Search - Left Bars (current): This setting is for calculating optimal S&R (Support and Resistance) levels (in combination with below - Right Bars).
>>> S&R Search - Right Bars (current): This setting is for calculating optimal S&R (Support and Resistance) levels (in combination with above - Left Bars).
>>> S&R Search - Custom Resolution (current): This is a custom timeframe setting specifically for S&R Search, it disregards current chart timeframe. This is great to use for scalping, for example: with main chart set to 1min and the custom timeframe set to 3min or 5min - there will be stronger support/resistance levels with more detailed price action.
>>> S&R Search - Left Bars (historical): This setting is for calculating optimal S&R (Support and Resistance) levels (in combination with below - Right Bars).
>>> S&R Search - Right Bars (historical): This setting is for calculating optimal S&R (Support and Resistance) levels (in combination with above - Left Bars).
>>> S&R Search - Custom Resolution (historical): This is a custom timeframe setting specifically for S&R Search, it disregards current chart timeframe. This is great to use for scalping, for example: with main chart set to 1min and the custom timeframe set to 3min or 5min - there will be stronger support/resistance levels with more detailed price action.
>>> S&R - Historical S&R Levels - Extend to the right: Extend all S&R lines to the right.
>>> S&R (Current/Historical) - Live Breakout/Bounce - ALERT/SHOW: NOTE: Alert wlil trigger immediately at price Breaking thru or Bouncing off level/line and an arrow above /below the bar will show the direction of breakout/bounce. If on that same live bar - price comes back causing the Breakout/Bounce become no longer valid - the arrow will disappear as the condition of the Break/Bounce will no longer be valid.
---------------------------------------------------------------------------
TREND LINES CONFIGURATION ////////////////////////////////////////////////
---------------------------------------------------------------------------
>>> Show: Trend Line development (where it 'did not exist' yet): It takes 2 pivots to develop a trend line, pivot is established at least 3 candle bars later from where the pivot is. With this setting turned on - it will plot dashed lines where trend lines originated connecting the 1st and 2nd pivot point up to where the trend line became established (where in reality you would now be able to draw a certain trend line). Established already generated trend line are plotted with a solid line.
>>> Trend Lines - Line Slope Confirmation: LONG breakout will only be shown if trend line is goind downslope \. SHORT breakout will only be shown if trend line is goind upslope /.
>>> Trend Lines - Search - Left Bars (current): This setting is for calculating optimal Trend Lines.
>>> Trend Lines - Search - Right Bars (current): This setting is for calculating optimal Trend Lines.
>>> Trend Lines - Custom Resolution (current): This is a custom timeframe setting specifically for S&R Search, it disregards current chart timeframe. This is great to use for scalping, for example: with main chart set to 1min and the custom timeframe set to 3min or 5min - there will be stronger support/resistance levels with more detailed price action.
>>> Trend Lines - Search - Left Bars (historical): This setting is for calculating optimal Trend Lines.
>>> Trend Lines - Search - Right Bars (historical): This setting is for calculating optimal Trend Lines.
>>> Trend Lines - Custom Resolution (historical): This is a custom timeframe setting specifically for S&R Search, it disregards current chart timeframe. This is great to use for scalping, for example: with main chart set to 1min and the custom timeframe set to 3min or 5min - there will be stronger support/resistance levels with more detailed price action.
>>> Trend Lines - Historical Trend Lines - Extend to the right: Extend all Trend Lines to the right.
>>> Trend Lines (Current/Historical) - Live Breakout/Bounce - ALERT/SHOW: NOTE: Alert will trigger immediately at price Breaking thru or Bouncing off level/line and an arrow above /below the bar will show the direction of breakout/bounce. If on that same live bar - price comes back causing the Breakout/Bounce become no longer valid - the arrow will disappear as the condition of the Break/Bounce will no longer be valid.
---------------------------------------------------------------------------
TAKE-PROFIT/STOP-LOSS CONFIGURATION ///////////////////////////////////////
---------------------------------------------------------------------------
>>> TP (Take-Profit) System: 'S&R Static Current/Historical': TP (Take-Profit) is calculated using current/historical S&R (Support & Resistance) levels at trade open and remains static. 'S&R/Trend Lines Dynamic Breaks': TP (Take-Profit) is fully dynamic and will be trigger at price above trade open price and with Breakout occurence (S&R or Trend Line current/historical breakout).
>>> TP (Take-Profit) # of targets: It is wise to divide the trade into several profit targets. With this setting - up to 5 TP (Take-Profit) targets can be approached. The trade will be equally divided up by the selected # of TP (Take-Profit) targets.
>>> SL (Stop-Loss) System: 'ATR-Trailing-SL': SL (Stop-Loss) is trail-following the ATR (Average True Range) line, NOTE: If at signal trigger, ATR will be against the trade direction - trade open signal will be skipped; 'S&R-Static-SL': SL (Stop-Loss) is set at trade open per optimal most recent S&R level and remains there until trade closes; 'TrendLines-Static-SL': SL (Stop-Loss) is set at trade open per optimal most recent trend line and remains there until trade closes; 'TrendLines-Dynamic-SL': SL (Stop-Loss) will be set per current opposite trend line and follow it until trade is open.; 'Oppos-Sig-Trd-in-Loss': SL (Stop-Loss) will trigger at opposite signal with trade currently at loss.
>>> SL (Stop-Loss) - On/Off: Without SL (Stop-Loss), unless EOD (End of Day) Close is turned on - there will be no SL (Stop-Loss) at all!
---------------------------------------------------------------------------
MARKET SENTIMENT CONFIRMATION ///////////////////////////////////////
---------------------------------------------------------------------------
>>> Market Sentiment: Signal is confirmed per Market Sentiment direction. If Market Sentiment is turned off - whatever signal comes 1st will be the trade open trigger.
---------------------------------------------------------------------------
SIGNAL ANALYSIS AND CLEANUP ///////////////////////////////////////////////
---------------------------------------------------------------------------
>>> Signal Cleanup - Bar Color: Include Bar Color (bullish/bearish) confirmation, LONG signal will only be opened if signal bar is green/bullish, SHORT if red/bearish.
>>> Signal Cleanup - Bar Directional Structure: Skip opposite bar structure types signals (For example: bearish green hammer).
>>> Signal Cleanup - Bar Doji Skip: Skip doji (indecisive) candles signals.
>>> Signal Cleanup - EWO (Elliott Wave Oscillator): Include EWO (Elliott Wave Oscillator), LONG will only be opened if EWO is bullish / SHORT if EWO is bearish.
>>> Signal Cleanup - VWAP (Volume-Weighted Average Price): Include VWAP (Volume-Weighted Average Price), LONG will only be opened if price is above VWAP / SHORT if price is below VWAP.
>>> Signal Cleanup - MA (Moving Average) Confirmation: Include MA (Moving Average), LONG will only be opened if MA is bullish / SHORT if MA is bearish.
>>> Signal Cleanup - ATR (Average True Range): Include ATR (Average True Range) confirmation, LONG will only be opened if ATR is bullish / SHORT if ATR is bearish.
>>> Signal Cleanup - Divergence(RSI + MACD): Include Divergence (RSI + MACD ) confirmation, LONG will only be opened if Divergence is bullish / SHORT if Divergence is bearish.
>>> Signal Cleanup - Volume % Strength: Include Volume strength/percentage confirmation, LONG/SHORT will only be opened with strong Volume matching the signal direction | By default, strong Volume percentage is set to 150% and weak to 50%.
>>> Signal Cleanup - Volume Above Average: Include Volume Above Moving Average (Volume closing bar closes above volume moving average) confirmation, LONG/SHORT will only be opened with Volume above average - Volume closed bar color must match the closed price color (bullish/bearish direction) + Volume bar must be closed above volume MA line).
---------------------------------------------------------------------------
===========================================================================
||||||||||||||||||||||||||||||||||| *** ||||||||||||||||||||||||||||||||||| *** |||||||||||||||||||||||||||||||||||
||||||||||||||||||||||||||||||||||| *** ||||||||||||||||||||||||||||||||||| *** |||||||||||||||||||||||||||||||||||
TP System - VERY IMPORTANT INFO!
-------------------------------------------------------------------------------------------------------------------
"TP PERCENTAGE" - amount by which current trade/position needs to be reduced/partially closed/sold.
-------------------------------------------------------------------------------------------------------------------
TP System: Dynamic
"TP PERCENTAGE" - will always be the same amount (trade/position size divided by the # of take-profit(TP) targets) and percentage to be closed will always be of the ORIGINAL trade/position.
-------------------------------------------------------------------------------------------------------------------
TP System: Static
"TP PERCENTAGE" - will always be the same amount IF take-profit(TP) targets are hit 1-by-1 (TP1 > TP2 > TP3 > TP4 > TP5), otherwise it will vary and unless it is a 1st take-profit(TP1), the REMAINING trade/position size will always be smaller than original and therefore the percentage to be closed will always be of the REMAINING trade/position and NOT the original one!
-------------------------------------------------------------------------------------------------------------------
"TP PERCENTAGE" CheatSheet (these are the only percentages you may see)
-----------------------------------------------------------------------
TP PERCENTAGE---Close/Sell Amount-------------Example (trade size: 50 stocks)
20%-------------trade size * 0.2--------------50 * 0.2 = 10 stocks
25%-------------trade size * 0.25-------------50 * 0.25 = 12.5(~13) stocks
34%-------------trade size * 0.34-------------50 * 0.34 = 17 stocks
40%-------------trade size * 0.4--------------50 * 0.4 = 20 stocks
50%-------------trade size * 0.5--------------50 * 0.5 = 25 stocks
60%-------------trade size * 0.6--------------50 * 0.6 = 30 stocks
66%-------------trade size * 0.66-------------50 * 0.66 = 33 stocks
75%-------------trade size * 0.75-------------50 * 0.75 = 37.5(~38) stocks
80%-------------trade size * 0.8--------------50 * 0.8 = 40 stocks
100%------------trade size--------------------50 = 50 stocks
-----------------------------------------------------------------------
If for any reason a portion of the current/remaining trade closed at such occurrence was slightly wrong, it is not an issue. Such occurrences are rare and with slight difference in partial TP closed is not significant to overall performance of our algorithms.
||||||||||||||||||||||||||||||||||| *** ||||||||||||||||||||||||||||||||||| *** |||||||||||||||||||||||||||||||||||
||||||||||||||||||||||||||||||||||| *** ||||||||||||||||||||||||||||||||||| *** |||||||||||||||||||||||||||||||||||
===========================================================================
Alert Settings (you don’t have to touch this section unless you will be using TradingView alerts through a Webhook to use with trading bot)
---------------------------------------------------------------------------
Here is how a LONG OPEN alert looks like.
NOTE: Each label , , etc. is customizable, you can change the text of it within indicator Input settings.
ALERT >>>>>>>>>>>>>>>>>>>>>>>>>>>>>>>>>>>>>>>>>>>>>>>
COIN: BTCUSD
TIMEFRAME: 15M
LONG: OPEN
ENTRY: 20000
TP1: 20500
TP2: 21000
TP3: 21500
TP4: 22500
TP5: 23500
SL: 19000
Leverage: 0
---------------------------------------------------------------------------
Here is how a TP1 alert will look with 5 TPs breakdown of the trade.
NOTE1: Next to TP1 taken it will show at which price it was triggered.
NOTE2: Next to "TP Percentage" it shows how much of the CURRENT/ACTIVE/REMAINING trade needs to be closed.
NOTE2: If TP2/3/4/5 comes before TP1 - the alert will tell you exactly how many percent of the trade needs to be closed!
ALERT >>>>>>>>>>>>>>>>>>>>>>>>>>>>>>>>>>>>>>>>>>>>>>>
COIN: BTCUSD
TIMEFRAME: 15M
LONG: TP1
TP1: 20500
TP Percentage: 20%
---------------------------------------------------------------------------
Here is how an alert will look for LONG - STOP-LOSS.
ALERT >>>>>>>>>>>>>>>>>>>>>>>>>>>>>>>>>>>>>>>>>>>>>>>
COIN: BTCUSD
TIMEFRAME: 15M
ENTRY: 20000
LONG: SL
SL: 19000
---------------------------------------------------------------------------
Here is how an alert will look for LONG - EOD (End of Day) In Profit close.
ALERT >>>>>>>>>>>>>>>>>>>>>>>>>>>>>>>>>>>>>>>>>>>>>>>
COIN: BTCUSD
TIMEFRAME: 15M
LONG: EOD-Close (profit)
ENTRY: 20000
EOD-Close: 21900
===========================================================================
Adding Alerts in TradngView
---------------------------------------------------------------------------
-Add indicator to chart and make sure the correct strategy is configured (check Backtesting results)
-Right-click anywhere on the TradingView chart
-Click on Add alert
-Condition: Select this indicator by it’s name
-Immediately below, change it to "alert() function calls only", as other wise there will be 2 alerts for every alert!
-Expiration: Open-ended (that may require higher tier TradingView account, otherwise the alert will need to be occasionally re-triggered)
-Alert name: Whatever you desire
-Hit “Create”
-Note: If you change ANY Settings within the indicator – you must DELETE the current alert and create a new one per steps above, otherwise it will continue triggering alerts per old Settings!
===========================================================================
Good Luck! (NOTE: Trading is very risky, past performance is not necessarily indicative of future results, so please trade responsibly!)
---------------------------------------------------------------------------
NOTE: There seems to be a strange glitch when strategy is running live, it will show "double-take" take-profits labels on the chart. This is not affecting the script logic and backtesting results, if you simply change the timeframe real quick to something else then back - it will no longer show the duplicate orders... this must be some sort of a glitch as every alert was thoroughly tested to make sure everything is working!

Swing Failure Pattern (SFP) [LuxAlgo]The Swing Failure Pattern indicator highlights Swing Failure Patterns (SFP) on the user chart, a pattern occurring during liquidity generation from significant market participants.
A Confirmation level used to confirm a trend reversal is also included. Users can additionally filter out SFP based on a set Volume % Threshold .
🔶 USAGE
Swing failure patterns occur when candle wicks exceed (above/below) a recent swing level but close back below/above it, and occur from more significant market participants engineering liquidity. This pattern can be indicative of a potential trend reversal.
A label and an accentuated wick line highlight the SFP (both can be disabled).
Using a higher "Swings" period will not return different SFP but will however potentially reduce their detection rate.
🔹 Confirmation Level
The confirmation level is the highest point between the previous swing and SFP for a bullish SFP, and the lowest point for a bearish SFP. This level allows confirming a trend reversal after an SFP once the price breaks it.
A small triangle will be displayed when the price closes beyond the confirmation level.
A more reactive and contrarian approach could use the SFP as an entry point, and the confirmation level for taking (partial) profit, or stop loss. The example below shows a possible scenario:
🔹 Volume % Threshold
During the occurrence of an SFP, the Volume % Threshold option allows comparing the cumulative volume outside the Swing level to the total volume of the candle. The following options are included:
Volume outside swing < Threshold: Volume outside the Swing level needs to be lower than x % of total candle volume. Prevent excessive liquidity generation.
Volume outside swing > Threshold: Volume outside the Swing level needs to be higher than x % of total candle volume. Requires more significant liquidity to be generated.
None: No extra filter is applied
Note that in the above case, the left SFP is no longer highlighted because the volume above the swing level was higher than the 25% threshold of the total volume.
When we change the setting to "Volume outside swing > Threshold", we get the reversed situation.
The "Volume outside Swing level" is obtained using intrabar - Lower TimeFrame (LTF) data.
At the intrabar (LTF) level, there are a maximum of 100K bars available. When using the Volume % Threshold filter, a vertical line will highlight the maximum period during which intrabars are available.
🔶 DETAILS
🔹 LTF Settings
When 'Auto' is enabled (Settings, LTF), the LTF will be the nearest possible x times smaller TF than the current TF. When 'Premium' is disabled, the minimum TF will always be 1 minute to ensure TradingView plans lower than Premium don't get an error.
Examples with current Daily TF (when Premium is enabled):
500 : 3-minute LTF
1500 (default): 1-minute LTF
5000: 30 seconds LTF (1 minute if Premium is disabled)
The concerning LTF can be seen at the right-top (default) corner.
🔶 SETTINGS
Swings: Period used for the swing detection, with higher values returning longer-term Swing Levels.
Bullish SFP: enable/disable bullish Swing Failure Patterns.
Bearish SFP: enable/disable bearish Swing Failure Patterns.
🔹 Volume Validation
Validation:
Volume outside swing < Threshold: The volume outside the swing level needs to be lower than x % of the total volume.
Volume outside swing > Threshold: The volume outside the swing level needs to be higher than x % of the total volume.
None: No extra validation is applied.
Volume % Threshold: % of total volume as threshold.
Auto + multiple: Adjusts the initial set LTF
LTF: LTF setting
Premium: Enable when your TradingView plan is Premium or higher
🔹 Dashboard
Show Dashboard: Display applied Lower Timeframe (LTF)
Location: Location of the dashboard
Size: Size of the dashboard
🔹 Style
Swing Lines
Confirmation Lines
Swing Failure Wick
Swing Failure Label
Lines / Labels: Color for lines and labels
SFP Wicks: Color for SFP wick line

Trend Tide Oscillator [UAlgo]🔶 Description:
The "Trend Tide Oscillator " is a technical analysis tool designed to identify potential trend reversals and overbought/oversold conditions in the market. It calculates an oscillator based on the Commodity Channel Index (CCI) and then applies smoothing techniques to provide a clearer view of market momentum.
🔶 Key Features:
Oscillator Calculation : The indicator calculates an oscillator based on the Commodity Channel Index (CCI), which is a momentum-based oscillator used to identify overbought and oversold conditions.
Smoothing : Smoothing techniques are applied to the oscillator to reduce noise and provide a clearer view of market momentum. This helps traders in identifying trends more effectively.
Support and Resistance Zones : The indicator plots support and resistance zones based on the highest and lowest values of the oscillator over a specified lookback (default 50) period. These zones can help traders identify potential areas of price reversal. The indicator considers volatility when plotting the support and resistance zones. This aims to create more adaptable levels that account for fluctuating market conditions.
Visualization : The indicator visually represents overbought and oversold conditions with shapes (⚠️), aiding traders in quickly identifying potential entry or exit points.
Customization : Users can adjust parameters such as oscillator length, smoothing, and overbought/oversold levels, support and resistance lookbacks according to their trading preferences.
🔶 Disclaimer :
This indicator is provided for informational and educational purposes only and should not be considered as financial advice. Trading in the financial markets involves risk, and users should conduct their own research and analysis before making any investment decisions.

BINANCE-BYBIT Cross Chart: Spot-Perpetual CorrelationName: "Binance-Bybit Cross Chart: Spot-Perpetual Correlation"
Category: Scalping, Trend Analysis
Timeframe: 1M, 5M, 30M, 1D (depending on the specific technique)
Technical analysis: This indicator facilitates a comparison between the price movements shown on the Binance spot chart and the Bybit perpetual chart, with the aim of discerning the correlation between the two charts and identifying the dominant market trends. It automatically generates the corresponding chart based on the ticker selected in the primary chart. When a Binance pair is selected in the main chart, the indicator replicates the Bybit perpetual chart for the same pair and timeframe, and vice versa, selecting the Bybit perpetual chart as the primary chart generates the Binance spot chart.
Suggested use: You can utilize this tool to conduct altcoin trading on Binance or Bybit, facilitating the comparison of price actions and real-time monitoring of trigger point sensitivity across both exchanges. We recommend prioritizing the Binance Spot chart in the main panel due to its typically longer historical data availability compared to Bybit.
The primary objective is to efficiently and automatically manage the following three aspects:
- Data history analysis for higher timeframes, leveraging the extensive historical data of the Binance spot market. Variations in indicators such as slow moving averages may arise due to differences in historical data between exchanges.
- Assessment of coin liquidity on both exchanges by observing candlestick consistency on smaller timeframes or the absence of gaps. In the crypto market, clean charts devoid of gaps indicate dominance and offer enhanced reliability.
- Identification of precise trigger point levels, including daily, previous day, or previous week highs and lows, which serve as sensitive areas for breakout or reversal operations.
All-Time High (ATH) and All-Time Low (ATL) levels may vary significantly across exchanges due to disparities in historical data series.
This tool empowers traders to make informed decisions by leveraging historical data, liquidity insights, and precise trigger point identification across Binance Spot and Bybit Perpetual market.
Configuration:
EMA length:
- EMA 1: Default 5, user configurable
- EMA 2: Default 10, user configurable
- EMA 3: Default 60, user configurable
- EMA 4: Default 223, user configurable
- Additional Average: Optional display of an additional average, such as a 20-period average.
Chart Elements:
- Session separator: Indicates the beginning of the current session (in blue)
- Background: Indicates an uptrend (60 > 223) with a green background and a downtrend (60 < 223) with a red background.
Instruments:
- EMA Daily: Shows daily averages on an intraday timeframe.
- EMA levels 1h - 30m: Shows the levels of the 1g-30m EMAs.
- EMA Levels Highest TF: Provides the option to select additional EMA levels from the major timeframes, customizable via the drop-down menu.
- "Hammer Detector: Marks hammers with a green triangle and inverted hammers with a red triangle on the chart
- "Azzeramento" signal on TF > 30m: Indicates a small candlestick on the EMA after a dump.
- "No Fomo" signal on TF < 30m: Indicates a hyperextended movement.
Trigger Points:
- Today's highs and lows: Shows the opening price of the day's candlestick, along with the day's highs and lows (high in purple, low in red, open in green).
- Yesterday's highs and lows: Displays the opening price of the daily candlestick, along with the previous day's highs and lows (high in yellow, low in red).
You can customize the colors in "Settings" > "Style".
It is best used with the Scalping The Bull indicator on the main panel.
Credits:
@tumiza999: for tests and suggestions.
Thanks for your attention, happy to support the TradingView community.

RSI AcceleratorThe Relative Strength Index (RSI) is like a fitness tracker for the underlying time series. It measures how overbought or oversold an asset is, which is kinda like saying how tired or energized it is.
When the RSI goes too high, it suggests the asset might be tired and due for a rest, so it could be a sign it's gonna drop. On the flip side, when the RSI goes too low, it's like the asset is pumped up and ready to go, so it might be a sign it's gonna bounce back up. Basically, it helps traders figure out if a stock is worn out or revved up, which can be handy for making decisions about buying or selling.
The RSI Accelerator takes the difference between a short-term RSI(5) and a longer-term RSI(14) to detect short-term movements. When the short-term RSI rises more than the long-term RSI, it typically refers to a short-term upside acceleration.
The conditions of the signals through the RSI Accelerator are as follows:
* A bullish signal is generated whenever the Accelerator surpasses -20 after having been below it.
* A bearish signal is generated whenever the Accelerator breaks 20 after having been above it.

Sequencer [LuxAlgo]The Sequencer indicator is a tool that is able to highlight sequences of prices based on their relative position to past prices, which allows a high degree of customization from the user.
Two phases are included in this script, a "Preparation" phase and a "Lead-Up" phase, each with a customizable amount of steps, as well as other characteristics.
Users can also highlight the last step leading to each phase completion with a level, this level can eventually be used as a key price point.
🔶 USAGE
The script highlights two phases, each being based on a sequence of events requiring prices to be higher/lower than prices various bars ago.
The completion of the preparation phase will lead to the evaluation of the lead-up phase, however, it isn't uncommon to see a reversal occurring after the completion of a preparation phase. In the script, bullish preparations are highlighted in green, while bearish preparations are highlighted in red.
Completion of a "Lead-Up" phase is indicative of a potential reversal, with a bullish reversal for the completion of a bullish lead-up (in blue), and a bearish reversal for the completion of a bearish lead-up (in orange).
Using a higher length for the preparation/lead-up phases can allow the detection of longer-term reversals.
Users wishing to display levels based on specific phases completion can do so from the settings in the "Preparation/Lead-Up Completion Levels" settings group.
The "Show Last" settings determine the amount of respective levels to display on the chart.
🔶 PREPARATION PHASE
The "Preparation" phase precedes the "Lead-Up" phase. The completion of this phase requires N successive prices to be lower than the closing price P bars ago for a bullish phase, and for prices to be higher than the closing price P bars ago for a bearish phase, where N is the user set "Preparation Phase Length" and P the user set "Comparison Period".
🔹 Refined Preparations
Sequences of the preparation phase can either be "Standard" or "Refined". Unlike the standard preparation previously described a refined preparation requires the low prices from the user-specified steps in "Refined Preparation Steps" to be above the low price of the last step for a bullish preparation phase, and for the high prices specified in the refined preparation steps to be below the high price of the last step for a bearish preparation phase.
🔶 LEAD-UP PHASE
The "Lead-Up" phase is initiated by the completion of the "Preparation" phase.
Completion of this phase requires the price to be lower than the low price P bars ago N times for a bullish phase, and for prices to be higher than the high price P bars ago N times for a bearish phase, where N is the user set "Lead-Up Phase Length" and P the user set "Comparison Period".
Unlike with the "Preparation" phase these conditions don't need to be successive for them to be valid and can occur at any time.
🔹 Lead-Up Cancellation
Incomplete "Lead-Up" phases can be canceled and removed from the chart once a preparation of the opposite sentiment is completed, avoiding lead-ups to be evaluated after completion of complete preparations.
This can be disabled by toggling off "Apply Cancellation".
🔹 Lead-Up Suspension
Like with refined preparations, we can require specific steps from the lead-up phase to be higher/lower than the price on the last step. This can be particularly important since we do not require lead-up steps to be successive.
For a bullish lead-up, the low of the last step must be lower than the minimum closing prices of the user-specified steps for it to be valid, while for a bearish lead-up, the high of the last step must be higher than the maximum closing prices of the user-specified steps for it to be valid.
This effectively allows for eliminating lead-up phases getting completed on opposite trends.
🔶 SETTINGS
🔹 Preparation Phase
Preparation Phase Length: Length of the "Preparation" phase.
Comparison Period: Offset used to compare current prices to past ones.
Preparation Type: Type of preparation to evaluate, options include "Standard" or "Refined"
Refined Preparations Steps: Steps to evaluate when preparation type is "Refined"
🔹 Lead-Up Phase
Lead-Up Phase Length: Length of the "Lead-Up" phase.
Comparison Period: Offset used to compare current prices to past ones.
Suspension: Applies suspension rule to evaluate lead-up completion.
Suspension Steps: Specifies the steps evaluated to determine if the lead-up referral is respected. Multiple steps are supported and should be comma-separated.
Apply Cancellation: Cancellation will remove any incomplete lead-up upon the completion of a new preparation phase of the opposite sentiment.
🔹 Levels
Bullish Preparations Levels: When enabled display price levels from completed bullish preparations.
Show Last: Number of most recent bullish preparations levels to display.
Bearish Preparations Levels: When enabled display price levels from completed bearish preparations.
Show Last: Number of most recent bearish preparations levels to display.
Vortex [GOODY]The "Vortex " indicator introduces a novel approach to trend, enhancing the traditional Vortex Indicator (VI) by integrating a dynamic trend direction line, customizable trend exhaustion alerts, and improved visual clarity with additional features to aid in identifying not just the trend's direction but also its sustainability.
Key Features:
• Enhanced Trend Direction Line: Beyond the standard VI+ and VI- calculations, our indicator plots a trend direction line that averages these values, offering a clear visual cue of the market's overall direction. This line's color adapts based on the trend's strength and potential exhaustion, providing immediate insight into market sentiment.
• Customizable Trend Exhaustion Level: With the user-defined viExhaustionLevel, traders can set their thresholds for what they consider to be an overextended trend, adding a strategic layer to their analysis. This feature aims to signal when a trend might be reaching a point of reversal or slowdown, offering an opportunity for preemptive strategy adjustment.
• Trend Signal Alerts: Automated alert conditions for uptrend and downtrend signals facilitate timely decision-making. Traders can configure alerts to notify them of significant crossovers in VI+ and VI-, ensuring they don't miss critical market movements.
• User-friendly Interface: The option to toggle the trend direction line on or off caters to diverse analysis preferences, ensuring that the chart remains as streamlined or detailed as the user desires.
• Visual Enhancements: Background color coding and horizontal reference lines improve the indicator's usability, making it easier for traders to interpret the data at a glance.
Practical Applications:
• Trend Following: Ideal for traders who specialize in trend-following strategies, providing early signals of trend formation and potential exhaustion.
• Risk Management: By identifying potential trend reversals, traders can make informed decisions about entry and exit points, improving their risk management.
• Market Analysis: Offers a comprehensive overview of market dynamics, aiding in the analysis of various assets across timeframes.

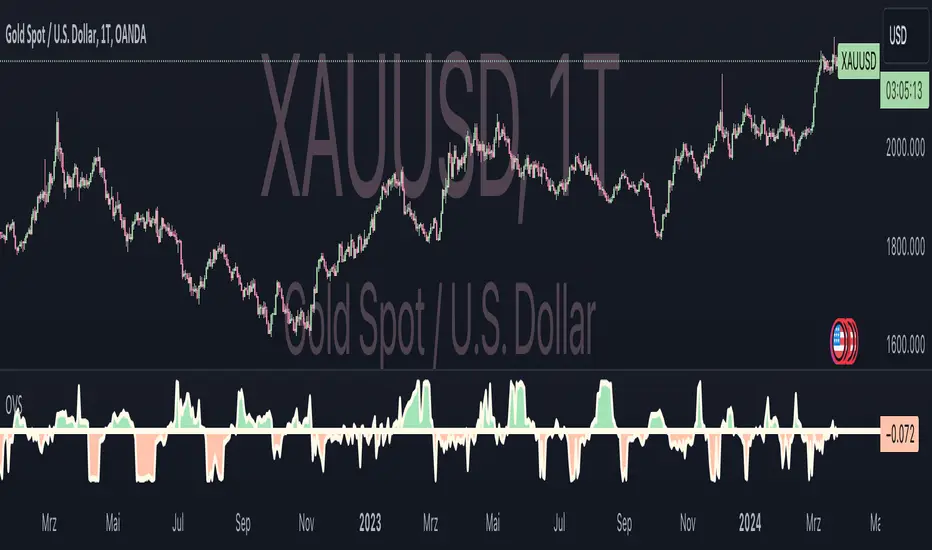
Oster's Vola Sentiment (OVS)Overview:
Oster's Vola Sentiment (OVS) is an indicator that reflects market sentiment dynamics based on volatility , employing Oster's Volatility Method for calculation. Inspired by traditional volatility analysis, this indicator provides a versatile tool for traders to interpret market sentiments and identify potential trading opportunities, including potential reversal points . By adjusting the period length in the settings, users can fine-tune OVS sensitivity to capture buy or sell signals, achieving different signal qualities.
Sophisticated Calculation Methodology:
The OVS derives insights from Oster's Volatility Method, utilizing metrics related to price range and movement to assess market dynamics. It calculates the relative movement index, providing traders with a quantifiable measure of market sentiment. Additionally, OVS incorporates the Average True Range (ATR) to further refine its analysis, ensuring comprehensive insights into market volatility dynamics.
Interpretation:
Oster's Vola Sentiment (OVS) , represented on the chart, offers traders insights into market sentiment dynamics and potential reversal points . Values above 0 indicate a buy tendency, suggesting favorable conditions for buying opportunities, while values below 0 suggest a sell tendency, signaling potential selling pressure. The probability of a significant market move increases as OVS values approach the predefined buy or sell thresholds. Values exceeding the buy threshold indicate stronger buying signals, while values below the sell threshold signify stronger selling signals. By aligning these interpretations with the trader's investment strategy, OVS aids in decision-making processes, offering nuanced perspectives on market movements.
Dynamic Color Coding for Visual Clarity:
To enhance user experience and facilitate quick decision-making, OVS incorporates dynamic color coding . Market conditions favoring selling are denoted by red hues, while those conducive to buying are highlighted in green. Neutral conditions, indicative of balanced market sentiment, are represented in neutral colors. This intuitive visual feedback enables traders to swiftly identify market opportunities and risks, empowering them to make informed trading decisions.
Customizable Parameters for Tailored Analysis:
Acknowledging the diverse trading preferences and strategies of its users, OVS offers customizable parameters. Traders can adjust the period length to fine-tune the indicator's sensitivity to their desired level, balancing the frequency and quality of signals according to their trading objectives. Additionally, OVSs alert functionalities allow traders to set personalized thresholds, aligning with their risk tolerance and market outlook.
Conclusion:
In conclusion, Oster's Vola Sentiment (OVS) emerges as a valuable addition to the trader's toolkit, offering a versatile and accessible approach to market analysis. Built upon Oster's Volatility Method and sophisticated calculation methodologies, OVS provides traders with actionable insights into market sentiment across various timeframes and asset classes , including potential reversal points. Its intuitive visualizations, coupled with customizable parameters and alert functionalities, empower traders to navigate dynamic market conditions with confidence. Whether you're a seasoned investor or a novice trader, OVS equips you with the tools needed to stay ahead in today's competitive markets.
Double Inside bar // Consecutive Inside Bar = Ak47Double Inside Bar Indicator Or Consecutive Inside Bar Highlighting
This custom Pine Script indicator is crafted for traders who utilize the traditional Inside Bar . A Double Inside Bar is a more specific pattern, involving two consecutive bars that are both contained within the range of a preceding "mother bar". This script not only detects these patterns but also emphasizes consecutive occurrences with a distinctive visual marker, aiding traders in identifying these setups amidst market fluctuations.
Features:
Double Inside Bar Detection: Identifies Double Inside Bars, where two successive bars are completely contained within the range of the preceding bar. This pattern indicates potential continuation or reversal with a stronger conviction.
Consecutive Pattern Highlighting: Highlights consecutive Double Inside Bar patterns, offering a clear visual indication for traders. This feature can be enabled or disabled as per the user's preference.
Bullish and Bearish Color Coding: Differentiates bullish and bearish setups by coloring the bars green or red, respectively, providing immediate insights into market sentiment.
Unique Visual Markers: Utilizes shapes to indicate bullish (triangle up) and bearish (triangle down) Double Inside Bars. For consecutive patterns, irrespective of being bullish or bearish, a yellow diamond is displayed below the bar to focus on the pattern's potential for signaling substantial market moves.
Trading Strategy:
Buy Signal: When a Double Inside Bar pattern is detected, a buy signal is generated. The entry point for the trade is set just above the high of the mother bar, with a stop loss placed just below the low of the mother bar, aiming to capture upward breakouts effectively.
Sell Signal: A sell signal is indicated by the detection of a Double Inside Bar pattern. The trade entry is positioned just below the low of the mother bar, with a stop loss above the high of the mother bar, targeting potential downward breakouts.
Why Use This Indicator?
Enhanced Decision Making: By providing clear visual cues for Double Inside Bar patterns and especially emphasizing consecutive occurrences, traders can make more informed and confident decisions.
Adaptability: The ability to toggle the highlighting for consecutive patterns allows traders to customize the indicator to match their trading style and the prevailing market conditions.
Simplicity and Effectiveness: This indicator streamlines the detection of significant Double Inside Bar patterns, helping traders to focus on their strategy and manage their time more efficiently.
Conclusion
This Double Inside Bar Indicator is a vital tool for traders looking to leverage the predictive power of Double Inside Bar patterns. With its unique consecutive highlighting feature and intuitive color coding, it enhances trading strategies by pinpointing potential breakout opportunities with higher precision.

Multi-Spectral RSI Deviations [AlgoAlpha]🌌 Multi-Spectral RSI Deviations by AlgoAlpha - Dive into Market Dynamics! 🌠
Dive deep into the essence of market trends with our 🚀 Multi-Spectral RSI Deviations indicator, a comprehensive tool designed by AlgoAlpha to enhance your trading strategy. By harnessing the power of multiple RSI lengths and innovative smoothing techniques, this indicator offers a unique perspective on market momentum and potential reversals.
🔍 Key Features:
🎨 Customizable up and down colors for immediate trend recognition.
🔢 Three RSI lengths for multi-layered market analysis.
🔄 Various Moving Average (MA) types including SMA, EMA, and more for tailored smoothing.
✅ Bullish and Bearish divergence plotting for spotting potential reversals.
🕵️♂️ Adjustable divergence sensitivity settings to fine-tune signal detection.
🔔 Built-in alerts for trend shifts and reversal conditions, ensuring you never miss a trading opportunity.
🚀 Quick Guide to Using the Multi-Spectral RSI Deviations Indicator
🛠 Add the Indicator: Search for "Multi-Spectral RSI Deviations" in TradingView's Indicators & Strategies. Adjust the RSI lengths and MA settings to suit your trading strategy.
🔍 Market Analysis: Keep an eye on the color changes for trend direction and use divergence plots to anticipate potential market reversals.
🔔 Alerts Setup: Activate the built-in alerts for trend shifts and reversals to stay ahead of the game without having to constantly monitor the charts.
🧠 How It Works:
At the core of the Multi-Spectral RSI Deviations indicator is its ability to analyze the market through various RSI lengths, providing a comprehensive view of momentum. The indicator calculates the Relative Strength Index (RSI) over three different periods, creating a spectrum of momentum insights. These RSI values are then compared to each other to identify the momentum shifts within the market.
To refine these insights, the differences between these RSI values are smoothed using a selected Moving Average type, such as SMA, EMA, etc., based on user preference. This smoothing process helps in highlighting the overall trend direction and potential reversal points with greater clarity.
Furthermore, the indicator employs a color-coding system, where the plotted line changes color based on the momentum's direction—shifting to an up color for positive momentum and a down color for negative momentum. This visual cue enables traders to quickly discern the market trend at a glance.
Divergences between the price action and the indicator's values are another cornerstone of this tool. By plotting potential bullish and bearish divergences, the indicator provides early signals of possible trend reversals, offering traders a strategic advantage.
Embrace the power of our 🌌 Multi-Spectral RSI Deviations and elevate your trading to stellar heights! 🌠✨

Period Value ZonesPeriod Value Zones is designed to help traders understand where current value is being found by splitting the day into 3 key periods based on common reversal times recognized for intraday trading.
By splitting the day into 3 periods, we can more efficiently determine where short-term value lies by using only the data we consider relevant during these periods of time.
> Overview
This indicator is recommended for low timeframe trading during the New York RTH Session.
By only trading within this session, we can ensure that volume and volatility remain fairly consistent.
Within each Period, you will find on the chart:
Value Area Points from Previous period (Value High(VAH)/Value Low(VAL)/Point of Control(POC))
Volume Weighted Average Price (VWAP) Cloud, based on High and Low values during the period.
Value Zone based Potential Reversal Zones.
Additional Displays:
Potential Reversal Detection Signals with Invalidation Levels
Forward Plotted Key Market times.
> Components
• Value Area Points
VAH/VAL/POC are important volume profile points which display where the market has previously held value.
We use these specific levels as support and resistance to confirm direction by monitoring interactions between price and these important levels.
The VAH and VAL lines change colors based on price's interaction with them to confirm whether that level should be regarded as support or resistance.
• VWAP Cloud
VWAP is a common metric used to determine the strength of a trend, and provides a point to look for re-bid & re-offer.
When price breaks out of our Fixed Value zone, VWAP helps us determine further direction.
Also included is VWAP deviation bands, for traders who would prefer to view the standard deviation away from this cloud as well.
• Value Reversal Zones
These Zones are calculated based on extensions of the Period Value Zone.
While in a balanced market, these zones have been shown to provide potential reversal opportunities.
• Potential Reversal Signals
These signals are based on an advanced method for confirming a higher-low or lower-high to reasonably create a signal that is not very laggy but also rooted in sound logic.
While helpful, These are NOT buy or sell signals, and you should always use further analysis to decide the next steps to take.
When a signal appears, an associated invalidation level is also displayed, if this level is crossed the associated signal is no longer considered relevant.
• Key Market Times
These are important times within the day that normally produce volatility caused by daily market catalysts.
Each key time is forward plotted 1 hour before it occurs to provide a clear heads up for potential opportunity.
Opening Fuel: Known for having an increase in Volume after the formation of the 15min Opening Range.
1st Reversal: Common Area for seeing initial large positioning effecting the market, often causing reversals.
Initial Balance Close: End of the first hour, a common positioning tool for futures traders.
2nd Reversal: Positioning is typically reactionary to IB Close, alongside Euro Traders Exiting Positions.
Euro Close: Close of Europe Session, a common positioning tool for futures traders.
Lunch: Usually Low Volume, traders are often out to lunch.
Lunch End: Volume tends to re-enter, as traders come back from lunch.
1st Reversal: New Hour, common area to see large position re-enter the market.
Bonds Close: Bonds markets close, Equities reacting to close of the bond market.
1st MOC: Initial Market on Close orders are places, market reaction is normally expected off of MOC positioning.
MOC Close: As MOC orders are reported, volatility is likely found within the market.
> Methodology
This indicator can be used with the same principles as trading balanced volume profiles.
Rule 1: Unless the price breaks and holds Value High or Value Low, we should expect buyers and sellers to maintain the current balance.
Rule 2: If we break and push away from the Period Value High, we should treat that level as supportive on retest unless we look back below and sellers defend on retest.
Rule 3: If we break and push away from the Period Value Low, we should treat that level as resistance on retest unless we look back above and buyers defend on retest.
Rule 4: If we recover Value Low, and it becomes supportive, we look for our Period POC and Period Value High as our targets above.
Rule 5: If we fail to hold Period Value High, and it becomes resistance, we look for our Period POC and Period Value Low as targets below.
Balance in the context of this indicator is considered as the area between Period Value High and Period Value Low
Acceptance outside of balance in the context of this indicator is considered as Period Value Low or High, becoming supportive or resistance.
> Examples
Theoretical Example:
In the bullish example below, price holds VWAP and makes POC supportive, showing interest from buyers pushing to Value High.
Real-World Example:
Below is an example of the same setup as the theoretical example, taking place on a real futures chart.
By utilizing these rules, we can look for opportunities at these levels and have a plan for how we should be interacting with them.
This will help us determine likely targets and risk-off levels that are based on volume and current "value" from participants.
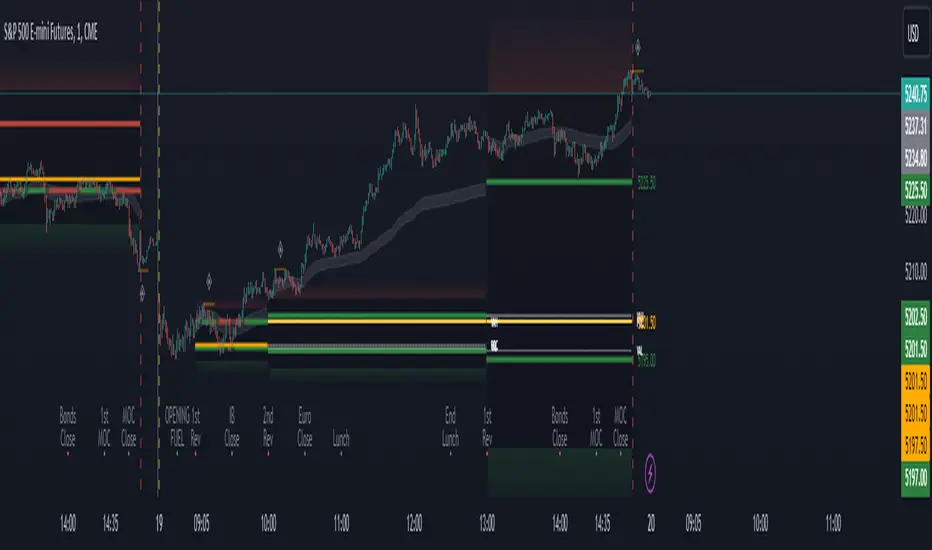
Liquidation Levels with Liquidity Sweeps/Breakouts [AlgoAlpha]🌊📈 Dive into the depths of market liquidity with "Liquidation Levels with Liquidity Sweeps/Breakouts" - your ultimate tool for navigating the turbulent waters of trading! 🧹💹 Crafted by the wizards at AlgoAlpha, this Pine Script™ masterpiece illuminates the unseen liquidity levels and sweeps, guiding you through the financial seas with insight. 🚀🔍
Key Features:
🕒 Timeframe Flexibility: Customize your analysis with a TimeFrame Multiplier, allowing the indicator to operate on higher timeframes for broader market insight.
💥 Dynamic Volume Threshold: Set your sensitivity to breakouts with the High Volume Threshold, ensuring you catch significant market movements while avoiding fakeouts.
👀 Visibility Controls: Toggle the display of swept liquidity and highlight liquidity breakouts with customizable background colors for clear, actionable insights.
🎨 Custom Appearance: Personalize your chart with bullish, bearish, and breakout colors to match your trading style.
How to Use the Liquidity Levels with Liquidation Sweeps Indicator:
Maximize your trading efficiency with the Liquidity Levels with Liquidation Sweeps Indicator by following these simple steps! 🚀🌟
⚙️ Customize Settings: Access the indicator settings to personalize the TimeFrame Multiplier, High Volume Threshold, and Relative Volume Period. Tailor these settings to match your trading strategy and chart preferences.
👁️ Analyze Liquidity Levels: Monitor the chart for liquidity levels and sweeps. Bullish sweeps are marked with green labels, bearish sweeps with red, and breakouts highlighted by the chart background.
🔔 Set Alerts: Enable alert conditions for liquidity breakouts and sweeps within the indicator's settings. This feature allows you to receive real-time notifications, helping you to act promptly on trading opportunities.
How It Works:
The heart of this indicator lies in its ability to track and highlight liquidity levels derived from swing pivots, and sweeps across multiple timeframes. By calculating relative volume against a user-defined threshold, it identifies strong volume movements indicative of liquidity breakouts, this helps filter out fake-outs. When a liquidity level is breached but not completely mitigated, it's either marked as a bullish or bearish sweep, which come with the option to show an estimate of the number of liquidations during the sweep.
if peakform and peakprinted != 1
aR.push(line.new(bar_index-mult, h.get(1), bar_index+1, h.get(1), color = red))
aRv.push(h.get(1))
peakprinted := 1
if valleyform and valleyprinted != 1
aS.push(line.new(bar_index-mult, l.get(1), bar_index+1, l.get(1), color = green))
aSv.push(l.get(1))
valleyprinted := 1

Trend Reversal Composite Index
Overview
The "Trend Reversal Composite Index" (TRCI) is a comprehensive technical analysis tool that combines several indicators to identify potential trend reversals and assess the overall market pulse. The script integrates a variety of technical indicators, including RSI, Stochastic, MACD, Bollinger Bands, Williams %R, OBV, ADX, ATR, and the Relative Volatility Index, each with adjustable weights to fine-tune their influence on the composite scores.
Key Features
Customization : Users can select the "Standardization Type" (Normalized or Z-Score) to standardize indicator values, catering to different analysis preferences.
Composite Scores : The script calculates two main composite scores: the "Trend Reversal Composite" and the "Market Pulse Composite," each derived from a weighted sum of standardized indicator values.
Indicator Weighting : Each indicator's impact on the composite scores can be adjusted through user-defined weights, enabling personalized sensitivity settings.
Dynamic Visuals : The script plots the composite scores and their exponential moving averages (EMAs) on the chart, offering a clear visualization of the market's condition and trend reversals.
Signal Identification : It provides clear "go long" and "go short" signals based on the crossover and crossunder of the composite score and predefined thresholds, assisting in decision-making.
Utility and Originality
TRCI stands out due to its integrative approach, combining multiple indicators into a single composite index. This not only simplifies the analysis by providing a consolidated view of various signals but also enhances the decision-making process by aggregating the predictive power of individual indicators. Its flexibility in customization through adjustable weights and standardization types allows users to tailor the tool according to their trading style and market conditions.
Implementation and Usage
To utilize the TRCI effectively, traders should first experiment with the weights of different indicators based on their trading strategy and the market's volatility. The composite scores offer a straightforward interpretation: higher values may indicate potential buying opportunities, while lower values could signal selling points. The inclusion of EMAs further aids in smoothing out the signals, providing a more reliable indicator of trend direction.
Conclusion
The "Trend Reversal Composite Index" is a versatile and innovative tool for traders looking to streamline their technical analysis and enhance their decision-making process. Its combination of multiple indicators into composite scores, customizable through user-defined weights, makes it a valuable addition to any trader's toolkit.
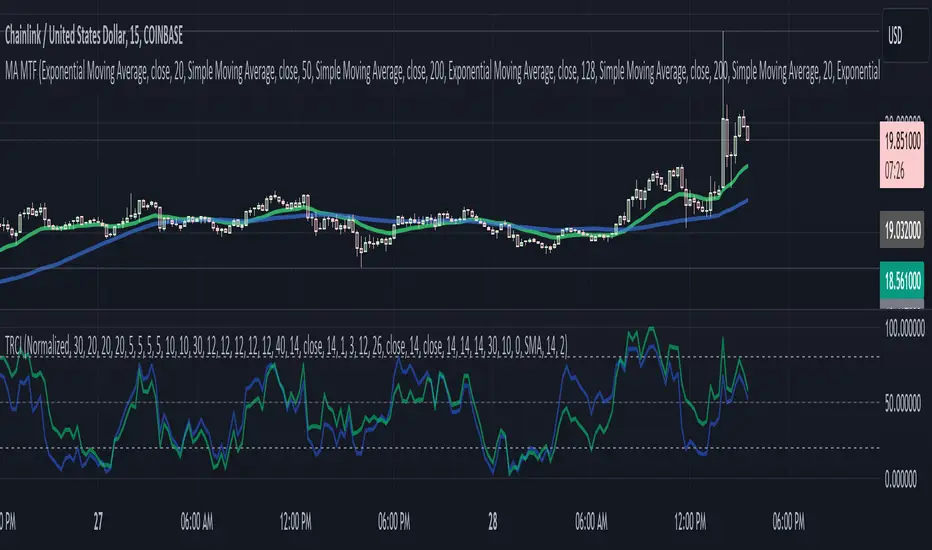
WaveTrend Ribbon [AlgoAlpha]🌟🚀 Introducing the WaveTrend Ribbon by AlgoAlpha - Your Next-Level Trading Companion! 🚀🌟
Dive into the world of advanced trading with the WaveTrend Ribbon by AlgoAlpha, a cutting-edge indicator designed to elevate your trading strategy on TradingView. 📈💡 This powerful tool combines the efficiency of the WaveTrend oscillator with innovative Z-score analysis to offer clear, actionable trading signals. 🌊🎯
Key Features:
🔧 Customizable Parameters: Tailor the indicator to your trading needs with adjustable settings including Channel Length, Average Length, Overbought/Oversold Levels, and more.
📊 WaveTrend Oscillator: Utilizes a smoothed version of the average price to identify potential market reversals.
📉 Z-Score Analysis: Enhances signal reliability by measuring the standard deviation of the current price from the mean.
🎨 Dynamic Color Coding: Visual cues shift between up and down colors to indicate market trends, making it easy to read at a glance.
⚠️ Divergence Detection: Automatic identification of bullish and bearish divergences for early signal warnings.
🔔 Custom Alerts: Stay ahead with real-time alerts for key trading events like bullish/bearish divergences and trend reversals.
How to Use WaveTrend Ribbon :
Maximize your trading potential with the WaveTrend Ribbon by following these simple steps:
🔍 Add to Chart: Locate "WaveTrend Ribbon " in TradingView's Indicators & Strategies and apply it to your chart. Dive into the settings to customize the parameters like Channel Length, Average Length, and the Overbought/Oversold levels to match your trading strategy.
- Channel Length affects the sensitivity of the WaveTrend oscillator to price movements. A shorter Channel Length increases responsiveness, useful in volatile markets but may lead to false signals. It's ideal for traders looking for quick reactions to price changes.
- Average Length is used to smooth the oscillator further, influencing how quickly the indicator responds to trend changes. A shorter Average Length allows for a quicker response to the oscillator's movements, suitable for short-term trading strategies.
📊 Analyze the Market: Pay close attention to the color transitions and position of the Z-score in relation to its moving average for insights into market direction. Look out for the overbought and oversold conditions for potential reversal points.
🔔 Set Up Alerts: Utilize the built-in alert system to get notified of key events like trend reversals, bullish and bearish divergences, and more, so you can make timely decisions without having to constantly monitor the charts.
Basic Logic Explained:
The WaveTrend Ribbon is an advanced trading indicator that leverages the WaveTrend oscillator, enhanced by Z-score normalization and moving averages for precise market trend analysis. It calculates the average price deviation over a set period (Channel Length), smoothing it with an Average Length to identify trends. Z-score analysis further refines signals by comparing oscillator deviations against its historical performance, highlighting overbought or oversold conditions. The indicator generates signals for potential reversals and market entries/exits, visualized through dynamic color coding and customizable alerts for traders to act upon efficiently. This multi-layered approach provides a deeper insight into market dynamics, offering a blend of trend following and momentum strategies.
By highlighting overbought and oversold conditions with dynamic color changes and providing reversal signals, this indicator is a must-have tool for traders aiming to capitalize on market trends. 📈🚀
Elevate your trading experience with the WaveTrend Ribbon, your go-to indicator for navigating the markets with confidence and precision. Happy trading! 🌟🚀

Divergence Signal [TradingFinder] RSI & MACD Reversal On Swing🔵 Introduction
Sometimes in analyzing price charts using indicators, you may observe a discrepancy. For instance, while the price of stocks, currencies, or commodities is increasing, the indicator shows a decrease. Such a phenomenon in technical analysis is termed "divergence." Divergences are categorized into three types based on their formation and the prediction they make about the continuation of the price trend: "Regular Divergence," "Hidden Divergence," and "Time Divergence."
🟣 Important :
• This indicator exclusively identifies regular divergences since its primary function is to detect reversal points.
• This indicator identifies divergences using three indicators: "Moving Average Convergence Divergence" (MACD), "Relative Strength Index" (RSI), and "Awesome Oscillator" (AO). The user can choose each of these indicators in the settings using the "Divergence Detection Method" dropdown menu for identifying divergences. These settings are by default set to the MACD mode.
🔵Types of Divergence
Divergences, as mentioned, offer different predictions about the continuation of price trends. Hence, they have various types. We will focus on explaining regular divergences based on this indicator.
🟣 Regular Divergence(RD) :
Regular divergence is a situation arising from contradictory behavior between the indicator and the price chart at the end of a trend. By identifying regular divergences, we anticipate a change in trend direction resembling a reversal pattern.
Regular divergence has two types based on the trend and prediction:
Negative Regular Divergence (RD-) :
This type occurs between two price peaks at the end of an uptrend. Despite forming a new high, the indicator fails to recognize it, indicating a negative regular divergence. The likelihood of a subsequent downtrend is high. Negative divergence suggests strong selling pressure and weak buying power, portraying an unfavorable future for the stock.
Positive Regular Divergence (RD+) :
In contrast, positive regular divergence happens at the end of a downtrend and between two price troughs. As depicted in the chart, although the price forms a new low, the indicator doesn't acknowledge it. Positive regular divergence indicates robust buying pressure and weak selling power. Upon identifying positive divergence in the chart, we expect a price increase for the stock under review
🔵 How to Use
Information from the indicator is displayed in two ways: Table and Label.
🟣 Table : The table displays information about the latest divergence. This includes the type of divergence, existence or absence of divergence, consecutive divergences, divergence quality, and change in indicator phase.
Type Divergence : Indicates the type of divergence, which can be either "Bullish Divergence" or "Bearish Divergence."
Exist : Indicates the presence of divergence with a "+" sign and absence with a "-" sign. A green color is used for bullish divergence and red for bearish divergence.
Consecutive : Shows the number of consecutive divergences. For example, if there are 3 consecutive divergences, the number 3 is displayed.
Divergence Quality : Displays the quality of the divergence based on the number of consecutive divergences. If there is 1 divergence, the quality is "Normal"; for 2 divergences, it's "Good"; and for 3 or more divergences, it's "Strong."
Change Phase Indicator : Indicates whether a phase change in the indicator has occurred with "+" for yes and "-" for no.
🟣 Label : Unlike the table, which only shows information about the latest divergence, labels display information about each divergence at the point where it occurs. The information includes the type of divergence, detection method, divergence quality, consecutive divergences, and change in phase indicator. The selected method of detection is also displayed. For example, if the chosen method is the "AO" indicator, the label will show "Method: AO."
🔵 Settings
Fractal Period : Determines the period of swings. The minimum and default value is 2.
Divergence Detect Method : Selects the indicator (MACD, RSI, or AO) used for detecting divergences. The default indicator is MACD.
Show Fractal : Chooses whether to display fractals or not. The default is "No."
Show Table : Determines whether to display the table or not. The default is "Yes."
Show Label : Chooses whether to display labels or not. The default is "Yes."
Label Size : Adjusts the size of the labels from "Tiny" to "Large."

Weighted Average Volume Depth [QuantraSystems]Weighted Average Volume Depth
Introduction
The Weighted Average Volume Depth (𝓦𝓐𝓥𝓓) indicator is calibrated to provide extensive insights, calculated using volumetric price action and volume depth, and provides dynamic adjustments based upon historical volatility.
This indicator is a valuable asset for traders and investors, aiming to capture trends, measure dynamic volatility, and provide market reversion analysis in a systematic way.
Legend
Volumetric Top Cap: Plotted at y = 0, this line represents the probabilistic maximum value, or ‘cap’ for the signal line. It is colored using a binary color scheme, and indicates the dominant trend direction - green for an uptrend and purple for a downtrend.
Base Line: Calculated using a volume-weighted volatility measurement, this line is used as the benchmark to calculate momentum in the 𝓦𝓐𝓥𝓓 indicator.
Signal Line: The signal line represents the volume and volatility weighted measurements, and oscillates between the Base Line and Top Cap. Its position between these levels provides the depth of insights available in this script.
When the signal line is remaining in close proximity to the base line, this is indicative of a low volatility market environment. These periods are also reflected as muted bar coloring when the ‘Trend Intensity’ setting is enabled.
Conversely, when the signal line approaches, or even breaks above the Top Cap, this is characteristic of an unsustainable trending action - and probabilistically speaking, a reversion or consolation is likely to occur at these levels.
Highlighting: When this setting is enabled, background coloring is applied when the Signal Line breaks above the Top Cap. This highlights green as an oversold zone, and purple as an overbought zone.
Reversal Signals: When price begins to reverse from a zone of overextension, a signal is plotted when this reversion occurs from a high probability zone.
Circle - Shows a possible bullish reversal.
Cross - Shows a possible bearish reversal.
Case Study
In the above image, we showcase three distinct trades in short succession, showcasing the 𝓦𝓐𝓥𝓓’s speed and accuracy under the right conditions.
The first long trade was initiated upon receiving a bullish reversal signal. The trade was then closed after the price experienced a sharp upwards movement - and an overbought signal was indicated by the purple shading.
The second, short trade was entered on the next bar, after a bearish reversal signal was printed by the indicator (a white cross). Similarly, this trade was closed upon the oversold signal.
Once again, a reversal signal was indicated by the 𝓦𝓐𝓥𝓓 indicator. This time a bullish signal (a white circle), and hence a long position was opened. However, this trade was held until a negative trend confirmation (signaled by the Top Cap’s shift in color). This makes apparent the indicator’s flexible nature, and showcases the multiple signaling types available for traders to use.
Recommended Settings
The optimal settings for the 𝓦𝓐𝓥𝓓 indicator will vary upon the chosen asset’s average level volatility, as well as the timeframe it is applied to.
Due to increased volatility levels on lower timeframes, it is recommended to increase the 'Top Cap Multiplier' to take into account the increased frequency of false signals found in these trading environments. The same can be said when used on highly volatile assets - a trader will likely benefit from using a higher 'Top Cap Multiplier.'
On more price-stable assets, as well as any asset on higher timeframes, there is merit to tightening the length of the 'Top Cap Multiplier,' due to the slower nature of price action.
Methodology
The 𝓦𝓐𝓥𝓓 starts with calculating the volume weighted average price and the volume weighted variance - which is the expectation of the squared deviation of a variable from its mean, giving insights into the distribution of trading volume.
Using the volume weighted variance, a standard deviation value is calculated based on user input. This value acts as the ‘Volumetric Top Cap’ - seen in the 𝓦𝓐𝓥𝓓 indicator window as the zero line.
The signal line is calculated as the difference between the current price and the theoretical upper or lower VWAP deviation bands. This line acts as the trigger for identifying prevailing trends and high probability reversal points.
The base line serves as a reference point for historical momentum. It is calculated using an exponential moving average of the lowest signal line values over a defined lookback period. This baseline helps in assessing whether the current momentum is high or low relative to historical norms.
Notes
Bar coloring can be turned off - especially useful when stacking multiple indicators as recommended, or set to 'Trend Intensity,' or 'Binary Trend' (which reflects the top cap coloring).
It is always recommended to never rely on a single indicator - and instead build and test multiple strategies utilizing more than one indicator as confirmation.
