[UPRIGHT Trading] Awesome STC+Hello Traders,
I hope you all are doing well.
Today I'm releasing another one of my favorites: the Schaff Trend Cycle (STC). In 2008, Doug Schaff publically released the STC as an improvement on cycle oscillators and the MACD, hence its common nickname, "The better MACD."
This oscillator is essentially a fusion of the benefits of trend and cycle indicators; the idea is to minimize their drawbacks, such as lags or false signals. The STC is mainly used to determine or confirm price direction and market reversals.
We calculate the STC as a double smoothed stochastic of the MACD, which outputs an oscillator that moves between 0 and 100.
How is it typically used?
In trending markets, we can expect the oscillator to move up if the market is in the accelerating uptrend and an accelerating downtrend are to push the oscillator down.
In sideways markets, the STC shows oversold when it reverses after falling below 25; overbought when the STC turns down from above 75.
How the Awesome STC+ is different:
This STC uses several complex equations and filters to improve accuracy and reduce lag.
My original STC wave.
Multiple extremely accurate Buy/Sell signals not found on a traditional STC indicator.
Ability to use 4 different background highlights and several buy/sell and confirmation signals.
Fully customizable (as always), ability to turn on or off any signals, change any of the colors to suit your needs.
Pre-filled Alerts.
Reversals and Continuations.
Chart should look like this:
Please see the "Author's Instructions" for access.
Cheers,
Mike
(UPRIGHT Trading)
Reversal

Reversal Indicator
█ OVERVIEW
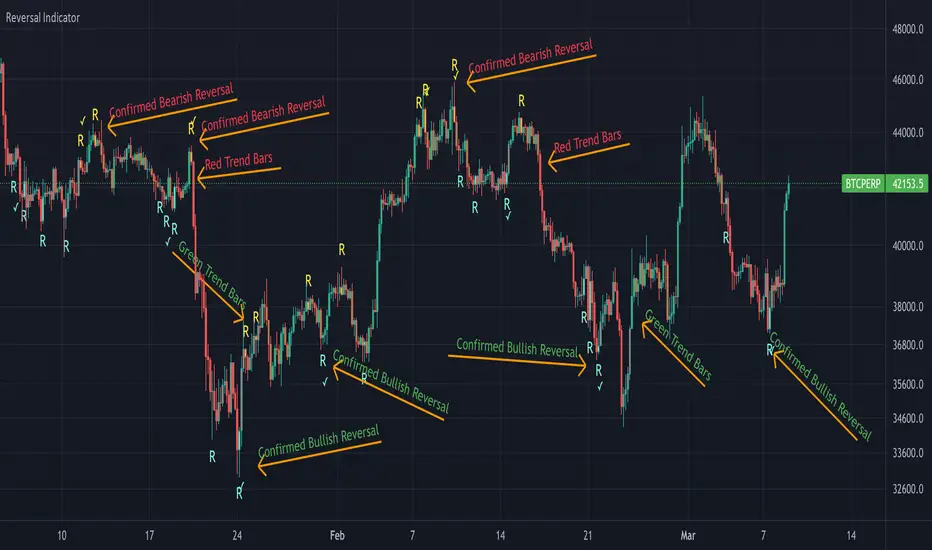
This indicator shows bullish and bearish reversal signal candles. It finds the candles with extreme volatility and marks the candles with high probability for a reversal of the trend.
█ CONCEPT
This indicator uses the Bollinger Bands to mark the candles with high selling/buying pressure. Bollinger Bands consist of three bands total: an upper band, middle band, and lower band. These separate bands are each used to highlight extreme prices in a specific security. The upper band is associated with overbought, whereas the lower band points to oversold, and the middle band acts as a moving average.
It is common after a lower band has been broken by heavy selling for the price of the asset to revert back above the point of the lower band and move closer to the middle band. The indicator marks this occurrence as a bullish reversal candle. Same applies vice versa. If the upper band is broken by heavy buying, it is natural for the price to revert back and move closer to the middle level. This indicator marks this as a bearish reversal candle.
█ HOW TO USE IT
Reversal Candles - Sky blue colored "R" indicates bullish reversal candle and yellow colored "R" indicates bearish reversal candle.
Checkmarks - Checkmarks provide a confirmation that the reversal has already begun with the candle next to the signal candle. Always wait for confirmation before considering it as a reversal of the trend.
RSI confluence - Enabling this check box in settings will show the reversal signal only when the RSI is overbought/oversold
█ LIMITATION
As like in any indicator, this indicator needs to be used with the assistance of other indicators to make conceptual and strategic trading decisions.
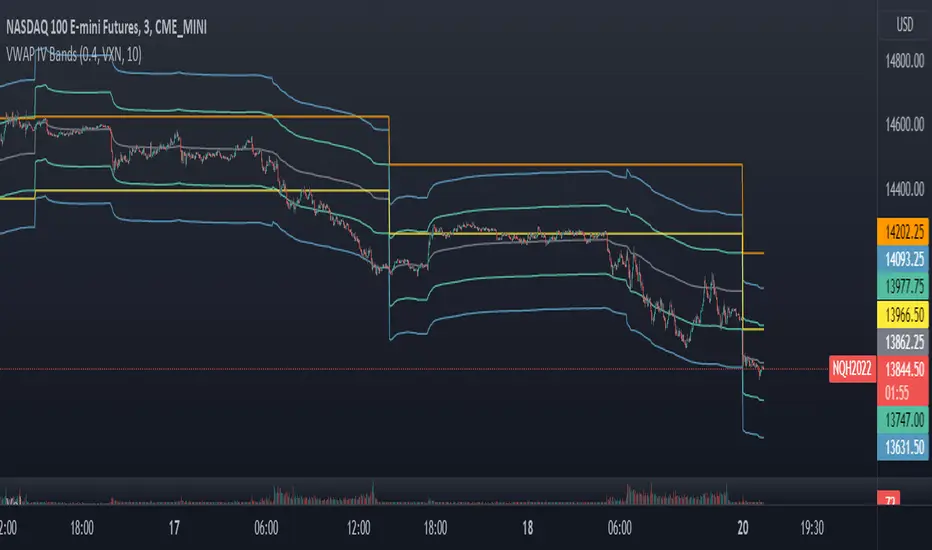
VWAP Implied Volatility BandsThis script takes the built in VWAP function and creates bands using various Volatility Indexes from the CBOE. The script plots the bands at desired multiples, as well as the closing value of the prior day's first set of bands. Users can choose from the following:
VIX(ES), VXN(NQ), RVX(RTY), OVX(CL), GVX(GC), SIV(ZS), CIV(ZC), TYVIX(ZN), EUVIX(EURUSD), BPVIX(GBPUSD)
Upon selecting the desired volatility index, users must change the multiplier to fit the underlying product since the indexes are all calculated differently.
The goal with this script was to use market generated information (IV) to highlight potential trade locations.
Pivot Points High Low & Missed Reversal Levels [LuxAlgo]Pivot Points High/Low, sometimes referred to as "Bar Count Reversals" allows highlighting market prices local tops and bottoms. This method compares the price value at a certain index within a user-specified window length and tests whether it is the highest (pivot high) or lowest (pivot low).
This method can return successive pivots of the same type, thus missing certain reversals, as such, we aimed to highlight those missed reversals and provide a level at their location to determine if they had any significant role to play. A zig-zag is additionally built, connecting regular pivots with missed reversals.
Settings
Pivot Length: Determine the "Bar Count Reversals" window size. higher values will highlight more significant reversals.
Other settings control the look of the displayed graphical elements within the indicator.
Usage
Missed reversals are highlighted by labels with a ghost emoji, a Zig-Zag line connecting a missed reversal is dashed. Note that labels are offset by -Pivot Length bars (with the exception of the most recent one), and as such are detected further ahead of their location.
When a missed reversal is detected, a level is displayed, starting at the location of the missed reversal and ending when a new missed reversal is detected.
These levels can be used as support and resistance.
The most recent label estimates the possible location of a confirmed reversal, and will continuously readjust whether price makes a new higher high/lower low depending on the type of previously detected pivot. A level is also made out of this estimated reversal.

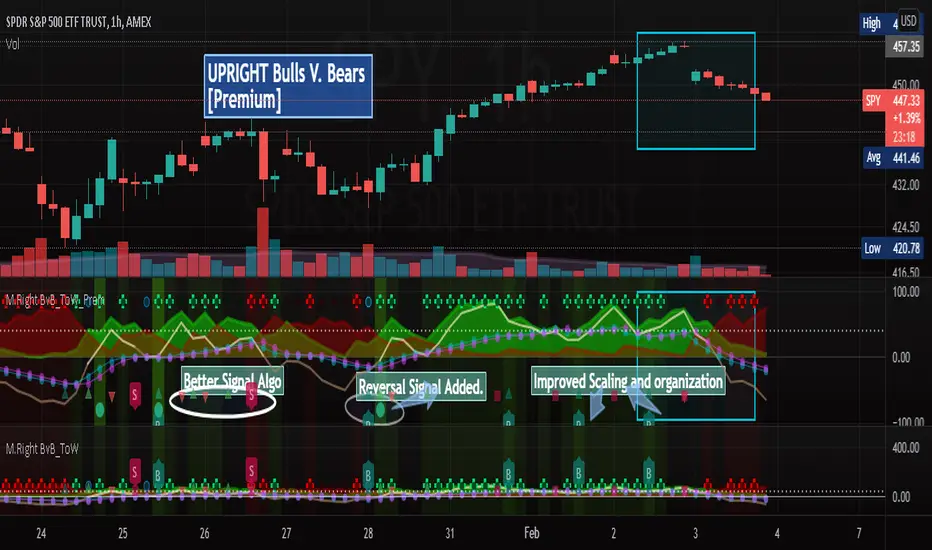
[UPRIGHT] Bulls-V-Bears Tug-of-War SquidGame [Premium] (cc)Hello Traders,
Today I'm updating the Bull V. Bears with a Premium version. (Note: the other version is shown below the Premium on the chart above)
……"The game is Tug of War, the side that pulls the rope from the middle to their side wins. Let the game begin."……
How it works:
This indicator is not a typical one.
1) It shows visually when Bull volume or Bear volume is ‘pulling the rope to their side’.
2) It uses several different formulas to get an accurate read on the level of volume , but still keeps peaks and troughs within 100 for easy reading.
3) Update: It was originally meant to be used strictly with other indicators, but it can now be used as a standalone indicator.
__________________________________
Legend:
1) The top line signals give the major signals –
a. Red cross = Bearish volume strength and continuation.
b. Green cross = Bullish volume strength and continuation.
i. + Green Dot inside enhances signal.
ii. + Red Dot inside weakens signal.
c. Blue circle = Can indicate the beginning of a reversal to the upside or downside.
d. Pink circle = Can indicate the beginning of a reversal to the downside.
2) The Bottom signals are triggered when one circle-rope crosses over the other, these signals give confirmation to the top line signals – Red bearish / Green bullish .
3) As shown on the chart, the Reversal setup usually consists of a blue circle, followed by a red or green cross, then confirmation from the bottom signal.
4) Without the signals: green obviously is Bullish especially above the threshold set --Red bearish . The regular rope gives trend indication.
I've added tooltips to make it easy to understand, feel free to leave a comment if you still have a question!
__________________________________
Features:
-Tooltips (hover over - Info) for understanding.
-Works well on all timeframes; even 5min, I made a tooltip for recommended lengths.
-Customizable Signals; with the ability to turn on and off.
-Reversal signals: Pink and Blue circles can indicate reversals coming.
-Works well as a leading standalone indicator.
-Adjustable top signal row.
-Background Highlights.
-Alerts
-Rules added (hover over).
__________________________________
Premium :
-Better signal algo (will likely be updated again soon)
-Reversal Signal added (Large Circle)
-Improved Scaling and Organization - Now easier to see large moves/signals on Multiple timeframes.
Chart should look like:
Cheers,
Mike
(UPRIGHT Trading)
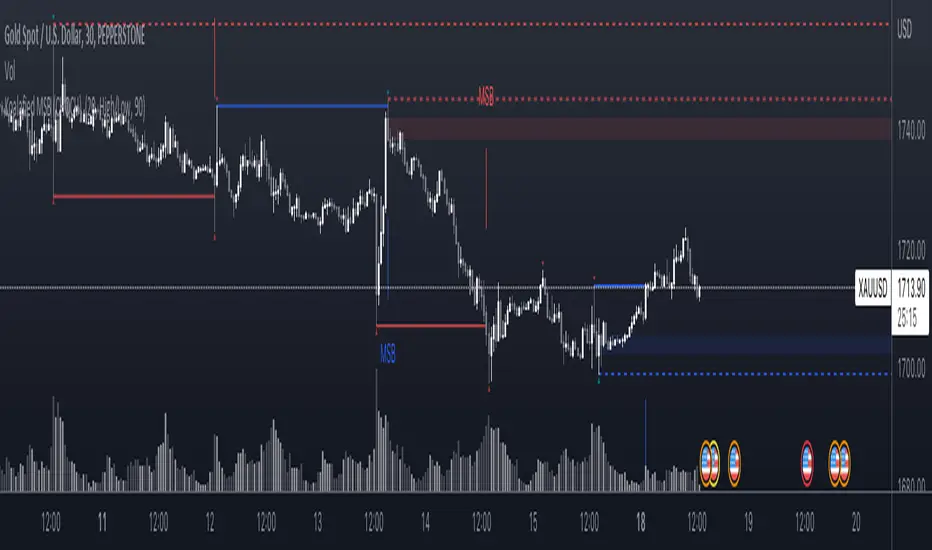
Koalafied MSB (CHOCH) Indicator will show market structure breaks (MSB) - higher lows being broken in an uptrend and vice versa for lower highs in a downtrend.
These levels are derived from user selected pivot lengths and are plotted on the chart after the break for reference.
User option to filter MSB by the principles of a CHOCH - Change of Character which represents a possible change in market direction. A CHOCH requires a filter to be valid. The previous pivot high needs to be broken first putting in a higher high. Then if there's a break of the previous higher low the CHOCH is validated. Traders will then wait for a pullback for a retest of an orderblock/level before entering in a reversal trade. Additionally the CHOCH pullback target level, which is the candle/orderblock at the pivot prior to the MSB will be displayed and kept onscreen until broken.
As MSB are based on pivot points there is an inherent lag built into the script. The user selected length that the pivots are calculated on requires a number of bars to pass before a pivot is confirmed. Market Structure Breaks typically occur multiple bars after a pivot point so the offset isn't typically an issue, although occasionally a pivot will be validated after a MSB and it's offset plot will place it prior to the MSB.
Naked Bar Upward ReversalAMEX:SPY
The Naked Bar Upward Reversal is a three bar candlestick pattern with an inside candle as a entry point. This pattern is bullish since it has a candle closing red from the previous candle; the most bearish pattern possible. The following inside candle is a reversal of its previous candle with an open above the previous candle's close. Look to buy the next open above the inside candle's close.
This is a bullish reversal pattern and should be used in this context. Successful entries are found in corrections along an upward trend, or buying into a dip. Performance drops when the pattern appears at tops. To improve profitability, use a cluster of evidence to enhance the performance of this pattern. The intended time frame is within the daily and weekly.

[UPRIGHT Trading] Top & Bottom Finder [Premium]Hello Traders,
Today I'm releasing an updated version of my previous Top & Bottom Finder (M.Right_Top & Bottom Finder 1.0).
The timing of this release couldn't be more perfect with everyone trying to 'find the bottom'. And the increased volatility that we've been seeing as of late.
Essentially, my indicator uses volatility and standard deviations among other things to assist you in finding the top or bottom of trends. You may also notice that it uses a lot of different strength indicators to provide an additional layer of complexity and confirmation.
Not just an RSI, but an RSI ema, smoothed OBV RSI's, and other volume RSI's. This is a truly unique and powerful tool for any Trader - whether you've just started or you've been trading for 20 years, I'm confident you will find value in the UPRIGHT Trading Top & Bottom Finder.
How to use it:
When it detects the trend Bottoming or Topping the histogram will change color. Bottom - Green/blue, Top - Red, (different shades of colors for different types of detection).
I've spent several hours tweaking the calculations and filters to enhance the accuracy, so this will be a noticeable upgrade from my original Top & Bottom Finder.
The length of the histogram bar can be an indication in itself, especially when it lines up close to one of the plotted lines and has noticeable direction change following this.
I've added a lot of text and pictures to help display it's capabilities, features, and customizability.
As always, it's fully customizable with alerts. Can toggle any thing on or off, and change the colors to suit your style.
3 Unique RSI's, different colors on the histogram will show different levels of detection. Some are more accurate in some timeframes than others. Bright Green and Bright Red are the most different from the rest.
I've jam-packed this indicator with Buy/Sell and Confirmation Signals and even background highlights (with colors that can mesh together). Feel free to find what works best for you.
RSI color indications and background highlights aid in confirmation. Also, as mentioned previously, sometimes a gray bar will land on a Fib and it will be a bottom signal.
The above chart should look like this
Good luck Traders,
Cheers,
Mike
(UPRIGHT Trading)

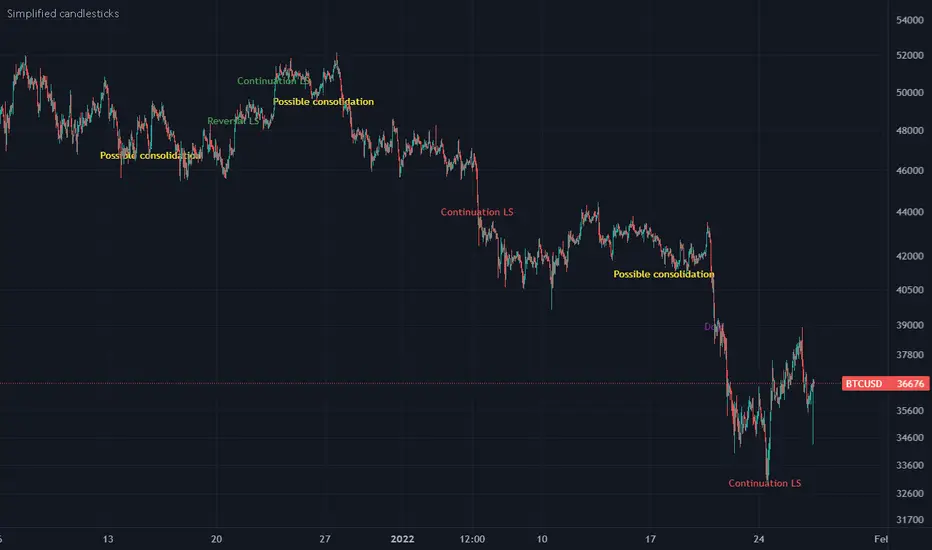
Simplified candlesticksSimplified candlesticks tracks sticks for their body and wick
- For Long bars sticks ( LS ) tracks and marks them on down trend as continuation and reversal if moves appositive direction.
- For largest wicks on ends marks as regular Doji
- For large wicks and medium body marks as possible consolidation
- For only bottom bigger wick as bears weakness if trend down and possible reversal if trend is up.
- For only upper bigger wick as bulls weakness if trend up and possible reversal if trend is down
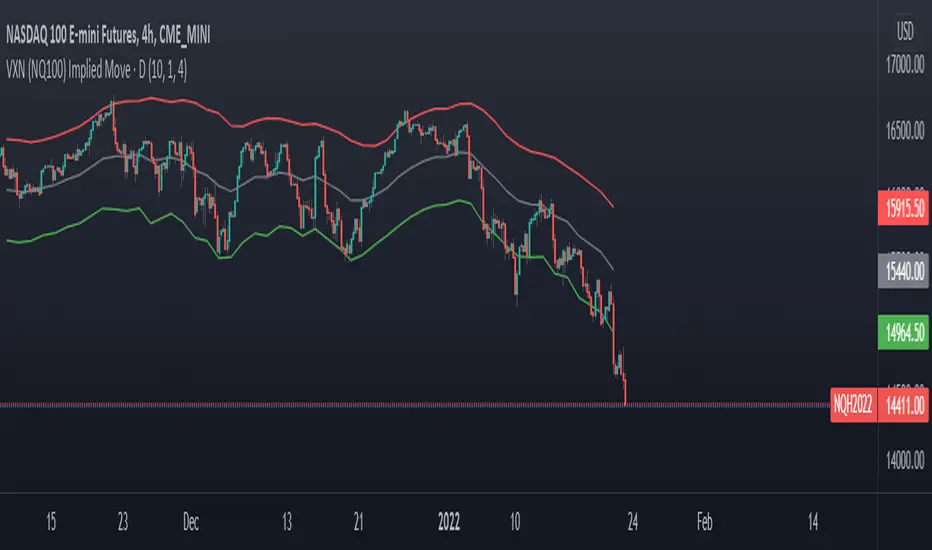
VXN (NQ100 VIX) Implied Move Bands for NQ futures.A spin-off of my similar script for ES futures. This script uses the VXN Index instead of the VIX, which represents the 30-day implied volatility of Nasdaq-100 options and then uses that value to plot bands on the chart, helping traders identify price extremes as identified by the options market. Users can modify the moving average, bands multiplier, and number of lookback days used in the calculation to suit their trading style.
[Rygel] Trend Reversal IndicatorThis indicator is a trend reversal detector. It provides a bullish or bearish signal derived from the analysis of 22 indicators.
It analyzes and aggregates the divergences and the overbought and oversold conditions to determine a signal strength going from -100 to 100.
You can choose the appearance of the signals, how sensitive you want the signals to be and the indicators you want to use.
You can also display divergences, and show signal, divergence, overbought and oversold strength as a background color.
This indicators also provides several alerts.
You can find more information about the divergence algorithm I'm using on this page .
Please note this indicator will not give you buy nor sell signals. A bullish signal will not always be followed by a bearish one and vice-versa. You may get the same type of signals for a long time ; expect to see far more bearish signals in a bullish market and far more bullish signals in a bearish market.
You should never make a buy or sell decision based solely on this indicator, even when the signal is very strong.
This indicator is made to help you to confirm your market analysis and to warn you of possible incoming trend reversals so you can anticipate them and adapt your trading strategy accordingly. It may also help you to optimize your DCA times of purchase.
Please note a signal becomes final only after the bar after it is closed, as a divergence pivot may still be invalidated by then. When the signal bar is closed, the signal is considered as confirmed but may still disappears if it is invalidated by the next bar. When the second bar is closed, the signal is made final and stays definitely on the chart.
This indicator currently supports the following indicators as sources:
AO (Awesome Oscillator)
BBP (Bear Bull Power)
CCI (Commodity Channel Index)
CMF (Chaikin Money Flow)
CO (Chaikin Oscillator)
EOM (Ease of Movement)
MACD (Moving Average Convergence Divergence)
MACD histogram
MFI (Money Flow Index)
MOM (Momentum)
OBV (On-Balance Volume)
OBV oscillator
RSI (Relative Strength Index)
RVGI (Relative Vigor Index)
RVI (Relative Volatility Index)
Stochastic
Stochastic RSI
TSI (True Strength Index)
UO (Ultimate Oscillator)
VWMACD (Volume-Weighted MACD)
VWMACD histogram
WT (Wave Trend)
You can disable any of them in the settings. You only need one indicator source enabled for the Trend Reversal Indicator to work.
If you disable some indicators, you may need to lower the sensitivity or even use a custom one as the signals strength will probably be higher as it will be easier to match most of the indicators.
As this indicator makes a lot of computation, it takes a few seconds to load. If it's an issue for you, you may improve its performance by disabling some indicator sources.
HOW IS THE SIGNAL CALCULATED
The algorithm analyzes the last three bars (the current one and the two previous bars) and for each enabled indicator source:
Add one point for a positive divergence ;
Add one point for an oversold condition (when the indicator supports it) ;
Add one point for a strongly oversold condition (cumulated with the oversold point) ;
Remove one point for a negative divergence ;
Remove one point for an overbought condition ;
Remove one point for a strongly overbought condition (cumulated with the overbought point).
It then normalizes the signal from -100 to 100, where -100 is the minimum theoretical score and 100 is the maximum theoretical one.
The algorithm detects up to 100 bars long divergences.
SETTINGS
SIGNAL SENSITIVITY
You can set the indicator sensitivity to one of five levels.
Very low (60):
Low (55):
Medium (50): (this is the default value)
High (45):
Very high (40):
You can also set a custom sensitivity by choosing "Custom" and filling the "Custom sensitivity" field.
SIGNAL APPARENCE
Show signal strength: replace the "Bear" and "Bull" label with the signal strength.
Show indicator names: add the indicator names to the label to know exactly what got detected.
OB is for "overbought", OS is for "oversold", OB+ is for "strongly overbought" and OS+ for "strongly oversold".
DIVERGENCES
Show divergences: add all the detected divergences to the graph. The more divergences are in the same zone, the brighter the colors are. Please note TradingView limits to 500 the number of lines you can display at anytime, so divergences will only be shown for the most recent bars.
BACKGROUNDS
You can show signal, divergence, overbought and oversold strength as a background color.
Show signal background:
Show divergence background:
The more divergences are detected in the same bar, the brighter the color is.
Please note the divergence background only shows confirmed divergences. It requires two bars for a divergence to be confirmed.
Show overbought and oversold background:
The more overbought and oversold conditions are detected in the same bar, the brighter the color is.
You can also combined all of the backgrounds for even more eye pain.
ALERTS
This indicator offers multiple alerts.
New trend reversal signal: a new trend reversal signal has been detected. Bar is not yet closed, signal may still be invalidated and disappear. It's the earliest alert you can get but you'll also get many false positives.
New bearish trend reversal signal: identical, but with bearish signals only.
New bullish trend reversal signal: identical, but with bullish signals only.
Confirmed trend reversal signal: a trend reversal signal has been confirmed. The signal bar is closed but the signal may still be invalidated by the current bar. You'll get far less false positives.
Confirmed bearish trend reversal signal: identical, but with bearish signals only.
Confirmed bullish trend reversal signal: identical, but with bullish signals only.
Final trend reversal signal: a trend reversal signal has been confirmed and is now final. The signal bar and the following one are closed. The signal can't change anymore but it will likely be too late to act on some signals, especially bearish ones. Crashes can be brutal whereas bullish trend reversals usually take more time to unfold.
Final bearish trend reversal signal: identical, but with bearish signals only.
Final bullish trend reversal signal: identical, but with bullish signals only.
I hope you'll enjoy this indicator and I hope it will be as useful to you as it is to me.
Feel free to comment if you experience a bug or if an important feature is missing for you.
If you like this indicator, please note it has been designed to be used it with my R.S.I. with divergences indicator and my M.A.C.D. with divergences indicator .

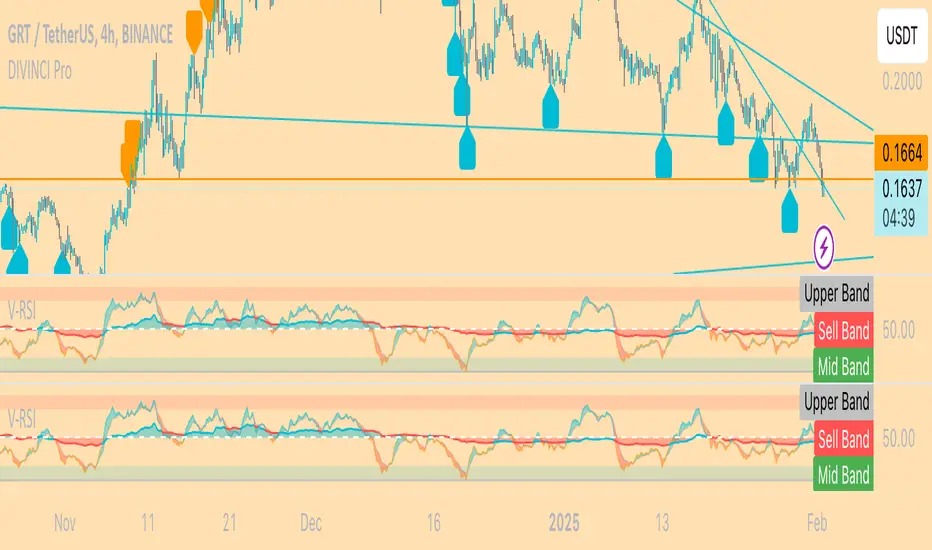
Anchored OBV RSI: "V-RSI" About the Indicator:
V-RSI uses values from the traditional "Relative Strength Index(RSI)" oscillator and the "On Balance Volume(OBV)" indicator and anchors them into an oscillator format. In doing so, we are given a more concrete overview of volume/sentiment data relative to the RSI for analysis of trend strength and decision making.
EXTRAS: BTC MODE => for BTC only.
In BTC MODE, the indicator uses BTC volume data from the following 5 major exchanges: BINANCE, COINBASE, FTX, BITMEX, BITFINEX.
The sum of this data is taken to depict anchored OBV values. This allows for a more accurate representation of Global Volume.
How to use it
The indicator can be used like the normal RSI with the OBV (area in the middle) showing volume sentiment.
<50 is seen as bearish
>50 is seen as bullish
Using this data, it becomes easier to identify unsustainable trends, reversals, divergences
An example of an unsustainable trend and reversal would be if RSI values are overbought ( RSI > 70) yet OBV oscillator remains below 50.
== chances of unsustainable trend reversal are more likely.
For more questions, send me a message here on Tradingview.
Happy trading,
MM :)
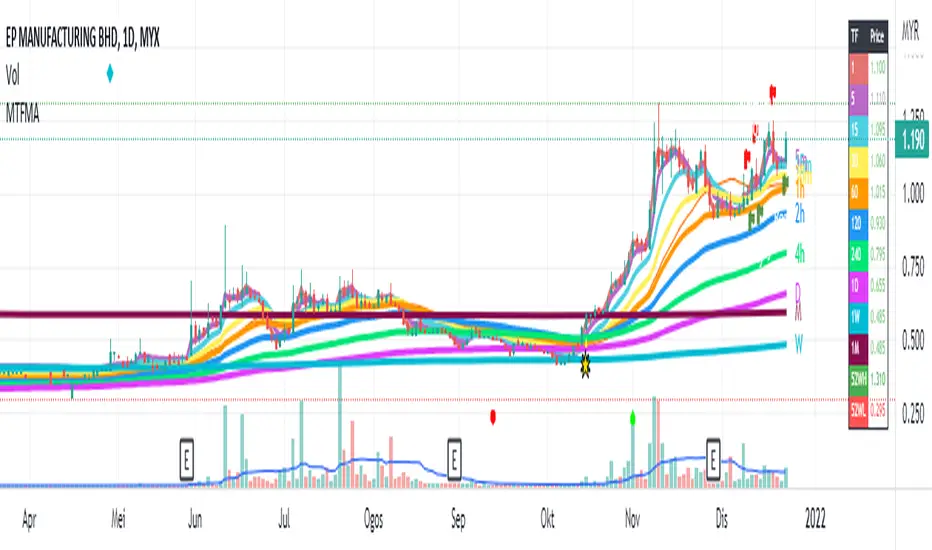
Multiple Timeframe (Moving Average) With InfoThis indicator combine 4 indicator in one pine script : Main indicator is Moving Average in multiple timeframes, Bollinger Band, Crossover Signal, Info Panel, 52Weeks High & 52 Weeks Low.
1)
For multiple moving average, it has 9 difference timeframes.
- Default timeframes is (1minute, 5minutes, 15minutes, 30minutes, 1hour, 4hours, 1Day, 1Week & 1Month). User also have choices to change the option.
- For Moving Average, there also available multiple choice of Moving Average : SMA , EMA , DEMA , VWMA , RMA, WMA . Default Moving Average is EMA (200)
- There also include info panel / table that show TF (Timeframes) for every MAs, & their price. Colors change according to current price. Bullish = Green, Neutral = Neutral, Bearish = Red
There are also function for user to turn on/off :
- (MA) Type & Lenght.
- Multiple MAs.
- Info / Table
User can use multiple line in daily chart to find support & resistance .
Example : For uptrend stock, candle close on top of EMA200 line for 1 hour timeframe. So it's can becomes immediate support, while the other EMAs on below is their next support.
Example :
For downtrend stock, candle close on top of EMA200 line for 5minutes timeframe. So it's become support, while the other EMAs on top is their resistance.
Example :
This Multiple MAs Inspired by xdecow :
www.tradingview.com
Checkout his Multi Timeframe Moving Average here :
2)
This indicator also have Bollingger Band. User have option to turn it on / off. User can use it as a target price if all the EMAs below the candle.
Example :
3)
This indicator also shown 52 Weeks High & 52 Weeks Low. User have option to turn it on / off. Their price also shown at the info panel.
Example :
4)
Crossover Signal. This crossover is default, it happen when candle close on top / near timeframe 5Minutes is (Ready). While candle close below timeframe 5Minutes is (Caution). User can choice other shape if they don't want the text label. To change the crossover for other setup, user can change it under = #2. The crossover only shown in past 10 candle.
Example :
Feel free to use it & comment. Thanks.
Keltner Channels BandsKeltner Channel Bands
Great indicator for mean reversion strategies.
Alerts you can set:
Crossover EMA
Crossunder EMA
Crossover upper band
Crossunder upper band
Crossover lower band
Crossunder lower band
Have fun!

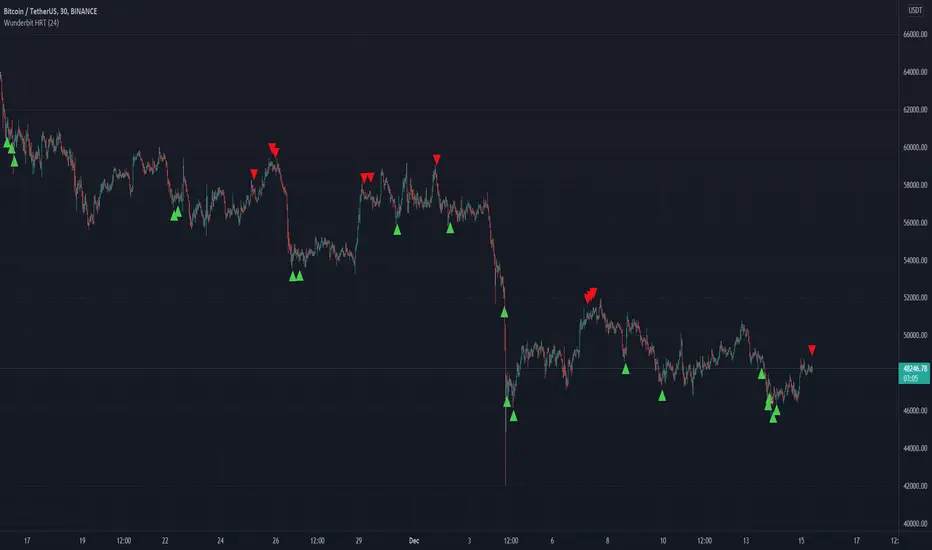
Wunderbit HRT BotWunderbit HRT is a proprietary indicator designed to find pivot points in the cryptocurrency market.
Working timeframes from 30 minutes and above.
The indicator is designed to create automated trading strategies using a webhook.
To create a cryptocurrency robot for this indicator, you need:
1. Create alerts and bind the URL to the webhook.
2. Link the Tradingview indicator to automation services.
For signals, alerts are used: LONG and SHORT
Recommendations for the indicator:
1. Use DSA technology for automation.
2. Be sure to disable the "multiple inputs" function.
3. Use an indicator with oscillators or MACD to confirm the entry point.
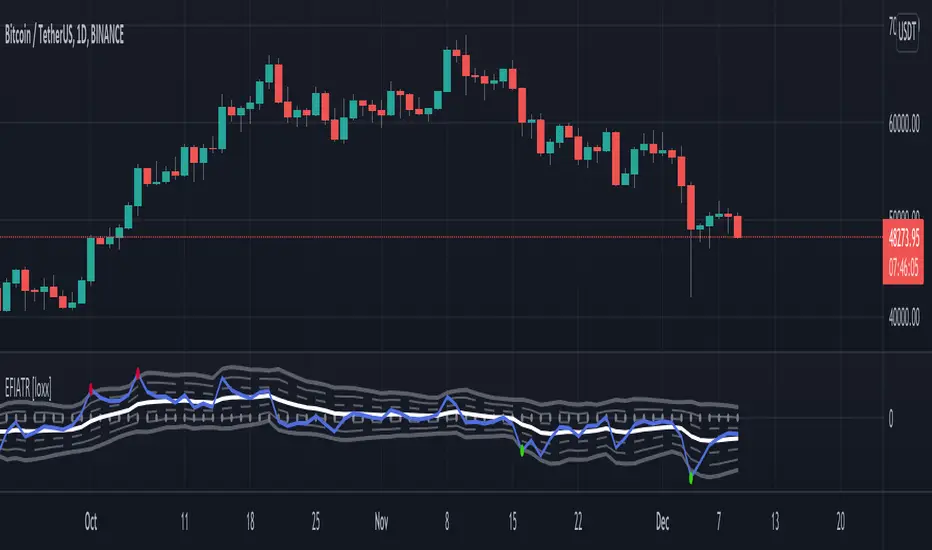
Elder Force Index With ATR Channels [loxx]Elder Force Index With ATR Channels, adaptive from original script by Dr. Alexander Elder
What it does
-EFI is used to sport reversals mainly on the weekly time frame
-When EFI spikes over 3 x ATR calculated on the signal line, price is said to have exhausted and you can start looking for reversals
Features
-Change all inputs
-Truncate EFI at 4 x ATR so as to not squish the indicator
-Open source, use code as you wish. If you use this code, shoot me a line and tell me how you're using it
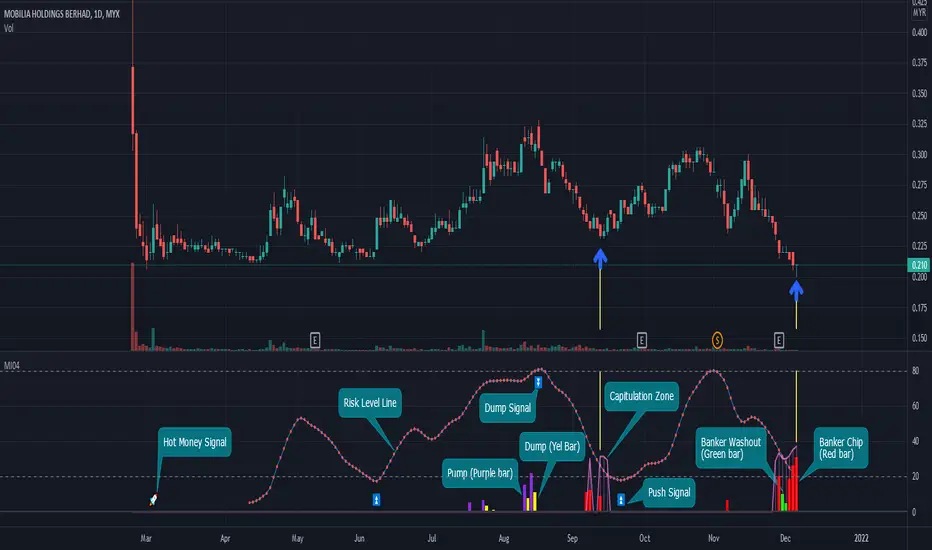
Banker Chip Pro (MI04)The Banker Chip Pro (MI04) indicator is used to track the activity of the banker collecting shares in the stage when price unexpectedly drops drastically,
and also pump & dump action with strong pull-up in stock price.
Therefore, traders need to remain cautions while using this indicator in the trendless market to avoid losing thier capital.
Banker Chip (Red bar) represents the banker's start engaging in the collection phase, while the Banker Washout (Green bar) represents the banker's washout to accumulate more chips.
Thus, if a Red bar is found near the end of a stock's decline, there is a high probability will form a wave of a rebound.
The last bar method is what it's called.
The Pump (Purple bar) represents the banker boosting up the stock price to attract regular investors.
The Dump (Yellow bar) represents regular investors committed to the stock, which is banker profit-taking activity (dump) that may result the price to collapse later.
The Capitulation Zone is when investors give up the stock by selling all the positions during periods of decline. It is a hint of bottom in pricing and consequently a good opportunity to observe whether can form a mark up phase (higher pivot highs and higher pivot lows)
The Risk Level Line (RLL) represents the risk level zone from horizontal 0 to 100. When the RLL rises beyond 80, it is considered a risk zone, may lead to a downward move.
Thus, investors who intend to enter the market at the bottom might use 20 as a safety zone and pay attention to the stock's trend in the future.
Banker Chip Pro features a total of 3 signals which are ⏫️ push signal and 🚀 hot money signal for bottom strategy and ⏬️ dump signal for an exit strategy.
This is referred to as signal method.
AJ Scalp Reversal Tops and Bottoms IndicatorReuploaded after TV took it down.
A free scalping reversal, top and bottom indicator. It prints signals in real time, and should be used for scalping.
Following candle will usually always follow the signal but from there closer management is required.
This script uses RSI, Volume, OBV, Pivots and a few more indicators to calculate the signals.
Use alongside other indicators and price action analysis for best results.
Only use on time frames above 1H, otherwise the signals fire too frequently.
*These signals are different compared to other scripts created by me

Combo Backtest 123 Reversal & TEMA1This is combo strategies for get a cumulative signal.
First strategy
This System was created from the Book "How I Tripled My Money In The
Futures Market" by Ulf Jensen, Page 183. This is reverse type of strategies.
The strategy buys at market, if close price is higher than the previous close
during 2 days and the meaning of 9-days Stochastic Slow Oscillator is lower than 50.
The strategy sells at market, if close price is lower than the previous close price
during 2 days and the meaning of 9-days Stochastic Fast Oscillator is higher than 50.
Second strategy
This study plots the TEMA1 indicator. TEMA1 ia s triple MA (Moving Average),
and is calculated as 3*MA - (3*MA(MA)) + (MA(MA(MA)))
WARNING:
- For purpose educate only
- This script to change bars colors.
AG FX - Pivot PointsPivot Points High Low
Definition
The Pivot Points High Low indicator is used to determine and anticipate potential changes in market price and reversals. The Highs referred to in the title are created based on the number of bars that exhibit lower highs on either side of a Pivot Point High, whereas the Lows are created based on the number of bars that exhibit higher lows on either side of a Pivot Point Low.
Calculations
As mentioned above, Pivot Point Highs are calculated by the number of bars with lower highs on either side of a Pivot Point High calculation. Similarly, Pivot Point Lows are calculated by the number of bars with higher lows on either side of a Pivot Point Low calculation.
Takeaways and what to look for
A Pivot Point is more significant or noteworthy if the trend is extended or longer than average. This can mean if a trader selects a higher period for before and after the Pivot Point, the trend could be longer and therefore prove the Pivot Point itself more notable.
Additionally, Pivot Points can help a trader assess where would be best to draw. By analyzing price changes and reversals, a trader has more of an ability to determine and predict price patterns and general price trends.
Summary
The Pivot Points High Low indicator can predict and determine price changes and potential reversals in the market. Pivot Points can also help traders identify price patterns and trends, depending on the period and significance of the Pivot Point value.

Fear Of Missing Out grid of forex tradingAbstract
This script finds potential safe grids placing limit orders without fear of missing out.
This script computes grids according to power of 1.0025 .
You can reference those price levels for your trading.
Introduction
Grid trading is a popular trading method.
Traders plan several price levels as grids and repeat buying at lower grids and selling at higher grids.
Grids can be round number like multiple of 100 pips.
Grids can also be support and resistance according to price history.
Some traders may think they need to adjust grids to trade.
However, there are several problems in choosing grids.
One problem is rate of change is related and therefore exponential. 20 to 30 is different from 30 to 40.
Another interesting point is there are some special impressing reversal price levels.
Several months ago, I had a question why usdjpy bounced near 108.3 .
After using a calculator, I found that 108.3 = 100 * 1.083 ≒ 100 * pow(1.0025,31) .
1.0025 , as known as 0.25% of change, is a potential stop out zone.
Therefore, we can compute grids and one grid is a little more than 1.0025 times than an another one.
After we finished computing grids, we can consider buy and sell near those grids.
Note that different traders may obtain different grid values.
For example, from 1.0 to 2.0 , it can be splited as 270 grids or 277 grids because pow(1.0025,277)<2 .
Those grids cannot always imply potential reversal points but they can be useful for traders looking for 0.25% profit targets with reducing fearing of buying or selling too early.
Computing grids
This script split from 1.0 to 10.0 into three segments.
One is 1.0 to 2.0 .
The second segment is from 2.0 to 5.0 .
The third segment is from 5.0 to 10.0 .
This script does the same thing for 0.1 to 1.0 , 10.0 to 100.0 , and so on.
For 1.0 to 2.0 and 5.0 to 10.0 , this script split a segment as 270 grids.
For 2.0 to 5.0 , this script split a segment as 360 grids.
The last step is display the next grids to the daily low and daily high.
Maybe also display the grids behind grids shown.
Parameters
x1,x2,x3,x4 : display the next x1,x2,x3,x4 grids to daily high and daily low. 1 means the next grid to daily high and daily low. 2 means the next grid to 1.
x_seg : default 2.0 . This script split from 1.0 to 10.0 into three segments. One is 1.0 to x_seg. The second segment is from x_seg to 10.0/x_seg . The third segment is from 10.0/x_seg to 10.0 .
x_grid1 : how many grids in the first segment
x_grid2 : how many grids in the second segment
x_lowprice : add this number for bigger grid distance. Generally, you don't need this number when trading forex but you may need it in stock trading. For stocks with price between 50 to 100, I recommend you use x_lowprice=100.
Conclusion and suggestions
This script can find potential grids for trading.
If price touches grids usually, we can consider buy and sell after price touches grids.
If price reverses before touching grids usually, we may consider buy and sell before price touches grids.
Those grids can remind us don't buy too much unless the price touches the next grid.
For instruments with less volatility, maybe we need more grids.
For traders with more money, they may also consider more grids for more dedicated range trading to collect more profit.
Reference
Sorry, I forgot them.

EneX SignalEneX is signal that give recommendation signals for entry and exit on spot market. This indicators not suitable for leverage trading in futures market.
EneX signal consider several indicators and has entry and exit rules.
EneX signal is suitable for investors who believe in trend following strategy (disclaimer on).
This script composed by Yohan Naftali for educational purpose only. Reader who will use this signal must do own research.
Indicator and Plot Involved
1. Williams Fractals with default periods = 2
2. William Alligator Indicators with default simple moving average 8, 13, and 21
3. Exponential Moving Averages with default value EMA 50, 100, and 200
4. Relative Strength Index with default overbought level = 80 and oversold level = 20
5. Williams Fractals are joined to create support and resistance line and fill area between support and resistance lines.
Entry signal conditions
1. Entry on Weakness when bullish fractal appear on n/2 period
2. Entry when price break resistance line
All entry condition must above EMA and alligator signal and not in overbought RSI
Exit signal conditions
1. Lowest price is below Exponential Moving Average
2. Lowest price is below William alligator lines
You can easily find entry and exit points by using Entry (E), Exit(X) signals
How to use
1. Monitor chart and wait until E or X signals
2. Entry if Entry Signal (E) appear (green colored label)
3. Exit if Exit Signal (X) appear (red colored label)
4. Change indicators setting when necessary
Best Practice
1. Entry only when entry signal (E) appear
2. Never entry when price below William alligator signal
3. Exit when exit signal (X) appear
4. Not exit when exit signal appear when you believe or you have information that price will be rebound
5. Exit if you believe that current price meet your target price
6. Always wise when use EneX signals
Disclaimer
Do your own research and consider fundamental price of asset.
The indicators provided on this script is for educational purposes only.
Author does not offer advisory or brokerage services, nor does it recommend or advise users to buy or sell particular stocks or securities.
Please examined script and give feedback for further improvement.

M.Right Bulls-V-Bears -Tug-of-War- SquidGame Themed(cc)Hello Traders,
I've decided to finally release an indicator I've spent several hours working to get just right and as far as I know, there isn’t one as accurate. And.... decided to add a little Squid Game theme to it just for fun.
……"The game is Tug of War, the side that pulls the rope from the middle to their side wins. Let the game begin."……
This indicator is not a typical one.
1) It shows visually when Bull volume or Bear volume is ‘pulling the rope to their side’.
2) It uses several different formulas to get an accurate read on the level of volume, but still keeps peaks and troughs within 100 for easy reading.
3) Update: It was originally meant to be used strictly with other indicators, but it can now be used as a standalone indicator.
Legend:
1) The top line signals give the major signals –
a. Red cross = Bearish volume strength and continuation.
b. Green cross = Bullish volume strength and continuation.
i. + Green Dot inside enhances signal.
ii. + Red Dot inside weakens signal.
c. Blue circle = Can indicate the beginning of a reversal to the upside or downside.
d. Pink circle = Can indicate the beginning of a reversal to the downside.
2) The Bottom signals are triggered when one circle-rope crosses over the other, these signals give confirmation to the top line signals – Red bearish / Green bullish.
3) As shown on the chart, the Reversal setup usually consists of a blue circle, followed by a red or green cross, then confirmation from the bottom signal.
4) Without the signals: green obviously is Bullish especially above the threshold set --Red bearish. The regular rope gives trend indication.
I've added tooltips to make it easy to understand, feel free to leave a comment if you still have a question!
Features:
-Tooltips (hover over - Info) for understanding.
-Works well on all timeframes; even 5min, I made a tooltip for recommended lengths.
-Customizable Signals; with the ability to turn on and off.
-Reversal signals: Pink and Blue circles can indicate reversals coming.
-Works well as a leading standalone indicator.
-Adjustable top signal row.
-Highlight background.
-Alerts
-Rules added (hover over).
Cheers,
Mike
