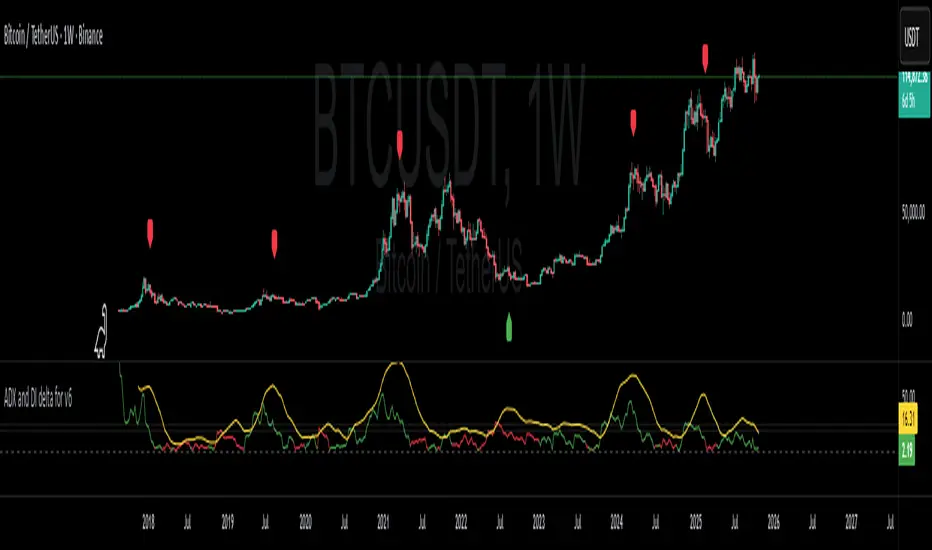
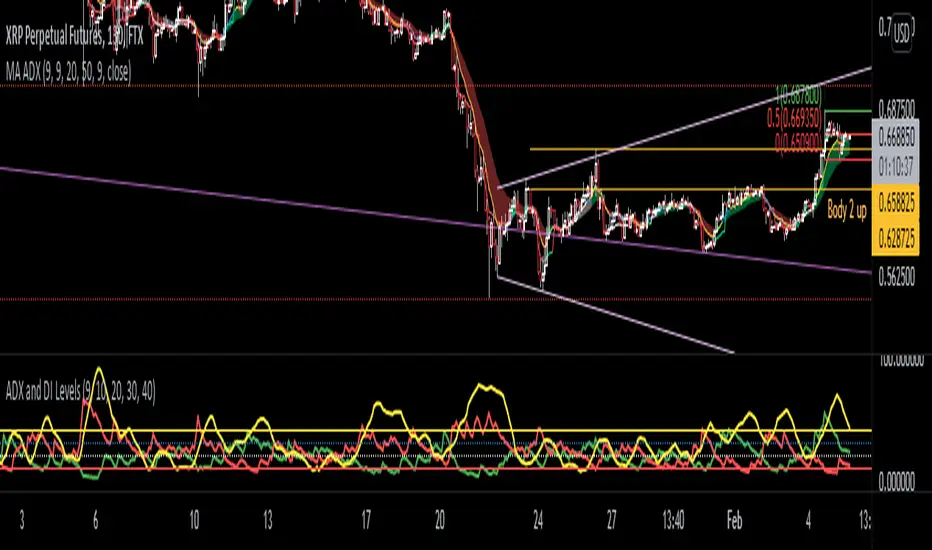
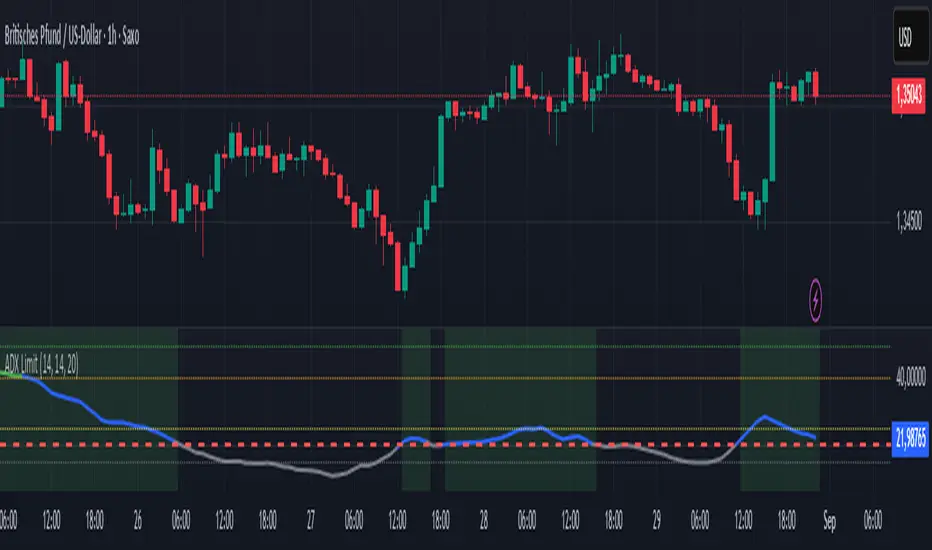
ADX and DI deltaJust a small adjustment to a well known indicator, the ADX with +DI and -DI.
I've always been annoyed of how cluttered this indicator is, specially do to the increasing gap between +DI and -DI, so I changed it up a bit.
ADX line has not been adjusted
+DI and -DI have now merged into deltaDI
deltaDI changes color depending on which value is higher (+DI > -DI = green line, else red line)
Plots a dashed 0 line (not editable)
Plots a two dotted lines at value 20 and 25 (editable)
Plots a label above/below price on the chart if the trend is exhausted and might end. (can be disabled)
Now you only have the ADX line together with a delta line.
The delta line is the gap between +DI and -DI and will change color depending on which one is highest and controlling the trend.
+DI = green line
-DI = red line
I've also added both a 20 and 25 horizontal dotted line.
Normally ADX should be 25 or higher to start a trend, but I do know a lot of people like to be greedy and jump in early in the trend build-up.
A dashed 0 line has been added, just because I felt like it. If either the ADX or delta ever cross below it without you editing the script yourself, just delete the script as it clearly doesn't do its job.
A red label_down will be plotted above the price when the ADX starts curling down and +DI > -DI. This indicates at best a breather for a bullish up trend or a possible reversal.
A red label_down will be plotted above the price if the ADX is above 25 and starts curling down while +DI > -DI. This indicates at best a breather for a bullish up trend or a possible reversal.
A green label_up will be plotted below the price if the ADX is above 25 and starts curling down while -DI > +DI. This indicates at best a breather for a bearish down trend or a possible reversal.
Enjoy my take on the indicator.
在脚本中搜索"adx"
ADX Breakout Strategy█ OVERVIEW
The ADX Breakout strategy leverages the Average Directional Index (ADX) to identify and execute breakout trades within specified trading sessions. Designed for the NQ and ES 30-minute charts, this strategy aims to capture significant price movements while managing risk through predefined stop losses and trade limits.
This strategy was taken from a strategy that was posted on YouTube. I would link the video, but I believe is is "against house rules".
█ CONCEPTS
The strategy is built upon the following key concepts:
ADX Indicator: Utilizes the ADX to gauge the strength of a trend. Trades are initiated when the ADX value is below a certain threshold, indicating potential for trend development.
Trade Session Management: Limits trading to specific hours to align with optimal market activity periods.
Risk Management: Implements a fixed dollar stop loss and restricts the number of trades per session to control exposure.
█ FEATURES
Customizable Stop Loss: Set your preferred stop loss amount to manage risk effectively.
Trade Session Configuration: Define the trading hours to focus on the most active market periods.
Entry Conditions: Enter long positions when the price breaks above the highest close in the lookback window and the ADX indicates potential trend strength.
Trade Limits: Restrict the number of trades per session to maintain disciplined trading.
Automated Exit: Automatically closes all positions at the end of the trading session to avoid overnight risk.
█ HOW TO USE
Configure Inputs :
Stop Loss ($): Set the maximum loss per trade.
Trade Session: Define the active trading hours.
Highest Lookback Window: Specify the number of bars to consider for the highest close.
Apply the Strategy :
Add the ADX Breakout strategy to your chart on TradingView.
Ensure you are using a 30-minute timeframe for optimal performance.
█ LIMITATIONS
Market Conditions: The strategy is optimized for trending markets and may underperform in sideways or highly volatile conditions.
Timeframe Specific: Designed specifically for 30-minute charts; performance may vary on different timeframes.
Single Asset Focus: Primarily tested on NQ and ES instruments; effectiveness on other symbols is not guaranteed.
█ DISCLAIMER
This ADX Breakout strategy is provided for educational and informational purposes only. It is not financial advice and should not be construed as such. Trading involves significant risk, and you may incur substantial losses. Always perform your own analysis and consider your financial situation before using this or any other trading strategy. The source material for this strategy is publicly available in the comments at the beginning of the code script. This strategy has been published openly for anyone to review and verify its methodology and performance.

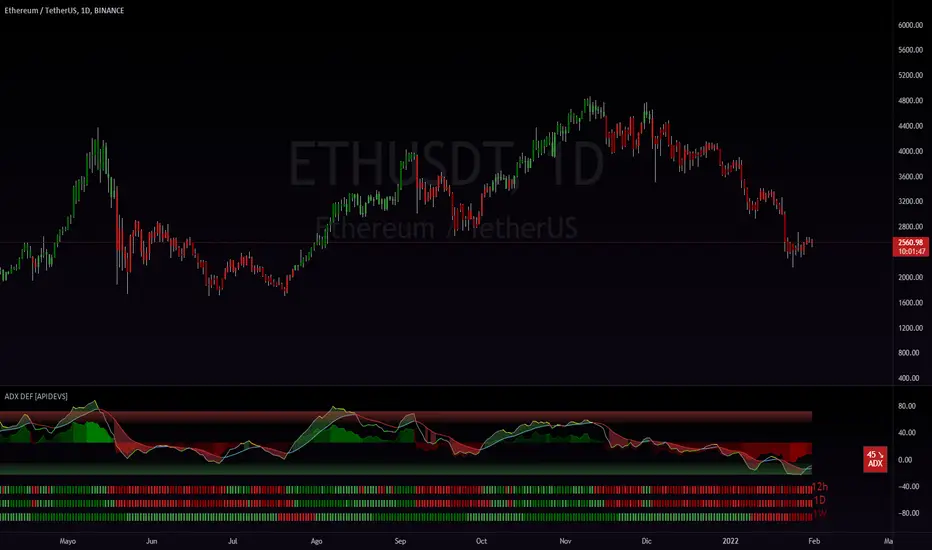
ADX DEF [APIDEVS]------------------------------------ ENGLISH -------------------------------------------------
In this version of the ADX we integrate several additional features to optimize its operation, for its construction we use the DI+ and DI- indicators and transform them into a histogram, this to mark the intensity of the steering force. We also incorporate another strength indicator called True Strengh Index or in Spanish real strength index (TSI) is a momentum oscillator that is used to identify trends and reversals. The indicator can be useful in determining overbought and oversold conditions, indicating possible trend direction changes via center line or signal line crossovers, and warning of trend weakness via divergence
With this incorporation we replace the traditional ADX with a new directional strength indicator which, in addition to marking the strength, allows to establish the reversal points, adding the possibility of showing divergences and observing the weakness of the movement in advance.
We also incorporate our ADX Multi Time-frames which we place at the bottom of the indicator to show the strength of the market in a multi-time frame. finally we add an informative panel where the value of the ADX is shown.
------------------------------------ ESPAÑOL -------------------------------------------------
En esta versión del ADX integramos varias características adicionales para optimizar su funcionamiento, para su construcción utilizamos los indicadores DI+ y DI- y los transformamos en histograma, esto para marcar la intensidad de la fuerza de la dirección. También incorporamos otro indicador de fuerza llamado True Strengh Index o en español índice de fuerza real (TSI) es un oscilador de impulso que se utiliza para identificar tendencias y reversiones. El indicador puede ser útil para determinar las condiciones de sobrecompra y sobreventa , indicando los posibles cambios de dirección de la tendencia a través de cruces de la línea central o de la línea de señal, y advirtiendo de la debilidad de la tendencia a través de la divergencia
Con esta incorporación remplazamos el tradicional ADX por un nuevo indicador de fuerza direccional el cual además de marcar la fuerza permite establecer los puntos de reversión, agregando la posibilidad de mostrar divergencias y observar la debilidad del movimiento con anticipación.
También incorporamos nuestro ADX Multi Time-frames el cual colocamos en la parte baja del indicador para mostrar la fuerza del mercado de modo multitemporal. finalmente añadimos un panel informativo donde se muestra el valor del ADX .
ADX with Color like MACD HistogramThis is a usual ADX Indicator but the colors change when the next bar falls or grows from the previous bar.
I think that the use of ADX can be maximized by seeing whether the movement is lower or higher than the previous like MACD Histogram.
The ADX indicator is very powerful for driving long-term trends and is effectively used for 4-hour or 1-hour Time Frames.
When ADX is above level 20, the color of the Bar will be blue or light blue. The blue bar means that the bar is higher than the previous bar. The light blue bar means the bar is lower than the previous one.
When ADX is below level 20, the color of the bar will be dark gray or light gray. The dark gray bar means that the bar is lower than the previous bar. The light gray bar means the bar is higher than the previous bar.
When the bar turns blue that's when we can add shares to our winning position.
When the price is above level 40, the background of the bars will be red, indicating that the price is in a very strong trend and will run out of its thrust soon. That's when we get ready to take profit, which is when the ADX Bar which is blue turns light blue.
-
FYI, I use ADX just for adding the shares to my winning position and exiting the market. I don't wait for ADX turns blue to enter the market.

ADX histogram with SMAThis indicator shows a histogram of the ADX with the following colors:
Background gray => ADX under configured lower level which means no trend is present
Background dark orange => ADX between lower and upper level and down trend is present
Background orange => ADX between over upper level and down trend is overheated
Background dark green => ADX between lower and upper level and up trend is present
Background lime => ADX between over upper level and up trend is overheated
Additionally i have added a SMA of the ADX. The crossings of both are shown with a background color:
yellow => ADX crossed SMA line upward which is the case with rising trend
fuchsia => ADX crossed SMA line downward which is the case with falling trend
The indicator is optimated for small browser windows or multiple chart layouts where you have not much space left for your indicators but you also want to read the indicator signals.
For access please leave a comment.
Please provide feedback.
ADX CandleCandles colors based on ADX and DI strength.
How to read:
ADX is less then 20 (adjustable value) is SILVER (no trend)
ADX >0 and DI delta (DI plus - DI minus) is >0 color LIME (trend up)
ADX>0 and DI delta <0 color RED (trend down)
ADX cross ADX Index ( adx+adx 14 period back)/2 color is BLACK and means start/end trend

ADX Z-Score OscillatorTitle: ADX Z-Score Oscillator
Description:
The ADX Z-Score Oscillator is a normalized version of the traditional Average Directional Index (ADX), designed to oscillate between fixed bounds for easier interpretation of trend strength. Instead of plotting the raw ADX line, this indicator calculates the Z-Score of the ADX relative to its recent average and standard deviation, allowing for consistent comparison over time and across different assets.
The Z-Score oscillates between fixed horizontal levels of +2 and -2, highlighting extreme values.
The orange line represents the current Z-Score of the ADX.
Horizontal reference lines at +2 (red), 0 (gray), and -2 (green) help define overbought/oversold or strong/weak trend zones.
A dynamic table on the chart shows the current Z-Score with color coding to indicate trend strength:
🔴 Z > 1.5 → Very strong trend
🟠 Z > 0.5 → Moderate trend
🔵 Z < -0.5 → Weakening or reversing trend
🟢 Z < -1.5 → Very weak trend or potential reversal zone
This transformation of the ADX into a bounded oscillator helps traders easily assess trend strength and changes in momentum without the ambiguity of varying ADX scale levels.

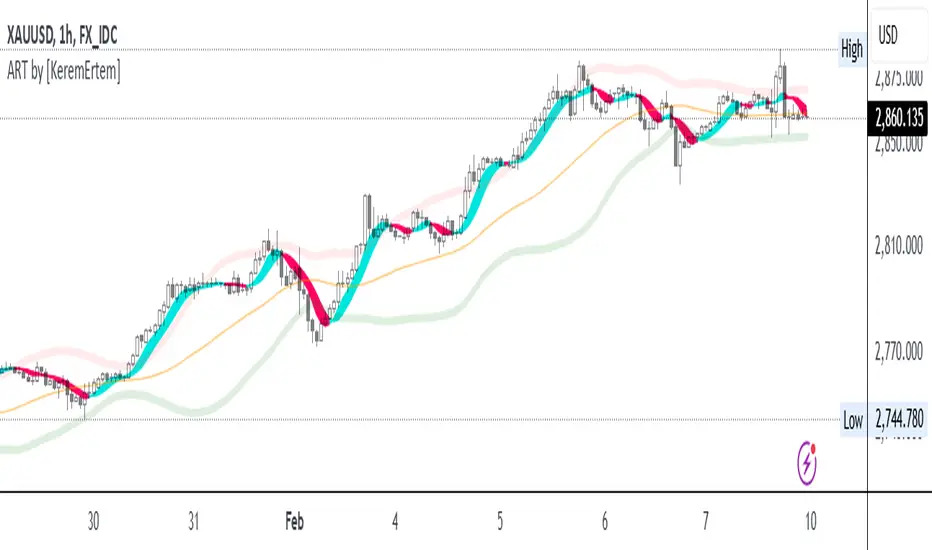
ADX, RSI, & TSI utilized as ART [by KeremErtem]The "ADX, RSI, & TSI utilized as ART" script is an advanced technical analysis tool designed by Kerem Ertem to help traders identify trend direction, strength, and potential reversals. It integrates the Average Directional Index (ADX), Relative Strength Index (RSI), and True Strength Index (TSI) into a cohesive, user-friendly indicator known as ART (Adaptive Relative Trend) .
What it does:
Trend Detection: Utilizes ADX to identify the strength and direction of trends.
Momentum Analysis: Uses RSI to gauge the speed and change of price movements.
Signal Smoothing: Incorporates TSI to reduce noise and provide clearer signals.
How it works:
Input Settings: Customize the source (hlc3), signal period (l1), and lookback range (l2) to tailor the indicator to your trading strategy.
Angle Calculation (ACI): The script calculates the angle of price movements using a custom function, which combines the lowest and highest prices with moving averages to create a smoother representation of trend angles.
Weighted Average: The ACI function is applied to the source price to derive a weighted average, which serves as the foundation for further calculations.
RSI Integration: The script calculates the RSI based on the weighted average price and further refines it using the ACI function to enhance signal accuracy.
ADX Calculation: ADX values are computed and adjusted using the ACI function to provide a clearer indication of trend strength and direction.
ART Indicator: The combined results of the RSI and ADX calculations form the ART indicator, which is plotted alongside trend lines and bands for comprehensive trend analysis.
Bands and Trend Lines: The script plots upper, lower, and center bands based on standard deviation and moving averages, providing visual cues for potential support and resistance levels.
How to use it:
Customization: Adjust the signal period, lookback range, RSI length, and ADX settings to fit your trading preferences.
Interpretation: Green ART signal lines indicate bullish trends, while red lines indicate bearish trends. The trend line color changes from cyan to magenta based on the trend direction.
Bands: Use the upper and lower bands as potential entry and exit points, with the center line acting as a trend confirmation.
This script offers a comprehensive approach to trend and momentum analysis, making it a valuable tool for traders seeking to enhance their trading strategies with advanced technical indicators.
ADX DI EMA Clouds
EMA clouds colored by DI and ADX indicator:
9 EMA and 21 EMA Cloud turns green in a bull trend and red when in a bull trend...if the trend is half bulll and half bear..the clouds turn white.
I also coded if the momentum in increasing (yellow) or if the momentum is decreasing (blue) or if the momentum is flat (white).
The Clouds are colored based off the Di (+/-)
9 EMA is colored based of ADX momentum strength
ADX:
ADX is used to quantify trend strength. ADX calculations are based on a moving average of price range expansion over a given period of time. The default setting is 14 bars, although other time periods can be used.1
ADX can be used on any trading vehicle such as stocks, mutual funds, exchange-traded funds and futures .
DI (+/-):
The directional movement index (DMI) is an indicator developed by J. Welles Wilder in 1978 that identifies in which direction the price of an asset is moving. The indicator does this by comparing prior highs and lows and drawing two lines: a positive directional movement line ( +DI ) and a negative directional movement line ( -DI ). An optional third line, called the average directional index ( ADX ), can also be used to gauge the strength of the uptrend or downtrend.
This indicator has the length changed from 14 to 9 so you can have more updated price calculation
I also add the 4 levels I use for day trading; the 10, 20, 30, 40-50 are the levels I like to see the Di to break over.
A lot of traders use different levels, but these I have and found most useful. You can set alerts when any Di crosses over the 40 for true trend breakout!
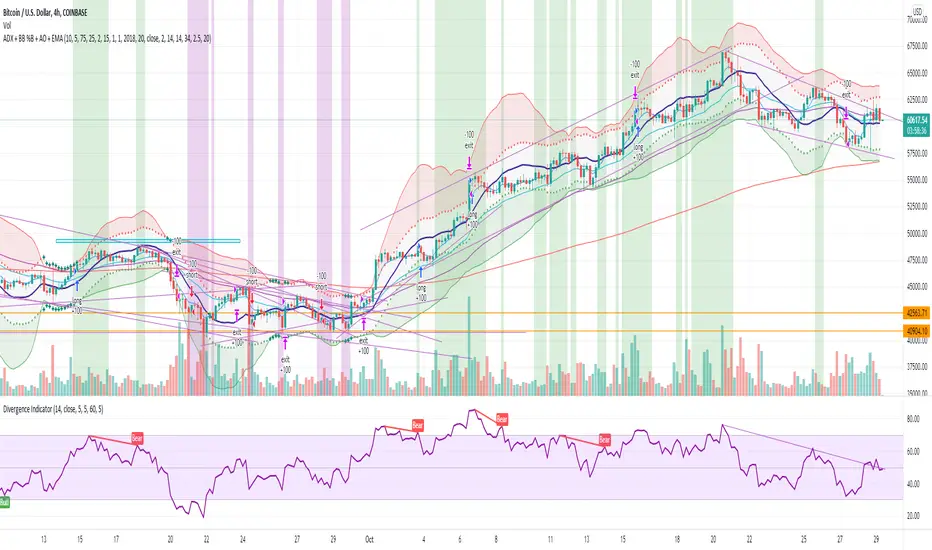
ADX + BB %B + AO + EMA [Luca Massuda]This trading strategy combines different indicators:
1) ADX, Average Directional Movement: to spot the trend
2) BB %B Bollinger Band %B: to spost relative price position to Bollinger Bands
3) AO Awesome Oscillator: to spot momentum
4) ema 5,ema21, ema50, ema200: to decide long or short position
You can configure:
Take profit % : at which % gains to take profit from the entry price
Stop loss % : at which % stop loss from the entry price
BB %B Overbought: At which level you consider Overbought respect to Bollinger Bands (values 0 to 100)
BB %B Oversold: At which level you consider Oversold respect to Bollinger Bands (values 0 to 100)
Awesome Oscillator: AO level to consider a long or short position +/- 2
ADX: ADX value to consider a long or short position
Start Date, Month, Year: Starting point for a backtesting strategy
Lenght , Source , Standard Deviation: Bollinger Bands values
ADX smoothing, DI Lenght: ADX values
Green and purple zones indicate when the strategy can go long or short.
Default Long conditions:
ema5>ema21 and ema50>ema200 and bb>75% and ao>2 and adx>15
Default Short conditions:
ema515
ADX with 20 ThresholdI wanted an ADX with a threshold line so I created an indicator.
ADX (20 Threshold) Cheat-Sheet
Purpose: Filter trades by trend strength.
Indicator: ADX (derived from DMI) with optional +DI/−DI lines.
Key Rules:
ADX > 20: Trend is strong → trade OK
ADX < 20: Trend is weak/choppy → avoid trades
Optional +DI / −DI: Shows momentum direction
HTF Use: Stable trend confirmation
LTF Use: Optional filter with EMA slope for entries
Tips:
Combine with EMAs or MACD for directional bias.
ADX does not indicate direction, only strength.
Best used to avoid low-probability trades in sideways markets.

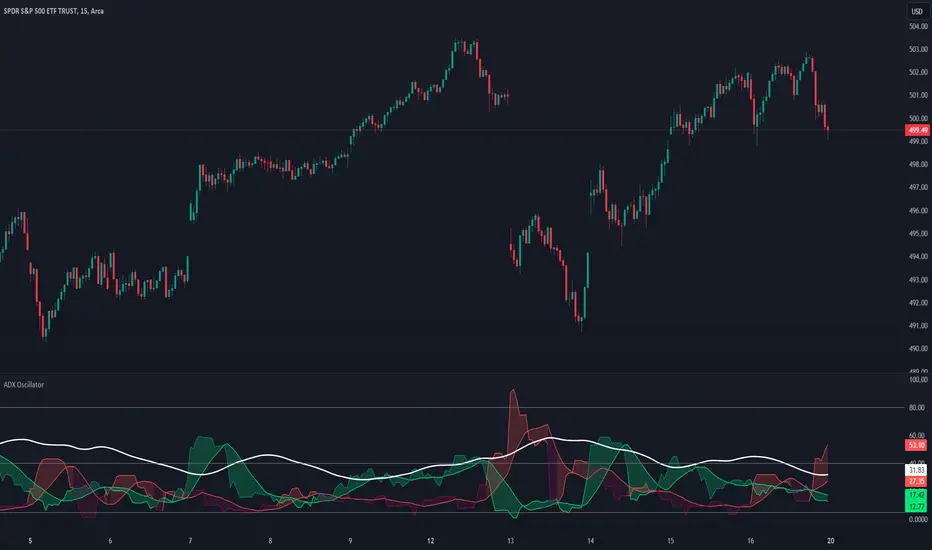
ADX Oscillator @shrilssThis Indicator calculates the Average Directional Index (ADX), a popular indicator used to quantify the strength of a trend. Additionally, it computes the Positive Directional Index (+DI) and Negative Directional Index (-DI), which measure the strength of upward and downward price movements respectively.
What sets this script apart is its enhanced ADX calculations. It incorporates Moving Averages (MAs) of the +DI and -DI to offer a smoother representation of trend direction. By averaging these directional indices over a specified period, it aims to filter out noise and provide clearer signals of trend strength.
Traders have the flexibility to visualize the traditional ADX alongside the enhanced ADX oscillator. The script also highlights potential buying and selling opportunities based on crossover events between the directional indices and the ADX, helping traders identify optimal entry and exit points.
With customizable parameters such as the length of the Directional Movement (DM), ADX, and MA periods, this script empowers traders to adapt the indicator to different market conditions and timeframes.
ADX Trend Confirmer [Honestcowboy]The ADX Trend Confirmer aims to give traders or algorithms a way to confirm a trend before entering a trade.
While the default for ADX is a smoothing factor of 14 and a length of 14 to measure directional strength. In my experience this is a lagging indicator and not the best for confirming if the market is trending.
🟢 What are the methods used for confirming trend in this indicator?
ADX above x number : By default we use an ADX length of 3 and it's value needs to be above 50.
ADX sloping up ? This will check if the ADX value is higher than that of previous bar, this to confirm that trend is getting momentum and not slowing down.
close>open / close

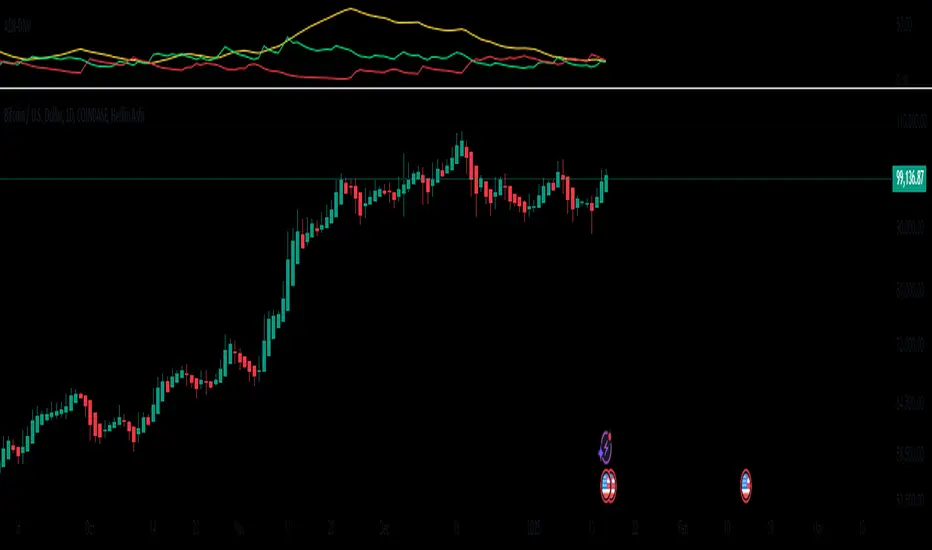
ADX Breakout Enhanced Signal🥋 Trading Dojo – ADX Breakout Enhanced Signal
This indicator combines the trend-strength power of the ADX with dynamic breakout-based signals, designed for traders who want more frequent and higher-probability entries on timeframes like 1 hour.
The core logic focuses on:
📌 1. Trend Strength Detection with ADX
The indicator evaluates whether the market is showing a strong directional trend using an optimized ADX.
When ADX rises above the configured threshold, the system interprets that price has enough momentum to validate an entry.
📌 2. Breakout Entry Logic
It identifies points where price breaks recent highs or lows, confirming the start or continuation of movement.
This breakout-based approach produces more entries than traditional ADX strategies alone.
📌 3. Clear and Simple Signals
🟩 Long when price breaks a recent high with strong trend confirmation.
🟥 Short when price breaks a recent low with strong trend confirmation.
📌 4. Built-In Automated Alerts
The indicator automatically generates JSON alerts ready for use with automation tools such as trading bots, webhooks, BingX, 3Commas, Discord bots, and more.
🎯 Purpose of the Indicator
To provide more frequent, well-distributed, and momentum-validated entries, while maintaining simplicity and speed — perfect for real-time decision-making.
Perfect For:
Intraday trading
1h, 30m, and 15m timeframes
Breakout-based strategies
Automated trading systems

ADX and DI by MiGThis Pine Script calculates and plots the ADX (Average Directional Index) and its components, DI+ and DI-, which are part of the Directional Movement Index (DMI) system. The indicator helps traders assess trend strength and direction.
len: the period used for smoothing calculations (default 14).
th: threshold line for ADX (default 20) to visually indicate weak vs. strong trends.
True Range (TR): Measures the most extreme price movement between consecutive bars.
Directional Movement Plus (DM+): Measures upward movement; non-zero only if the current high is higher than the previous high and exceeds downward movement.
Directional Movement Minus (DM-): Measures downward movement; non-zero only if the current low is lower than the previous low and exceeds upward movement.
• DIPlus and DIMinus are the smoothed Directional Indicators (percentage form).
• DX measures the relative difference between DI+ and DI- as a percentage.
• ADX is the smoothed average of DX, representing trend strength:
• ADX > threshold → strong trend
• ADX < threshold → weak or no trend

ADX BoxDescription:
The ADX Box indicator provides traders with a quick and intuitive way to monitor the current trend strength based on the Average Directional Index (ADX), calculated with a customisable period (default: 7 periods).
This compact indicator neatly displays the current ADX value rounded to one decimal place, along with a clear directional arrow:
Green upward triangle (▲): Indicates that ADX is rising above its moving average, signaling increasing trend strength.
Red downward triangle (▼): Indicates that ADX is declining below its moving average, signaling weakening trend strength.
Key Features:
Small and clean visual representation.
Dynamically updates in real-time directly on the chart.
Ideal for quick trend strength assessment without cluttering your workspace.
Recommended Usage:
Quickly identifying whether market trends are strengthening or weakening.
Enhancing decision-making for trend-following or breakout trading strategies.
Complementing other indicators such as ATR boxes for volatility measurement.
Feel free to use, share, and incorporate this indicator into your trading setups for clearer insights and more confident trading decisions!

ADX-DMIThis script manually calculates the Directional Movement Index (DMI) and the Average Directional Index (ADX) using Wilder’s smoothing technique. The DMI indicators are used to assess the strength and direction of a market trend. It includes three main lines: ADX (yellow), DI+ (green), and DI− (red). Traders use these indicators to determine whether a trend is strong and in which direction it is moving.
The process begins by defining the length parameter, which determines how many periods are considered in the calculation. It then calculates the True Range (TR), which is the greatest of three values: the difference between the current high and low, the difference between the current high and the previous close, and the difference between the current low and the previous close. This TR is used to compute the Average True Range (ATR), which smooths out price fluctuations to get a clearer picture of the market’s volatility. Next, the script calculates the +DM (positive directional movement) and -DM (negative directional movement) based on the changes in the highs and lows from one period to the next.
Finally, the script computes the DI+ and DI− values by dividing the smoothed +DM and -DM by the ATR and multiplying by 100 to express them as percentages. The DX value is calculated as the absolute difference between DI+ and DI−, normalized by the sum of both values. The ADX is then derived by smoothing the DX value over the specified length. The three indicators — ADX, DI+, and DI− — are plotted in the lower chart panel, providing traders with visual cues about the trend’s direction (DI+ and DI−) and strength (ADX).
Important Notice:
The use of technical indicators like this one does not guarantee profitable results. This indicator should not be used as a standalone analysis tool. It is essential to combine it with other forms of analysis, such as fundamental analysis, risk management strategies, and awareness of current market conditions. Always conduct thorough research.
Note: The effectiveness of any technical indicator can vary based on market conditions and individual trading styles. It's crucial to test indicators thoroughly using historical data before applying them in live trading scenarios.
Disclaimer:
Trading financial instruments involves substantial risk and may not be suitable for all investors. Past performance is not indicative of future results. This indicator is provided for informational and educational purposes only and should not be considered investment advice. Always conduct your own research before making any trading decisions.
ADX Trend + RSI V2Indicator combining in one chart : ADX + RSI.
V2 : NOW, BULL TREND = SLOPE(ADX)>0 AND SLOPE(long EMA)>0
Changing settings :
Slow ADX Smoothing : periods for the EMA to smooth the ADX
Zero? : threshold (dotted line) at which the label will show "trend" (if the ADX is increasing)
Length RSI : Periods for calculating RSI
Settings for MACD Length : don't touch, except if you need to.
Coded with my buttocks, thanks for your indulgence.
Credits at the beginning of the code (thanks to newmen41)

ADX FAST and NOICE FREE DIThis tool is designed to identify trend strength and direction earlier than the traditional ADX/DI system.
Instead of relying on the normal Wilder smoothing, this version applies momentum projection to ADX (Fast ADX)
and then filters all directional movement signals through Hull smoothing to minimize market noise.
The result:
• Trends are detected faster
• Pullbacks are filtered more cleanly
• Sideways or weak structures become easy to avoid
Recommended Usage:
• Look for Fast ADX above the threshold to confirm trend environment
• Use Noise-Free +DI and -DI to confirm trend direction (bullish / bearish dominance)
• Background color highlights only when trend + direction are aligned
This is not a buy/sell signal generator by itself; it is best used as a trend and market condition confirmation layer.
Disclaimer:
This script is provided for educational and informational purposes only.
It does not constitute financial advice or a recommendation to buy or sell any security.
Market conditions vary and past performance does not guarantee future results.
Always perform your own analysis and risk management, and trade responsibly.

ADX with Custom Limit LineSimple ADX with Custom Threshold
A clean, educational ADX indicator that allows traders to set their own trend strength threshold.
Features:
- Customizable limit line for personalized trend analysis
- Color-coded ADX line based on trend strength
- Educational reference lines (15, 25, 40, 50)
- Background highlighting when above custom threshold
- Comprehensive alerts for trend changes
Perfect for traders who want a simple but effective tool to assess trend strength without complexity.
This indicator helps understand:
- When trends are strong enough to trade
- How to interpret ADX readings
- Optimal entry/exit timing based on trend strength
Educational and straightforward - ideal for both beginners and experienced traders.
⚠️ RISK DISCLAIMER:
This indicator is for educational purposes only and does not constitute financial advice.
Trading involves significant risk of loss. Always do your own research and consider
consulting with a qualified financial advisor before making trading decisions.
ADX Green Trend, Red ChopBased on the ADX indicator. This uses the calculated slope of the ADX line to show if momentum is increasing or decreasing. Green means the slope of the ADX is positive and the trend in increasing. Red means the ADX slope is positive and momentum is decreasing.Gray or Yellow is aneutral transitional zone

ADX Speed DerivativeThe ADX Speed Derivative (ADXSD) is a cutting-edge trading indicator meticulously crafted for trend analysis. By harnessing the power of the Average Rate Of Change (AROC) method applied to the first and second derivatives (pictured in white and purple, respectively) of the ADX oscillator, this indicator transcends conventional tools, offering traders unparalleled insights into market dynamics.
Key Features and Analysis Capabilities:
The ADXSD stands out with its ability to detect shifts in market trend directions, precisely quantify the speed and intensity of those transitions, and gauge the weakening or strengthening of prevailing trends. This comprehensive toolkit is designed for traders who demand accuracy and nuance in their technical analysis.
AROC Differentiation:
Unlike traditional ADX-based indicators, the ADXSD incorporates the AROC method, offering a nuanced perspective on trend acceleration or deceleration. The first derivative provides insight into the simplest rate of change, while the second derivative unveils the acceleration or deceleration of the trend, empowering traders with a deeper understanding of market dynamics.
Signal Precision:
This indicator excels at pinpointing potential trend reversals and transitions. Utilizing AROC on the ADX oscillator, it generates precise signals marked on the chart, giving traders timely and actionable information to make informed decisions.
Customization and Adaptability:
The ADXSD offers a range of customization options to cater to diverse trading strategies. Traders can adjust the lookback parameters to align with their risk tolerance and preferences, ensuring a personalized and adaptive approach to technical analysis.
Trend Visualization:
Incorporating a visual approach, this indicator enhances the interpretation of market trends. Traders can quickly identify shifts in trend strength and direction by observing midline crossovers, providing a visual guide for strategic decision-making.
Comprehensive Analysis:
The ADXSD serves as a comprehensive tool for traders seeking in-depth insights into market trends. It complements existing technical indicators, offering a holistic approach to market analysis.
ADX trend reversal/continuation spotterThis indicator is based on ADX and uses a method based on pivot points to identify a possible trend reversal or trend continuation.
To better understand how to use this indicator, follow these instructions:
Check which type of line ADX is below/above.
If the ADX line is above the green line and has changed color, you can expect a possible trend change.
Similarly, if the ADX line is below the red line and has changed color, you can expect a continuation of the previous trend or a possible trend uptake based on the current situation in the chart.
FX:EURUSD
