RSI + ADX + ATR Combo Indicator: RSI + ADX + ATR Combo Filter
This indicator is a confluence filter tool that combines RSI, ADX, and ATR into a single, easy-to-read chart overlay. It is designed to help traders identify low-volatility, non-trending zones with balanced momentum—ideal for strategies that rely on breakouts or reversals.
🔍 Core Components:
RSI (Relative Strength Index)
Standard RSI with custom upper and lower bounds (default: 60 and 40).
Filters out extreme overbought/oversold regions and focuses on price consolidation zones.
ADX (Average Directional Index)
Measures trend strength.
When ADX is below a custom threshold (default: 20), it indicates a weak or range-bound trend.
ATR (Average True Range)
Represents volatility.
Low ATR values (default threshold: 2.5) are used to filter out high-volatility environments, helping refine entries.
🟣 Signal Logic:
A signal is highlighted with a background color when all three conditions are met:
RSI is between lower and upper bounds (e.g., 40 < RSI < 60) ✅
ADX is below the trend threshold (e.g., ADX < 20) ✅
ATR is below the volatility threshold (e.g., ATR < 2.5) ✅
These combined conditions suggest a low-volatility, low-trend strength, and balanced momentum zone—perfect for anticipating breakouts or strong directional moves.
在脚本中搜索"adx"

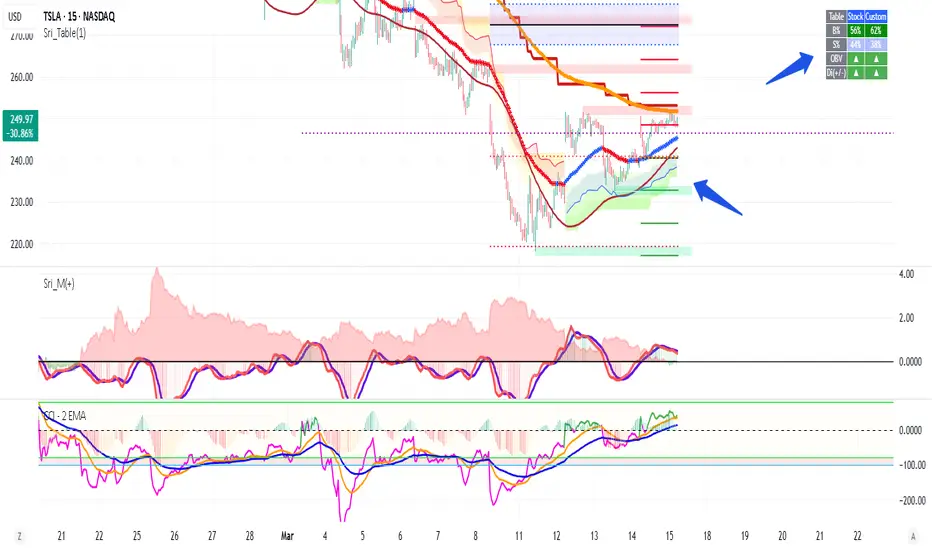
Volume +OBV + ADXVolume + OBV + ADX Table
Optimized Buyer & Seller Volume with Trend Indications
Overview:
This indicator provides a comprehensive view of market participation and trend strength by integrating Volume, On Balance Volume (OBV) trends, and ADX (Average Directional Index) signals into a visually structured table. Designed for quick decision-making, it highlights buyer and seller dominance while comparing the selected stock with another custom symbol.
Features:
✅ Buyer & Seller Volume Analysis:
Computes buyer and seller volume percentages based on market movements.
Displays daily cumulative volume statistics to assess ongoing market participation.
✅ On Balance Volume (OBV) Trends:
Identifies positive, negative, or neutral OBV trends using an advanced smoothing mechanism.
Highlights accumulation or distribution phases with colored visual cues.
✅ ADX-Based Trend Confirmation:
Evaluates Directional Indicators (DI+ and DI-) to determine the trend direction.
Uses customizable ADX settings to filter out weak trends.
Provides uptrend, downtrend, or neutral signals based on strength conditions.
✅ Custom Symbol Comparison:
Allows users to compare two different assets (e.g., a stock vs. an index or ETF).
Displays a side-by-side comparison of volume dynamics and trend strength.
✅ User-Friendly Table Display:
Presents real-time calculations in a compact and structured table format.
Uses color-coded trend signals for easier interpretation.
Recommended Usage for Best Results:
📌 Pairing this indicator with Sri_Momentum and Sri(+) Pivot will enhance accuracy and provide better trade confirmations.
📌 Adding other major indicators like RSI, CCI, etc., will further increase the probability of winning trades.
How to Use:
Select a custom symbol for comparison.
Adjust ADX settings based on market conditions.
Analyze the table to identify buyer/seller dominance, OBV trends, and ADX trend strength.
Use the combined signals to confirm trade decisions and market direction.
Best Use Cases:
🔹 Trend Confirmation – Validate breakout or reversal signals.
🔹 Volume Strength Analysis – Assess buyer/seller participation before entering trades.
🔹 Multi-Asset Comparison – Compare the behavior of two related instruments.
This indicator is ideal for traders looking to combine volume dynamics with trend-following strategies. 🚀📈
Supertrend pro+ (Adaptive ATR) Supertrend Pro+ (Adaptive ATR) - Param Approach
By SKP
Overview
This advanced Supertrend Pro+ strategy improves on the classic Supertrend indicator by integrating an Adaptive ATR, ensuring dynamic volatility adjustments for more accurate trend detection. This strategy filters out false signals using ADX trend strength validation and volume confirmation, making it a powerful tool for trend-following traders.
Key Features
✔ Adaptive ATR Calculation - Dynamically adjusts to market volatility for more reliable Supertrend signals.
✔ ADX Trend Filter - Ensures trades occur only in strong trending markets, avoiding false breakouts.
✔ Volume Confirmation - Prevents trading in low-liquidity conditions by verifying volume strength.
✔ Multi-Timeframe Analysis - Displays Supertrend trends from different timeframes for enhanced trade confidence.
✔ Trailing Stop & Take Profit Options - Allows flexible risk management with stop-loss and profit-targeting mechanisms.
✔ Custom Alerts for Trade Signals - Alerts trigger on confirmed Supertrend buy/sell signals and potential trend shifts.
✔ Max Drawdown Protection - Automatically closes trades if equity drops beyond a set percentage, preventing excessive losses.
How It Works
Adaptive ATR Calculation
Instead of using a fixed ATR, this strategy calculates an adaptive ATR based on a longer-term ATR baseline.
If volatility increases, the ATR expands dynamically, ensuring stop-losses and Supertrend calculations adjust accordingly.
Supertrend Confirmation
Uses an enhanced Supertrend algorithm with adaptive ATR to determine trend direction.
If price crosses above the trendline, it signals a bullish reversal (Buy Signal).
If price crosses below the trendline, it signals a bearish reversal (Sell Signal).
ADX Trend Strength Filter
Trades are only taken when ADX is above the threshold, ensuring entry in strong trending markets.
Volume Confirmation
Uses a relative volume filter to ensure sufficient liquidity before entering trades.
Helps avoid false breakouts in low-volume conditions.
Risk Management
Trailing Stop Loss - Automatically moves the stop as price moves in favor of the trade.
Manual Stop Loss & Take Profit - Allows precise percentage-based exit points.
Max Drawdown Protection - Closes all trades if equity falls below a set threshold, reducing risk.
Multi-Timeframe Supertrend Table
Displays Supertrend signals across different timeframes (1 min, 5 min, 15 min, 1 hour, Daily)
Helps traders align their entries with higher timeframe trends for better accuracy.
Custom Alerts
Alerts notify when a new buy/sell signal appears.
Extra early warning alerts indicate potential trade setups before confirmation.
How to Use
📌 For trend-following traders:
Focus on entries in the direction of the higher timeframes.
Only enter when ADX is trending and volume confirms liquidity.
📌 For scalpers:
Use shorter timeframes (1m, 5m, 15m) for quick trades.
Adjust the ATR multiplier and Adaptive ATR sensitivity for tighter stops.
📌 For swing traders:
Use longer timeframes (1H, Daily) for more stable trends.
Enable trailing stop loss to lock in profits as the trend progresses.
Inputs & Customization
ATR Period & Adaptive ATR Sensitivity
Supertrend Multiplier
ADX Filter & Threshold
Volume Confirmation Settings
Stop Loss & Take Profit Options
Multi-Timeframe Supertrend Display
Custom Alerts

Advanced Supertrend Enhanced ADXEnhanced Supertrend ADX Indicator - Technical Documentation
Overview
The Enhanced Supertrend ADX indicator combines ADX directional strength with Supertrend trend-following capabilities, creating a comprehensive trend detection system. It's enhanced with normalization techniques and multiple filters to provide reliable trading signals.
Key Features and Components
The indicator incorporates three main components:
Core ADX and Supertrend Fusion
Uses a shorter ADX period for increased sensitivity
Integrates Supertrend signals for trend confirmation
Applies a long-term moving average for trend context
Advanced Filtering System
Volatility filter: Identifies periods of significant market movement
Momentum filter: Confirms the strength and sustainability of trends
Lateral market detection: Identifies ranging market conditions
Data Normalization
Standardizes indicator readings across different instruments
Makes signals comparable across various market conditions
Reduces extreme values and false signals
Model Assumptions
The indicator operates under several key assumptions:
Market Behavior
Markets alternate between trending and lateral phases
Strong trends correlate with increased volatility
Price momentum confirms trend strength
Market transitions follow identifiable patterns
Signal Reliability
Low ADX values indicate lateral markets
Valid signals require both volatility and momentum confirmation
Multi-filter confirmation increases signal reliability
Price normalization enhances signal quality
Trading Applications
The indicator supports different trading approaches:
Trend Trading
Strong signals when all filters align
Clear distinction between bullish and bearish trends
Momentum confirmation for trend continuation
Range Trading
Clear identification of lateral markets
Band-based trading boundaries
Reduced false breakout signals
Transition Trading
Early identification of trend-to-range transitions
Clear signals for range-to-trend transitions
Momentum-based confirmation of breakouts
Risk Considerations
Important factors to consider:
Signal Limitations
Potential delay in fast-moving markets
False signals during extreme volatility
Time frame dependency
Best Practices
Use in conjunction with other indicators
Apply proper position sizing
Focus on liquid instruments
Consider market context
Performance Characteristics
The indicator shows optimal performance under specific conditions:
Ideal Conditions
Daily timeframe analysis
Clear trending market phases
Liquid market environments
Normal volatility conditions
Challenging Conditions
Choppy market conditions
Extremely low volatility
Highly volatile markets
Illiquid instruments
Implementation Recommendations
For optimal use, consider:
Market Selection
Best suited for major markets
Requires adequate liquidity
Works well with trending instruments
Timeframe Selection
Primary: Daily charts
Secondary: 4-hour charts
Caution on lower timeframes
Risk Management
Use appropriate position sizing
Set clear stop-loss levels
Consider market volatility
Monitor overall exposure
This indicator serves as a comprehensive tool for market analysis, combining traditional technical analysis with modern filtering techniques. Its effectiveness depends on proper implementation and understanding of market conditions.

Trend with ADX/EMA - Buy & Sell SignalsThis script is designed to help traders make buy and sell decisions based on trend analysis using two key methods: ADX (Average Directional Index) and EMA (Exponential Moving Averages). Here's a breakdown in simple terms:
What Does It Do?
Identifies the Trend's Strength and Direction:
Uses the ADX indicator to determine how strong the trend is.
Compares two lines (DI+ and DI−) to identify whether the trend is moving up or down.
Generates Buy and Sell Signals:
Uses two EMAs (a fast one and a slow one) to check when the price crosses key levels, signaling a possible buy or sell opportunity.
Plots visual indicators (arrows and labels) for easy interpretation.
Color-Codes the Chart:
Highlights the background in green when the trend is bullish (uptrend).
Highlights the background in red when the trend is bearish (downtrend).
Alerts the User:
Creates alerts when specific conditions for buying or selling are met.
Key Components:
1. ADX (Trend Strength & Direction)
What is ADX?
ADX measures how strong the trend is (not the direction). Higher ADX means a stronger trend.
It also calculates two lines:
DI+: Measures upward movement strength.
DI−: Measures downward movement strength.
How It Works in the Script:
If DI+ is greater than DI−, it’s a bullish trend (upward).
If DI− is greater than DI+, it’s a bearish trend (downward).
The background turns green for an uptrend and red for a downtrend.
2. EMA (Buy and Sell Decisions)
What is EMA?
EMA is a moving average that gives more weight to recent prices. It’s used to smooth out price fluctuations.
How It Works in the Script:
The script calculates two EMAs:
Fast EMA (short-term average): Reacts quickly to price changes.
Slow EMA (long-term average): Reacts slower and shows overall trends.
When the Fast EMA crosses above the Slow EMA, it’s a signal to Buy.
When the Fast EMA crosses below the Slow EMA, it’s a signal to Sell.
These signals are marked on the chart as "Buy" and "Sell" labels.
3. Buy and Sell Alerts
The script sets up alerts for the user:
Buy Alert: When a crossover indicates a bullish signal.
Sell Alert: When a crossunder indicates a bearish signal.
Visual Elements on the Chart:
Background Colors:
Green: When the DI+ line indicates an uptrend.
Red: When the DI− line indicates a downtrend.
EMA Lines:
Green Line: Fast EMA.
Red Line: Slow EMA.
Buy/Sell Labels:
"Buy" label: Shown when the Fast EMA crosses above the Slow EMA.
"Sell" label: Shown when the Fast EMA crosses below the Slow EMA.
Why Use This Script?
Trend Analysis: Helps you quickly identify the strength and direction of the market trend.
Buy/Sell Signals: Gives clear signals to enter or exit trades based on trend and EMA crossovers.
Custom Alerts: Ensures you never miss a trading opportunity by notifying you when conditions are met.
Visual Simplicity: Makes it easy to interpret trading signals with color-coded backgrounds and labeled arrows.

RSI + ADX + ATR 18-01-25Combining RSI (Relative Strength Index), ADX (Average Directional Index), and ATR (Average True Range) creates a synergistic approach to technical analysis. This powerful trio covers momentum, trend strength, and volatility, providing comprehensive insights into market conditions. Here's a deeper exploration of their combined results:
1. Momentum Assessment with RSI
Purpose: RSI measures the speed and magnitude of recent price changes to determine overbought or oversold levels.
Benefit in Combination:
When RSI indicates overbought (above 70) or oversold (below 30) levels, it signals a potential reversal or correction.
However, these signals can be false in strongly trending markets, which is why ADX is used alongside it.
2. Trend Strength Confirmation with ADX
Purpose: ADX confirms the presence and strength of a trend.
Benefit in Combination:
If RSI shows a potential reversal but ADX indicates a strong trend (above 25), the trend is likely to continue, and RSI signals may need to be approached with caution.
Conversely, if ADX is below 20 (weak trend), RSI signals are more likely to indicate genuine reversals, as the market lacks a strong directional push.
3. Volatility Analysis with ATR
Purpose: ATR evaluates the level of price volatility.
Benefit in Combination:
High ATR values indicate volatile conditions where prices can move significantly; this helps in setting wider stop-loss levels to avoid premature exits.
Low ATR values suggest quieter markets, where tighter stop-losses and profit targets are more suitable.

ADXcellenceThis advanced trading indicator, inspired by Dr. Charles B. Schaap's book "ADXcellence: Power Trend Strategies", leverages the principles of the Average Directional Index (ADX) to help traders identify and exploit trending conditions in the market.
The ADXcellence Indicator uses multiple levels of analysis to evaluate the strength and direction of trends.
In addition to the classic ADX+DMI input settings, these features are included:
ADX Slope Signal: This parameter, controls the sensitivity of the ADX slope, which will indicate when the trend strength is increasing or decreasing.
The indicator provides three trend levels: strong trend level, trending level, and low volatility level, which can be customized to suit various trading strategies.
The color gradients for the ADX, DI+, and DI- lines are designed to visually represent the trend strength from the low volatility level to the strong trend level. The indicator also uses a dynamic background color, highlighting the periods when the ADX is rising. The color will vary depending on the dominant DI.
The ADXcellence Indicator also offers a unique feature of dynamically adjusting the fill between DI+ and DI-, with the color and fill intensity changing based on the relative value of the two.
This indicator is a powerful tool for traders who use trend-following strategies and is best used in conjunction with other technical analysis tools to confirm signals and avoid potential false signals.
Remember, no indicator is perfect and every trading strategy should include risk management and proper due diligence.
Enjoy :)

DJ Soori Trading StrategyThe strategy combines three indicators: Exponential Moving Average (EMA), Weighted Moving Average (WMA), and Average Directional Index (ADX).
The EMA and WMA are used to track the average price over different time periods.
The ADX measures the strength of a trend in the market.
The strategy generates buy signals when the EMA is higher than the WMA and the ADX is above a certain threshold. It suggests a potential uptrend.
It generates sell signals when the EMA is lower than the WMA and the ADX is above the threshold. It suggests a potential downtrend.
The strategy also considers whether the ADX is rising or falling to indicate the strength of the trend.
The EMA, WMA, and ADX values are plotted on the chart.
Buy and sell signals are shown as labels on the chart, indicating "Buy (Strong)" or "Buy (Weak)" for buy signals, and "Sell (Strong)" or "Sell (Weak)" for sell signals.

Combined Strategy Trading Bot (RSI ADX 20SMA)Trading Bot V1, This code implements a combined trading strategy that uses several indicators and strategies to make buy and sell decisions in the market. The code is written in Pine Script™, which is a programming language used in the TradingView platform. By BraelonWhitfield.Eth
The strategy uses the Average Directional Movement Index (ADX) and the Pine SuperTrend indicator to identify trends and price movements in the market. The SuperTrend indicator is a popular technical analysis tool that helps to identify the direction of the current trend and provides entry and exit points for trades.
The strategy also uses the Relative Strength Index (RSI) to identify overbought and oversold conditions in the market. The RSI is a momentum indicator that measures the speed and change of price movements in the market.
The first part of the code defines the inputs for the ADX and DI Length, which are used to calculate the ADX and DI values. The dirmov() function is used to calculate the positive and negative directional indicators (plusDM and minusDM) based on the high and low prices. The truerange variable is then calculated using the True Range (TR) formula. Finally, the plus and minus variables are calculated using the smoothed moving average of the plusDM and minusDM values.
The adx() function is then used to calculate the ADX values based on the plus and minus variables. The Pine SuperTrend indicator is defined using the pine_supertrend() function. This function uses the high-low average (hl2) and the Average True Range (ATR) to calculate the upper and lower bands for the indicator. The direction of the current trend is then determined based on whether the current price is above or below the upper or lower bands.
The RSI values are then calculated using the ta.rsi() function, with the inputs for the close price and the RSI period. The overbought and oversold conditions are defined using the OB and OS inputs, which specify the threshold values for the RSI. The upTrend and downTrend variables are defined based on the direction of the Pine SuperTrend indicator.
The next part of the code defines the 20-period Simple Moving Average (SMA) using the ta.sma() function. The os and ob variables are then calculated based on the RSI values and the OB and OS inputs. The strategy.entry() function is used to define the buy and sell orders based on the upTrend and downTrend variables, as well as the Pine SuperTrend indicator, the 20-period SMA, and the os variable.
The final part of the code defines the Channel Breakout Strategy using the ta.highest() and ta.lowest() functions to calculate the upper and lower bounds of the channel. The strategy.entry() function is then used to define the buy and sell orders based on whether the current price is above or below the upper or lower bounds.
In summary, this code implements a combined trading strategy that uses several indicators and strategies to make buy and sell decisions in the market. The strategy is designed to identify trends and price movements in the market, as well as overbought and oversold conditions, to provide entry and exit points for trades. The strategy uses the Pine SuperTrend indicator, the ADX and DI indicators, the RSI, and the 20-period SMA, as well as the Channel Breakout Strategy to make informed trading decisions.

TUE ADX/MACD Confluence Algorithm V1This algorithm is designed to look at the ADX/MACD confluence for opening conditions, apply various filters including volume and volatility, then determine stop outs, break evens, and take profits.
The ADX and MACD confluence can be a powerful predictor in stock movements. Both of these indicators find trend but do it in different ways. When they're combined they have a high success rate of finding openings. That's done by finding the bar in which both show the same direction - that bar is the beginning of the confluence. I have a free indicator called the TUE ADX/MACD Confluence that you can use to see this in action.
This script will help you find those confluences in an easy to understand manner. It will open a trade on a detected confluence, using the rest of the variables available in the algorithm as filters. You can filter based on cumulative volume delta, volatility, and trend. It includes settings for either trend following or contrarian trades, and the ability to go long, short, or both.
It includes Buy and Sell signals for detected confluences, and will show colored candles to help you determine when to exit a trade if you don't want to follow the included take profit areas. When the candles turn to white that means the detected confluence is no longer in play. The Buy and Sell signals will display on the first occurrence of each confluence.
The take profit areas are based on proprietary math that help find peaks and valleys. You can adjust the size of the take profits as a percentage of the position, change to static take profits (i.e. take profit in 16 ticks), or use both. You can also disable them and use the natural closing conditions (reversal of MACD/ADX confluence).
Our algo works in any market and will allow user to adjust input settings to be used on any ticker they'd like. It is built as a strategy so you can back test on any ticker to find the exact right settings to dial it in and then switch to live trading mode to see signals. Can be used for day trades or swing trades.
Automated Trading
This algo has been tested and certified to work for automated trading.
Works on Forex
It's confirmed to work on forex so you can trade that market.
Gets you into long successful trades, and gets out of poor ones quickly
It keeps you in the long trades taking small profits along the way, but cuts losers quickly in comparison. This style leads to a high profit factor, as you can see over 3.0 in the included ES 3 Min chart.
It looks at many variables so you don't have to
- Uses ADX/MACD confluence for opening/closing conditions.
- It uses volume, if the user wants, to help filter entries. The volume calculation is based off of my proprietary cumulative volume delta indicator and helps find if the volume is moving long or short.
- It uses proprietary take profit math to help find peaks and valleys to peel off profits. It is based on the changes in momentum of the underlying.
- It allows for stop outs and break evens based on volatility so they'll always adjust with the movement of the underlying ticker (see the blue lines above and below the opening in the chart).
- It allows for offset break evens to keep a portion of the profit.
Strategy for the Algo
Included so you can understand how to trade with it.
ONE: After loading this strategy onto a ticker turn off volume if it's a ticker with no volume , set the dates at the bottom to when the stock is active (you want to start backtesting when a stock started trading like it trades currently).
TWO: From there adjust the ADX/MACD to find the highest win rate and profit factor.
THREE: Then adjust the volume length to find the highest win rate and profit factor. It's important while doing these that you pay attention to a smooth upward equity curve.
FOUR: After this has been done now adjust the long and short risk multipliers. This determines your stop out.
FIVE: Then adjust breakeven multipliers - this is the level at which it changes to a breakeven stop out instead of the previous one. You can also set an offset to keep a small part of the profit.
SIX: Finally adjust the take profit sizes.
SEVEN: Once this is all done go back through the list and adjust up and down by one or two clicks and see if a better curve can be obtained. Very frequently long and short trades have different settings.
EIGHT: When you are finished save the settings in a custom indicator template and put it with it's own chart.
Additional
The settings shown on screen are not the default settings, but are settings chosen for this ticker and timeframe based on the process above. Nearly every ticker and timeframe will require adjustment from default, that's why the algorithm is built to be highly flexible. It can fit any ticker and timeframe, as well as market environment.
Also included in the chart above is a $1.25 commission per contract, and a tick of slippage (which on average is about right for automated trading on ES).

MarkRoboTS Highest Lowest ADX**********************************************
( M | a | r | k | R | o | b | o | T | S )
**********************************************
The indicator is created starting from the maximum and minimum values at 15 periods of the ADX ; the intermediate levels are created with the FIBO parameters.
level 0 = low_Period
level 1 = low_Period + (High_Period - low_Period) * 0.786
level 2 = low_Period + (High_Period - low_Period) * 0.618
level 3 = low_Period + (High_Period - low_Period) * 0.50
level 4 = low_Period + (High_Period - low_Period) * 0.382
level 5 = low_Period + (High_Period - low_Period) * 0.236
level 6 = High_Period
When ADX exceeds level 1 trend ( bullish or bearish ) gets strong
When ADX goes from level 6 to lower levels it means that the trend is weakening (better to close the position)
L'indicatore è creato partendo dai valori massimi e minimi a 15 periodi dell'ADX; i livelli intermedi sono creati con i parametri FIBO.
level 0 = low_Period
level 1 = low_Period + (High_Period - low_Period) * 0.786
level 2 = low_Period + (High_Period - low_Period) * 0.618
level 3 = low_Period + (High_Period - low_Period) * 0.50
level 4 = low_Period + (High_Period - low_Period) * 0.382
level 5 = low_Period + (High_Period - low_Period) * 0.236
level 6 = High_Period
Quando ADX supera il livello 1 il trend (rialzista o ribassista) prende forza
Quando ADX passa da livello 6 a livelli più bassi vuol dire che il trend si sta indebolendo (meglio chiudere la posizione)

COG SSMACD COL combo with ADX Filter [orion35]This indicator consists of a combination of indicators produced by the most valuable developers in the market.
These are: Center of Gravity (COG) and Super Smoothed MACD (SSMACD) shared by @KivancOzbilgic and Center of Linearity (COL) shared by @alexgrover
I produced this indicator by writing new conditions that compare the signals given by these indicators with each other. I re-coded the change in the thickness of the cloud from the COL indicator as the middle horizontal line with varying color intensity and type. I have provided options for switching between these three indicators when desired.
Note: The strongest signals in the indicator are the blue colored triangles. Moderately strong ones are yellow signals. White colored signals are considered as the weakest signals.
Some minor fixes:
Some confusing words were thrown in the alarms section,
Added new alarm codes for any Triple or Double signals.
Major changes have been made with this update.
It is very important to know the direction and strength of the trend in financial markets. Therefore, ADX (Average Directional movement index) was developed by J. Welles Wilder in 1978 as an indicator of the trend strength in the prices of a financial instrument.
Especially in sideways markets, most indicators produce many false signals. However, these signals can be filtered with the ADX indicator. The price is considered sideways when the ADX is less than 20 as the threshold value.
With this update,
ADX filter can be activated when desired, and signals can be filtered flexibly according to the "threshold" value determined by the user. When the ADX filter is active, it will also reflect on the alarm conditions. Therefore, if an alarm is to be set according to the ADX filter, the filter must be activated first.
The colors of the lines and signals have been made changeable.
The visual level and thickness of the COL line has been made adjustable.
With this update, signals can be filtered according to the MavilimW indicator developed by @KivancOzbilgic
Filter Methods:
Normal: If the price is below the BlueW line, "bull" signals are filtered out, and above "bear" signals are filtered out.
Reverse : Applies the opposite of the normal method.
Fixed some visual bugs in switching between indicators.

Measure Volume, Momentum, Trend, VolatilityThis script displays the following indicators in one pane to quickly determine several important factors regarding price action. It allows the user to quickly see all of most important factors surrounding price action in one pane with one quick glance. This should be incredibly helpful and allow things like double divergence and trend confirmation to be spotted much more quickly. I personally use the data in this indicator to replace four separate indicators and it has brought my win rate and profit factor significantly higher. I hadn't seen any place where all of the best J. Welles Wilder indicators such as RSI, Parabolic SAR, and DMI/ADX were brought into one easy to use interface. This is my attempt at fixing that gap. For a much deeper understanding of how to use these indicators, I recommend reading New Concepts in Technical Trading Systems written by J. Welles Wilder.
Momentum via RSI (Relative Strength Index)
Volume via MFI (Money Flow Index)
Volatility via DMI/ADX (Direction Movement Index/Average Directional Index)
Trend via Parabolic SAR (Parabolic Stop and Reverse)
It is worth noting that DMI/ADX and Parabolic SAR can both help determine trend strength and volatility.
The Volatility mechanism is measured by DMI and ADX and displayed at the top of the pane using circles. The top, tiny circles reflect if show if positive DI or negative DI has a higher value. The small circles directly underneath indicate whether or not the ADX is above 20 (configurable, some may choose to increase this to 25 or even 30).
The Momentum mechanism is shown as standard RSI with the default being a white line and default period of 14, which is all configurable.
The Volume mechanism is shown as standard MFI with the default being a fuchsia line and default period of 14, which is also configurable.
The momentum and volume oscillators should be used in conjunction to help spot whether the trend is strong or weak using divergences and the middle, overbought, and oversold levels. These levels are also configurable.
The Trend mechanism is measured by Parabolic SAR and displayed at the bottom of the pane using diamonds. The default is red diamonds when in a bear trend, green when in an uptrend which is configurable. When price is above the Parabolic SAR, it is considered to be an uptrend. When price is below the Parabolic SAR, it is considered to be a downtrend. The way price is measured is also configurable (i.e. open, close, ohlc4, hlc3, etc.). When price crossed above or below the Parabolic SAR, the diamonds will change colors.
All the indicators displayed should be used in a well rounded strategy. For instance, I only trade when ADX is above 20 and rarely trade against the trend shown via PSAR. When trend shifts and divergences helped indicate a trend shift would occur using the RSI and MFI, it can be a great spot to take an entry. RSI/MFI can also confirm the trend is strong when they are not showing divergences and inline with price action. All of this data should be used in conjunction with good fundamental data and technical levels. Divergences with RSI and MFI on double tops or bottoms can also be incredibly powerful. There is no right or wrong way to use all the data displayed in this indicator, however using all four pillars of trading (Momentum, Volume, Trend, Volatility) will help ensure only the best trades are taken.

The Namib SpikeThank you to Karl S who coded my idea. Below are the trigger conditions. Testing would be welcomed. I have not looked at the effectivity on higher or lower timeframes. Feedback highly appreciated.
A 3-tiered alert/notification system:
Level 1 Alert (Pop-up notification "Level 1 Bullish Alert" or "Level 1 Bearish Alert"
1. Determine bullish or bearish trend of price above or below 200 EMA
2. RSI level (customizable level)
3. ADX (customizable level as well as option to filter that the current ADX value is higher/lower as 1,2,3,4,or 5 candles ago)
AND/OR
Level 2 Alert (Pop-up notification "Level 2 Bullish Alert" or "Level 2 Bearish Alert"
1. Determine bullish or bearish trend of price above or below 200 EMA
2. RSI level (customizable level)
3. ADX (customizable level as well as option to filter that the current ADX value is higher/lower as 1,2,3,4,or 5 candles ago)
4. Higher Timeframe trends for 2 higher Timeframes (price above/below 200EMA) agrees with current Timeframe
AND/OR
Level 3 Alert (Pop-up notification "Level 3 Bullish Alert" or "Level 3 Bearish Alert"
1. Determine bullish or bearish trend of price above or below 200 EMA
2. RSI level (customizable level)
3. ADX (customizable level as well as option to filter that the current ADX value is higher/lower as 1,2,3,4,or 5 candles ago)
4. Higher Timeframe trends for 2 higher Timeframes (price above/below 200EMA) agrees with current Timeframe
5. Percentage (customizable) from previous H1/H4/D1/W1's (customizable) high & low prices

TridentI call this strategy "Trident", as it uses three different, modified, customizable indicators:
50 Exponential Moving Average (Trend)
Relative Strength Index (Momentum)
Average Directional Index (Volatility)
Strategy will be improved with future updates. You alone decide when to enter and when to exit a trade. PRICE ACTION IS KING and the TREND IS YOUR FRIEND
What do these three indicators tell us
Exponential Moving Average:
Trend
Price < EMA = downtrend
Price > EMA = uptrend
trend direction and reducing noise
Average Directional Index:
Volatility
direction of market movement when there is a sharp increase in volatility
Relative Strength Index:
Momentum
Strength
Possible shift in momentum
How this strategy works
As I mentioned above, this strategy uses uses three different, modified, customizable indicators:
Exponential Moving Average (50) (Trend): When price closes above or below the 50 period EMA, then the first condition is met. I know some people use multiple EMAs as dynamic support and resistance levels. Therefore, I also added a 21 and a 200 period EMA, but this strategy uses specifically the 50 period EMA as one of three conditions. All EMAs can be adjusted, turned on and off.
Relative Strength Index (80, 20, 3) (Momentum): In his video, TSM uses a 3 period RSI and 80 and 20 bands. If price is above 80, it`s overbought and if it`s below 20, then it`s oversold. Two out of three conditions are met.
Average Directional Index (5, 5) (Volatility): TSM uses the ADX to measure the volatility. Both ADX Smoothing and DI Length are set to 5. If this indicator moves above 30, then the third contidion is met.
Rules to enter the trade
Long Entry:
50 EMA < Price
RSI < 20
ADX > 30
Enter trade at breakout of high of the green candle, which is the candle that pulls the RSI from oversold conditions back inside.
Short Entry:
50 EMA > Price
RSI > 80
ADX > 30
Enter trade at breakout of low of the red candle, which is the candle that pulls the RSI from overbought conditions back inside.
Risk:Reward and Timeframe
Use a 1:1 to 1:1.5
Set your S/L below key levels (-> 2nd point @ Tips), or twice the length of the signal candle
Preferably 5 Minute Time Frame, but at the end you decide
Tips
Avoid periods of consolidation
Trade from support/resistance-levels, supply/demand-levels, pivot points-levels, Fibonacci-levels, swing high/low-levels
Trade during market hours, for example London and New York Session
Trade narrow spreads, if you scalp
Use Price Action
Trade with the trade, not against
The further away the price moves from the EMA the stronger the trend
The long the price doesn't touch the EMA the stronger the trend
RSI + ADX: Confirm when the market is turning and pick a good entry point
ADX + 50 EMA: Filters trades when there is not much activity in the market
I mentioned above that the code of this strategy is still under development. You can not only rely on this strategy alone as it might give you false signals. I coded this, because it makes it easier to visualize were all three conditions are met.
Use your brain, use price action, use these tips, use this strategy.
Frequently Asked Questions
Does it only work for scalping? - No, but try it out yourself
Does it only work for Forex? - No, but try it out yourself
Does only work on the 5 Minute Timeframe? - No, but try it out yourself
Good Luck!

MrBS:Directional Movement Index [Trend Friend Strategy]This goes with my MrBS:DMI+ indicator. I originally combined them into one, but then you cannot set alerts based on what the ADX and DMI is doing, only strategy alerts, so separate ones have more flexibility and uses.
Indicator Version is found under "MrBS:Directional Movement Index " ()
//// THE IDEA
The majority of profits made in the market come from trending markets. Of course there are strategies that would say otherwise but for the majority of people, THE TREND IS YOUR FRIEND (until the end). The idea is to follow the trend, entering once it has established its self and exiting positions when the trend weakens. This strategy gives a rough idea of the returns produced from following purely the ADX signals. At first Heikin Ashi values were used for the calculation but the results show it's not that effective. The functionality to switch between calculation types has been left in, so we can uses HA candle data to generate signals from while looking at an OHLC chart, if we want to experiment. Due to the way strategies work, we are unable to get reliable results when running the strategy on the HA chart even if we are calculating the signals from the real OHLC values. It is best to always run strategies on standard charts.
When using this strategy, I look for confirmation of the signal based on stochastic (14:3:6) direction, reversal level of stochastic, and divergance, to add confidence and adjust position size accordingly. I am going to try and code some version of that in future updates, if anyone can help or has suggestions please drop me a message.
//// INDICATOR DETAILS
- The default settings are for optimized Daily charts, for 4 hour I would suggest a smoothing of 2.
- The default values used for calculation are the Real OHLC, we can change this to Heikin Ashi in the menu.
- The strategy enters a position when ADX crosses the threshold level, and closes the position when ADX starts to fall.
- There is a signal filter in the form of a 377 period Hull Moving Average, which the price must be above or bellow for long and short positions respectively.
- The strategy closes the position when a cross-under of the ADX and its 4 period EMA. This is an attempt to stay into positions longer as sometimes the ADX will fall for 1 bar and then keep rising, while the overall trend is strong. The downside to this is that we exit trades later and this affects our max drawdown.

STD-ADX Trade Signal(Basic Ver1.0)==日本語説明も併記 // Japanese discription is following ==
Draw the trend judgment on the chart by combining the "ADX", "Standard deviation" and "Bollinger Band".
Red = Up trend
Blue = Down trend
Yellow = Range
" Triple Smoothed ADX "and" Triple Standard Deviation "in combination with" Triple STD-ADX "is recommended.
========================================================
「ADX」と「Standard Deviation」と「Bollinger Band」を組み合わせたトレンド判断をチャート上に描画します。
赤=上昇トレンド
青=下降トレンド
黄=レンジ
「 Triple Smoothed ADX 」と「 Triple Standard Deviation 」を組み合わせた「Triple STD-ADX」を併せて表示させることをおすすめします。
QuantMotions - TPR SentinelQuantMotions – TPR Sentinel
The TPR Sentinel Band is a full trade-assistant for discretionary traders.
It combines an adaptive trend engine, directional TPR logic, volume intelligence, ATR-based risk management, a brute-force parameter optimizer, and a modern on-chart UI (entries/TP/SL panel + stats). The goal: fewer fake flips, clearer trend shifts, and visually guided trade management.
1. Core Concept
The Sentinel Line is built from a blend of:
- SMA + EMA
- Midline of highest/lowest high/low (Kijun-style)
- Donchian-style mid close
On top of that, the script calculates a Directional TPR (Time-Price-Ratio):
- Short / medium / long slopes of price
- Normalized by ATR
- Converted into a trend state:
+1 = Uptrend
-1 = Downtrend
0 = Neutral / transition
Hysteresis (Flux) controls how easily the trend flips:
- Higher hysteresis → harder to reverse → fewer fake-outs in chop.
2. Signals, Filters & Volume Intelligence
Signals
- Trend Flip Long: TrendState changes from −1/0 → +1.
- Trend Flip Short: TrendState changes from +1/0 → −1.
Filters
- ADX Filter (optional):
- Only allows trades if ADX is above a chosen threshold.
- Avoids trading in flat, low-energy markets.
R:R Filter:
- Before any signal is accepted, the script checks whether the distance to TP1 is at least the configured Risk:Reward ratio relative to the distance to SL.
- Only if that minimum R:R is reached, a signal becomes valid.
Volume Intelligence & Clouds
- Aggregates up/down volume (optionally across multiple tickers you define).
- Builds Volume Clouds around the Sentinel Line:
a) Positive intensity → buying pressure (bullish cloud).
b) Negative intensity → selling pressure (bearish cloud).
Optional Volume Direction Filter:
- Long only when volume intensity ≥ 0.
- Short only when volume intensity ≤ 0.
3. Risk, Exits & Trailing Stop
The indicator includes a complete exit framework (for visual/manual trading):
Stop Loss Modes
- ATR Fixed: SL placed at a fixed ATR multiple from the entry.
- Trend Line (Dynamic): SL placed directly on the Sentinel Band (structural stop).
Take Profits
- TP1 – “safe target”:
a) Based on ATR distance.
b) Closes a configurable percentage of the position (e.g., 50%).
- TP2 (optional):
Second fixed target used only when Trailing Stop is OFF.
- Trend Runner Mode (Use TP = OFF):
Ignores fixed TP levels and rides the trend until the trend state flips.
Trailing Stop
- Activates after TP1 is hit (if enabled).
- Moves with price at a configurable ATR distance:
a) Long: trail creeps up under price.
b) Short: trail creeps down above price.
- Visually plotted as a purple trail line, dynamically replacing the original SL as the effective exit point.
Each trade is tracked internally and drawn as a green/red box with PnL labels between entry and exit.
4. UI & Stats
Candle Coloring (TRON Theme)
- Cyan = active uptrend & valid environment.
- Orange = active downtrend & valid environment.
Modern Trade Panel (on last bar)
- Live overlay of:
a) Entry
b) TP1
c) TP2
d) SL or active Trail (with dynamic label text: “SL (ATR)”, “SL (Struct)”, “TRAIL”)
Info label shows:
- Historical win rate in the current direction (Long/Short).
- Distance to SL, TP1, TP2 from current price.
- Box color blends from red → green depending on whether price is closer to SL or TP.
Stats Table (Bottom Right)
- Separate stats for Long and Short trades:
a) Win rate (%)
b) Cumulative PnL
Alerts
- Generates JSON alerts on signals, for example: {"side":"buy","ticker":"XYZ","price":123.45}
Perfect for webhooks, bots, or external automation.
5. Brute Force Optimizer (TPR Lab) – Important Limitations
The built-in Optimizer is a numerical helper, not a full strategy optimizer.
What it does:
- Runs brute-force simulations over a sliding window of historical data.
- Scans user-defined ranges for:
- Best Period (“Best Cycle”)
- Best Hysteresis (“Best Flux”)
Uses an efficiency score (average profit per trade) to rank combinations.
Displays results in the bottom-left TRON panel:
- Best Cycle
- Best Hysteresis
- Efficiency Score
What it does NOT optimize or take into account:
- It does not include your actual minimum R:R filter.
- It does not simulate or optimize your Stop Loss modes.
- It does not simulate Trailing Stops.
- It does not use the ADX filter.
- It does not use the Volume filters or Volume Clouds.
Because of this, the suggested “best” Period and Hysteresis are purely computational recommendations based on a simplified internal model.
In real trading, with your full setup (R:R filter, SL mode, Trailing, ADX, Volume confirmation, personal style), other parameter combinations can be superior to what the Optimizer suggests.
You should treat the Optimizer as:
A starting point or a research tool, not the final truth.
Always validate its suggestions visually, in the context of your full system and risk management.
6. Practical Usage
- Works on FX, indices, crypto, commodities – anything with decent liquidity.
- Scalping → use lower Period values, higher responsiveness.
- Swing → use higher Period values, more stability.
Recommended:
- Keep ADX filter ON to avoid dead markets.
- Use Volume Clouds as directional bias.
- Use the Info Panel and Stats to align with your own R:R and risk rules.
Disclaimer
This script is for educational/analytical purposes only and does not constitute financial advice. It does not execute trades or manage your risk automatically. Always combine it with your own strategy, money management, and independent decision-making.
Use the Info Panel and Stats to align with your own R:R and risk rules.

Adaptive Trend Mapper-ATM (Arjo)Adaptive Trend Mapper (ATM) is a multi-factor trend, momentum, and compression-analysis tool designed to help traders visually map the strength and direction of market pressure.
Instead of simply combining existing indicators, ATM creates a new composite framework that blends momentum imbalance, directional strength, volatility contraction, and adaptive smoothing into a single, unified model.
Originality and usefulness
Adaptive Trend Mapper (ATM) does not replicate any one indicator.
It generates two custom indices— Bull Pressure Index and Bear Pressure Index —derived from a mathematical combination of RSI, inverse-RSI, and ADX. These indices behave differently from traditional oscillators:
They represent directional pressure on a 0–100 scale , not momentum.
They are designed to converge/diverge, forming a basis for the built-in Squeeze Detection Engine.
They can be optionally step-compressed , making the movement easier to read on fast or small charts.
The script also integrates a custom SuperSmoother trend model (not TradingView’s built-in function), which acts as an adaptive trend curve on the chart.
All calculations are combined intentionally—not as a mashup—to create a framework that allows traders to understand trend strength, compression phases, and micro-trend shifts in one place.
How the Indicator Works
1. Bull & Bear Pressure Indices:
These indices measure directional imbalance:
Bull Index = ADX strength weighted against inverse-RSI
Bear Index = ADX strength weighted against normal RSI
This produces two opposing pressure curves that rise or fall depending on whether buyers or sellers dominate.
You can optionally smooth these using:
SMA / EMA / WMA / RMA via the “Smoothing Settings” panel.
2. Squeeze & Compression Detection:
A squeeze is detected when:
ADX stays below a user-defined threshold
Bull–Bear Index difference shrinks
Average difference is falling (convergence)
This is a volatility-contraction model inspired by squeeze logic but applied to directional pressure, not Bollinger Bands/Keltner Channels .
3. Adaptive Trend Curve (SuperSmoother Engine)
The indicator applies a two-pole SuperSmoother filter to the price, then smooths it again using EMA.
The slope color flips between bullish and bearish and is displayed using:
A thin SuperSmoother curve
A thicker band for visual context
4. EMA-50 Trend Context:
An optional EMA-50 helps identify broad directional bias .
5. Step-Based Scaling
You can quantize the Bull/Bear indices using custom step intervals.
This makes the indicator easier to read on noisy intraday charts.
How to Use the Indicator
1. Trend Analysis
A rising Bull Index shows strengthening upward pressure
A rising Bear Index shows strengthening downward pressure
Wide divergence between the indices signals a strong trend
2. Compression / Squeeze Analysis
Yellow background = volatility compression + pressure convergence
Breakouts from this zone often precede directional expansion
3. Trendline Reading
SuperSmoother line color flip = micro trend shift
EMA-50 slope gives macro-trend direction
Perfect for combining trend and momentum maps on the same chart
4. Visual Interpretation
Cyan/teal → strong bullish pressure
Purple/red/orange → various levels of bearish control
Neutral/teal background → weak ADX
Yellow background → squeeze zone
Open-Source Notes
This script uses:
TradingView built-in RSI, ADX/DMI, and smoothing functions
A SuperSmoother implementation based on known DSP filter coefficients
All remaining logic, signal methods, composite indices, and compression model are original developments by ARJO .
The script is published open-source to comply with TradingView’s reuse policy.
Disclaimer
This tool is for educational and analytical purposes only.
It does not generate buy or sell signals.
Always use proper risk management.
Happy Trading (ARJO)

EMA 12-26-100 Momentum Strategy# Triple EMA Multi-Signal Momentum Strategy
## 📊 Overview
**Triple EMA Multi-Signal** is a comprehensive trend-following momentum strategy designed specifically for cryptocurrency markets. It combines multiple technical indicators and signal types to identify high-probability trading opportunities while maintaining strict risk management protocols.
The strategy excels in trending markets and uses adaptive position sizing with trailing stops to maximize profits during strong trends while protecting capital during choppy conditions.
## 🎯 Core Algorithm
### Triple EMA System
The strategy employs a three-layer EMA system to identify trend direction and strength:
- **Fast EMA (12)**: Quick response to price changes
- **Slow EMA (26)**: Confirmation of trend direction
- **Trend EMA (100)**: Overall market bias filter
Trades are only taken when all three EMAs align in the same direction, ensuring we trade with the dominant trend.
### Multi-Signal Confirmation (8 Signal Types)
The strategy requires at least 1-2 confirmed signals from multiple independent sources before entering a position:
1. **EMA Crossover** - Fast EMA crossing Slow EMA (primary signal)
2. **MACD Cross** - MACD line crossing signal line (momentum confirmation)
3. **RSI Reversal** - RSI bouncing from oversold/overbought zones
4. **Price Action** - Strong bullish/bearish candles (>60% of range)
5. **Volume Spike** - Above-average volume confirmation
6. **Breakout** - Price breaking 20-period high/low with volume
7. **Pullback to EMA** - Trend continuation after healthy retracement
8. **Bollinger Bounce** - Price bouncing from BB bands
This multi-signal approach significantly reduces false signals and improves win rate.
## 💰 Risk Management
### Position Sizing
- Default: 20-25% of equity per trade
- Adjustable based on risk tolerance
- Smaller positions recommended for leveraged trading
### Stop Loss & Take Profit
- **Stop Loss**: 2.0% (tight control of risk)
- **Take Profit**: 5.5% (2.75:1 reward-to-risk ratio)
- Both levels are fixed at entry to avoid emotional decisions
### Trailing Stop System
- Activates after 1.8% profit
- Trails at 1.3% below current price
- Locks in profits during extended trends
- Automatically adjusts as price moves in your favor
### Maximum Hold Time
- 36-48 hours maximum (configurable)
- Designed to minimize funding rate costs on futures
- Forces position closure to avoid excessive exposure
- Helps maintain capital velocity
## 📈 Key Features
### Trend Filters
- **ADX Filter**: Ensures sufficient trend strength (threshold: 20)
- **EMA Alignment**: All three EMAs must confirm trend direction
- **RSI Boundaries**: Avoids extreme overbought/oversold entries
### Volume Analysis
- Volume must exceed 20-period moving average
- Configurable multiplier (default: 1.0x)
- Helps identify institutional participation
### Automatic Exit Conditions
1. Take Profit target reached
2. Stop Loss triggered
3. Trailing stop activated
4. Trend reversal (EMA cross in opposite direction)
5. Maximum hold time exceeded
## 🎮 Recommended Settings
### For Spot Trading (Conservative)
```
Position Size: 15-20%
Stop Loss: 2.5%
Take Profit: 6.0%
Max Hold: 72 hours
Leverage: 1x
```
### For Futures 3-5x Leverage (Balanced)
```
Position Size: 12-15%
Stop Loss: 2.0%
Take Profit: 5.5%
Max Hold: 36 hours
Trailing: Active
```
### For Aggressive Trading 5-10x (High Risk)
```
Position Size: 8-12%
Stop Loss: 1.5%
Take Profit: 4.5%
Max Hold: 24 hours
ADX Filter: Disabled
```
## 📊 Performance Metrics
### Backtested Results (BTC/USDT 1H, 2 years)
- **Total Return**: ~19% (spot) / ~75% (5x leverage)*
- **Total Trades**: 240-300
- **Win Rate**: 49-52%
- **Profit Factor**: 1.25-1.50
- **Max Drawdown**: ~18-22%
- **Average Trade**: 0.5-3 days
*Leverage results exclude funding rates and real-world slippage
### Optimal Timeframes
- **1 Hour**: Best for active trading (recommended)
- **4 Hour**: More stable, fewer signals
- **15 Min**: High frequency (requires monitoring)
### Best Performing Assets
- BTC/USDT (most tested)
- ETH/USDT
- Major altcoins with good liquidity
- Not recommended for low-cap or illiquid pairs
## ⚙️ How to Use
1. **Add to Chart**: Apply strategy to 1H BTC/USDT chart
2. **Adjust Settings**: Configure risk parameters based on your preference
3. **Review Signals**: Green = Long, Red = Short, labels show signal count
4. **Monitor Performance**: Check strategy tester for detailed statistics
5. **Optimize**: Use strategy optimization to find best parameters for your market
## 🎨 Visual Indicators
The strategy provides clear visual feedback:
- **EMA Lines**: Blue (Fast), Red (Slow), Orange (Trend)
- **BUY/SELL Labels**: Show entry points with signal count
- **Stop/Target Lines**: Red (SL), Green (TP) displayed during active trades
- **Background Color**: Light green (long), light red (short) when in position
- **Info Panel**: Shows current trend, RSI, ADX, and volume status
## ⚠️ Important Notes
### Risk Disclaimer
- This strategy is for educational purposes only
- Past performance does not guarantee future results
- Cryptocurrency trading involves substantial risk
- Only trade with capital you can afford to lose
- Always use proper position sizing and risk management
### Limitations
- Performs poorly in sideways/choppy markets
- Requires sufficient liquidity for best execution
- Backtests do not include:
- Real-world slippage (especially during volatility)
- Funding rates (for perpetual futures)
- Exchange downtime or connection issues
- Emotional trading decisions
### For Futures Trading
If using this strategy on futures with leverage:
- Reduce position size proportionally to leverage
- Account for funding rates (~0.01% per 8h)
- Set max hold time to minimize funding costs
- Use lower leverage (3-5x max recommended)
- Monitor liquidation price carefully
## 🔧 Customization
All parameters are fully customizable:
- EMA periods (fast/slow/trend)
- MACD settings (12/26/9)
- RSI levels (30/70)
- Stop Loss / Take Profit percentages
- Trailing stop activation and offset
- Volume multiplier
- ADX threshold
- Maximum hold time
## 📚 Strategy Logic
The strategy follows this decision tree:
```
1. Check Trend Direction (EMA alignment)
↓
2. Scan for Entry Signals (8 types)
↓
3. Confirm with Filters (ADX, Volume, RSI)
↓
4. Enter Position with Fixed SL/TP
↓
5. Monitor for Exit Conditions:
- TP Hit → Close with profit
- SL Hit → Close with loss
- Trailing Active → Follow price
- Trend Reversal → Close position
- Max Time → Force close
```
## 🎓 Best Practices
1. **Start Conservative**: Use smaller position sizes initially
2. **Track Performance**: Monitor actual vs backtested results
3. **Optimize Regularly**: Market conditions change, adapt parameters
4. **Combine with Analysis**: Don't rely solely on automated signals
5. **Manage Emotions**: Stick to the system, avoid manual overrides
6. **Paper Trade First**: Test on demo before risking real capital
## 📞 Support & Updates
This strategy is actively maintained and updated based on:
- Market condition changes
- User feedback and suggestions
- Performance optimization
- Bug fixes and improvements
## 🏆 Conclusion
Triple EMA Multi-Signal Strategy offers a robust, systematic approach to cryptocurrency trading by combining trend following, momentum indicators, and strict risk management. Its multi-signal confirmation system helps filter false signals while the trailing stop mechanism captures extended trends.
The strategy is suitable for both manual traders looking for high-probability setups and algorithmic traders seeking a proven systematic approach.
**Remember**: No strategy wins 100% of the time. Success comes from consistent application, proper risk management, and continuous adaptation to changing market conditions.
---
*Version: 1.0*
*Last Updated: November 2025*
*Tested on: BTC/USDT, ETH/USDT (1H, 4H timeframes)*
*Recommended Capital: $5,000+ for optimal position sizing*

RSI + Psy + ADXRSI + Psychological Line + ADX (with RCI-replacement logic)
This custom TradingView indicator combines three major technical analysis tools—RSI, Psychological Line (Psy), and ADX—to help traders identify trend strength, market momentum, and overbought/oversold conditions with improved clarity.
1. Multi-Period RSI
The indicator calculates three RSI values:
Short-term RSI (9)
Mid-term RSI (26)
Long-term RSI (52)
These help users observe short-, mid-, and long-term momentum simultaneously.
Threshold lines are drawn at 70, 50, and 30 for standard RSI overbought/oversold analysis.
2. Psychological Line (Psy) with Dynamic Column Display
The Psy indicator counts how many closes within the selected period (default: 12) were higher than the previous close.
Values above 75 indicate overbought markets.
Values below 25 indicate oversold markets.
When Psy crosses these thresholds, it is displayed as a column chart centered at 50, visually expanding upward (overbought) or downward (oversold).
3. ADX Trend Strength with Color Coding
ADX is calculated from DI+ and DI− values (using true range and directional movement).
The ADX line changes color based on trend strength:
Blue: Weak trend (below 20)
Yellow: Moderate trend (20–30)
Red: Strong trend (above 30)
This helps traders easily recognize when the market transitions from low-volatility to strong-trend conditions.

TCP DMITCP DMI - Advanced Technical Indicator
This advanced DMI (Directional Movement Index) indicator enhances the traditional DMI by adding intelligent dynamic support and resistance levels based on historical price action analysis.
KEY FEATURES:
1. Standard DMI Components:
- DI+ (Directional Indicator Positive): Measures upward price movement
- DI- (Directional Indicator Negative): Measures downward price movement
- ADX (Average Directional Index): Measures trend strength
- Middle line at 20 for reference
2. Dynamic Support & Resistance Levels:
The indicator automatically identifies the most significant support and resistance levels by analyzing the last 400 candles (customizable) and detecting where DI lines have been rejected most frequently.
TWO TIERS OF LEVELS:
A) Normal Levels (Solid Lines):
- Support: Below 15
- Resistance: Above 25
- Style: Solid lines with 60% transparency
- These represent moderate support/resistance zones
B) Strong Levels (Dashed Lines):
- Strong Support: Below 10
- Strong Resistance: Above 30
- Style: Dashed lines with 40% transparency (more visible)
- These represent critical support/resistance zones
3. Intelligent Display Logic:
- When DI is ABOVE 20: Shows resistance levels (where price might face selling pressure)
- When DI is BELOW 20: Shows support levels (where price might find buying support)
- Each DI line (+ and -) has its own color-coded support/resistance levels for easy identification
4. Color Coding:
- DI+ levels use GREEN (customizable)
- DI- levels use RED/ORANGE (customizable)
- Support/Resistance lines match their respective DI colors but with reduced opacity
- This makes it instantly clear which DI the support/resistance belongs to
5. Rejection Detection Algorithm:
The indicator scans historical data to find peaks and troughs at specific levels, counting how many times price was rejected at each level. The level with the most rejections becomes the displayed support or resistance.
CUSTOMIZABLE PARAMETERS:
- ADX Smoothing: Default 14
- DI Length: Default 14
- Lookback Period: 400 candles (range: 50-500)
- Line Length: 15 candles forward + 15 candles back = 30 candle span
- DI+ Color: Customizable (default green)
- DI- Color: Customizable (default red)
- ADX Color: Customizable (default blue)
- Normal S/R Transparency: Default 60%
- Strong S/R Transparency: Default 40%
HOW TO USE:
1. Trend Identification:
- When DI+ crosses above DI-: Potential uptrend
- When DI- crosses above DI+: Potential downtrend
- ADX above 25: Strong trend
- ADX below 20: Weak trend or ranging market
2. Support/Resistance Trading:
- Watch for price reaction when DI approaches displayed support/resistance levels
- Solid lines = moderate levels
- Dashed lines = strong levels (more significant)
- The more rejections at a level, the more significant it becomes
3. Entry/Exit Signals:
- Entry: When DI bounces off support (below 20) or resistance (above 20)
- Exit: When DI breaks through major support/resistance levels
- Strong levels (dashed) are more reliable for major decisions
ADVANTAGES:
✓ Reduces chart clutter by only showing relevant levels based on current DI position
✓ Automatically adapts to changing market conditions
✓ Color-coded for instant visual recognition
✓ Two-tier system helps prioritize trading decisions
✓ Historical rejection analysis provides data-backed levels
✓ Fully customizable to match any trading style
BEST USED FOR:
- Swing trading
- Trend following
- Support/resistance trading strategies
- Identifying potential reversal zones
- Confirming breakout validity
- Risk management (stop-loss placement)
This indicator combines the power of traditional DMI with smart support/resistance detection, giving traders a comprehensive tool for technical analysis without overwhelming the chart with excessive information.

Camarilla Trading - D/W/M, Alerts, TP/SL, ADX, VWAP/EMA, VolumeCamarilla Trading System
Overview
This advanced Pine Script indicator implements a comprehensive Camarilla trading system with multiple filtering mechanisms, position management, and real-time statistics. It's designed for day traders and swing traders using Camarilla pivot levels with enhanced confirmation filters.
Key Features
🎯 Core Components
- Camarilla Levels: Calculates H3, H4, H5, L3, L4, L5 pivot levels from previous period data
- Multi-Timeframe Support: Daily (D), Weekly (W), and Monthly (M) timeframe options
- Smart Position Management: Automated entry/exit with take profit and stop loss levels
📊 Advanced Filtering System
- ADX Filter**: Optional trend strength filter using Average Directional Index
- Volume Filter**: High-volume confirmation with customizable multiplier
- Trend Filter**: VWAP or EMA-based trend direction confirmation
💹 Trading Signals
Long Entries:
- Condition 1: Open crosses above H4 (below H5)
- Condition 2: Open crosses above L3 (below H3)
Short Entries:
- Condition 1: Open crosses below L4 (above L5)
- Condition 2: Open crosses below H3 (above L3)
📈 Visual Features
- Level Display: Clear plotting of all Camarilla levels
- Signal Markers: Visual entry/exit signals on chart
- Volume Coloring: Bars colored lime/purple during high-volume periods
- Trend Indicators: Colored VWAP/EMA lines based on ADX trend direction
- Real-time Statistics: Performance table with win rate, P&L, and trade metrics
⚙️ Customization Options
- Toggle individual filters on/off
- Adjustable parameters for all indicators
- Customizable display options
- Flexible timeframe selection
🔔 Alert System
- Buy/Sell signal alerts
- Position exit alerts
- Customizable alert conditions
📊 Performance Tracking
- Automatic trade statistics
- Win rate calculation
- Average profit per trade
- Total P&L tracking
- Trade history from start date
Input Parameters
Timeframe & Levels
- Timeframe levels: D/W/M selection for pivot calculations
- Show levels labels: Toggle level price labels
Filter Settings
- ADX filter: Enable/disable trend strength filter
- ADX length/treshold: Customize ADX parameters
- Volume filter: High-volume confirmation
- Volume length/multiplier: Volume MA settings
- Trend filter: VWAP/EMA trend confirmation
- EMA length: EMA period for trend filter
Display Options
- Show signals: Display entry/exit markers
- Show TP/SL: Show take profit/stop loss levels
- Show statistics: Performance table display
- Colored bars: Volume-based bar coloring
Usage Notes
- Non-repainting: Signals are fixed at bar open price
- Multi-timeframe: Uses security calls for accurate previous period data
- Position Management: Automated TP/SL based on Camarilla levels
- Risk Management: Built-in trading time restrictions
This system provides institutional-grade Camarilla trading with professional risk management features suitable for both manual trading and strategy development.
