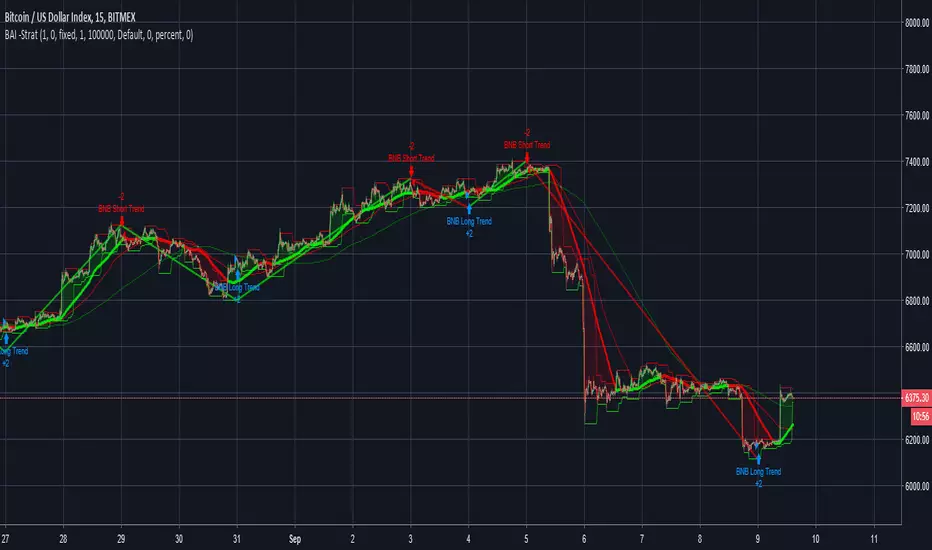
Bishop AI - StrategyBishop AI model Indicator, to be used in conjunction with Fractal Identifier and Analytic Model Adapted to Strategy as requestedPine Script®策略由BishopTA提供141415
Newton Pulse Pro AI Exclusive – Newton Next-Generation Trend Intelligence & Smart Range Filtering Introduction Newton is the newest powerhouse in the AI Exclusive series, specifically engineered to master trend dynamics. While most indicators fail during choppy, sideways markets, Newton uses advanced AI logic to distinguish between a true trending move and a high-risk range. It is designed for traders who value quality over quantity, providing signals only when the market has clear momentum. Key Benefits ✅ Smart Range Filtering: Automatically detects sideways markets and remains silent to protect you from "choppy" price action. ✅ Pure Trend Following: Focuses exclusively on high-probability Buy and Sell entries within established trends. ✅ Noise Reduction: Eliminates false signals by ignoring minor price fluctuations that do not lead to real moves. ✅ Strategic Patience: Encourages disciplined trading by only appearing when the market conditions are optimal. ✅ Universal Application: Optimized for Forex, Crypto, Stocks, and Commodities. General Specifications Product Name: Newton (Powered by AI Exclusive) Trading Style: Trend Following & Momentum Signal Type: Non-Repaint (Signals are fixed once the candle closes) Market Phase Detection: Intelligent Range/Trend differentiation Visual Design: Clean, minimalist interface focused on entry execution Individual Product Presentation: Newton (Trend Master) Overview: An AI-driven indicator that specializes in identifying the "Law of Motion" in the market. It provides Buy/Sell signals only when a trend is confirmed, staying completely inactive during ranging phases to prevent capital erosion. Benefits: Avoids "Death by a Thousand Cuts" in sideways markets. Provides clear, decisive entry points for Buy and Sell orders. Simplifies the chart by removing unnecessary clutter and noise. Features: Proprietary Trend Logic: Analyzes market structure to ensure signals are backed by real volume and momentum. Zero-Signal Range Mode: The indicator remains quiet when the market lacks a clear direction—one of its most powerful features. Visual Precision: High-contrast labels and signals for instant decision-making. Compatibility: Works seamlessly across all timeframes, from 1-minute scalping to weekly swing trading. ⚙️ Installation & Activation Guide Secure Your License Purchase the Newton indicator or the full AI Exclusive Package through our official website. Submit Your TradingView Details After purchase, send your TradingView email address to our support team for authorization. Account Verification Our team will process your request and grant access to the proprietary script. Activation & Use * Open TradingView. Navigate to Indicators → Invite-Only Scripts. Select AI Exclusive: Newton to apply it to your chart. Pro Tip: When Newton is not showing signals, it is a signal in itself—it's telling you to stay on the sidelines and wait for a high-probability breakout.Pine Script®指标由Sanaber998提供6
Manus Forex Alpha Pro Indicator (Trend-Momentum Hybrid)ใช้ AI Manus ช่วยผสมผสานให้ ใช้งานง่ายดี น่าจะไม่ต้องอธิบายนะครับ เพราะเป็นพื้นฐานการใช้งาน เพียงแต่มี แดชบอร์ด ช่วยให้อ่านง่ายขึ้น การลงทุนมีความเสี่ยง ไม่มีเครื่องมือใดคาดการณ์ถูกต้อง 100% เรียนรู้ ฝึกฝน มีวินัย ควบคุมความเสี่ยง ด้วยตนเอง Using AI Manus helps integrate it, making it easy to use. I don't think I need to explain this, as it's basic usage. The dashboard simply makes it easier to read. Investing involves risk; no tool is 100% accurate. Learn, practice, be disciplined, and manage your own risk.Pine Script®指标由kkk_mooy_in_FB提供16
Master Cycle: Quantum Wave# AI Smart Signal: Quantum Wave Edition **The Ultimate Market Co-Pilot: Precision Trend & Momentum Synthesis** The **Quantum Wave** is not just another moving average; it is a sophisticated **Double-Smoothed Heiken Ashi Oscillator** designed to mathematically filter out market noise and visualize the true underlying trend structure. This script combines three powerful engines into one "Master" system: 1. **Quantum Cycle Logic:** A proprietary algorithm that smooths price action to reveal the dominant "Heartbeat" of the market. 2. **Adaptive Momentum Visuals:** Dynamic dot sizing that reacts to volatility expansion and contraction. 3. **Smart Regime Filtering:** An AI-driven filter (ADX & Volatility) that automatically suppresses signals during dangerous "Choppy" or sideways markets. --- ## 🔬 Scientific Methodology ### 1. The Quantum Smoothing Algorithm Most indicators suffer from "Whipsaws" (fake signals) because they react to every candle wick. The Quantum Wave solves this by creating a **Synthetic Price Series**. * **Step 1:** It normalizes Open, High, Low, and Close data. * **Step 2:** It applies a dual-layer Exponential Smoothing filter. * **Result:** A clean, flowing "Ribbon" that ignores noise and only turns when the actual trend structure shifts. ### 2. Dynamic Momentum Sizing (The "Living" Dots) The visual dots on the chart are "alive". They resize in real-time based on the **Body Strength** of the movement: * 🔵 **Small Dots (Weak/Range):** Indicates the market is resting or deciding. *Guidance: STAY OUT / WAIT.* * 🟢 **Medium Dots (Trend):** Indicates a confirmed healthy trend. *Guidance: ENTER / HOLD.* * 🟡 **Large Dots (Power):** Indicates a high-volatility expansion phase. *Guidance: MAX PROFIT POTENTIAL.* --- ## 🛠️ Key Features * **Instruction Overlay:** A built-in Dashboard tells you exactly what to do (BUY, SELL, HOLD, or WAIT) based on complex logic, simplified into one word. * **Auto-Timeframe Detection:** The sensitivity automatically adjusts whether you are scalping (1-min) or Swing Trading (Daily). * **Market Structure Labels:** Automatically identifies Higher Highs (HH) and Lower Lows (LL) to confirm trend direction. * **Demand & Supply Zones:** Auto-plots key reaction levels for Take Profit targets. --- ## 🎯 How to Trade **For a BUY Setup:** 1. **Trend:** Ensure the Quantum Wave (Dots) are **GREEN**. 2. **Momentum:** Look for the dots to grow from Small to Medium. 3. **Confirmation:** Wait for the Dashboard to read "ACTION: BUY". **For a SELL Setup:** 1. **Trend:** Ensure the Quantum Wave (Dots) are **RED**. 2. **Momentum:** Look for the dots to grow from Small to Medium. 3. **Confirmation:** Wait for the Dashboard to read "ACTION: SELL". --- Pine Script®指标由QUANTIVESTA提供已更新 5
OpenAI Signal Generator - Enhanced Accuracy# AI-Powered Trading Signal Generator Guide ## Overview This is an advanced trading signal generator that combines multiple technical indicators using AI-enhanced logic to generate high-accuracy trading signals. The indicator uses a sophisticated combination of RSI, MACD, Bollinger Bands, EMAs, ADX, and volume analysis to provide reliable buy/sell signals with comprehensive market analysis. ## Key Features ### 1. Multi-Indicator Analysis - **RSI (Relative Strength Index)** - Length: 14 periods (default) - Overbought: 70 (default) - Oversold: 30 (default) - Used for identifying overbought/oversold conditions - **MACD (Moving Average Convergence Divergence)** - Fast Length: 12 (default) - Slow Length: 26 (default) - Signal Length: 9 (default) - Identifies trend direction and momentum - **Bollinger Bands** - Length: 20 periods (default) - Multiplier: 2.0 (default) - Measures volatility and potential reversal points - **EMAs (Exponential Moving Averages)** - Fast EMA: 9 periods (default) - Slow EMA: 21 periods (default) - Used for trend confirmation - **ADX (Average Directional Index)** - Length: 14 periods (default) - Threshold: 25 (default) - Measures trend strength - **Volume Analysis** - MA Length: 20 periods (default) - Threshold: 1.5x average (default) - Confirms signal strength ### 2. Advanced Features - **Customizable Signal Frequency** - Daily - Weekly - 4-Hour - Hourly - On Every Close - **Enhanced Filtering** - EMA crossover confirmation - ADX trend strength filter - Volume confirmation - ATR-based volatility filter - **Comprehensive Alert System** - JSON-formatted alerts - Detailed technical analysis - Multiple timeframe analysis - Customizable alert frequency ## How to Use ### 1. Initial Setup 1. Open TradingView and create a new chart 2. Select your preferred trading pair 3. Choose an appropriate timeframe 4. Apply the indicator to your chart ### 2. Configuration #### Basic Settings - **Signal Frequency**: Choose how often signals are generated - Daily: Signals at the start of each day - Weekly: Signals at the start of each week - 4-Hour: Signals every 4 hours - Hourly: Signals every hour - On Every Close: Signals on every candle close - **Enable Signals**: Toggle signal generation on/off - **Include Volume**: Toggle volume analysis on/off #### Technical Parameters ##### RSI Settings - Adjust `rsi_length` (default: 14) - Modify `rsi_overbought` (default: 70) - Modify `rsi_oversold` (default: 30) ##### EMA Settings - Fast EMA Length (default: 9) - Slow EMA Length (default: 21) ##### MACD Settings - Fast Length (default: 12) - Slow Length (default: 26) - Signal Length (default: 9) ##### Bollinger Bands - Length (default: 20) - Multiplier (default: 2.0) ##### Enhanced Filters - ADX Length (default: 14) - ADX Threshold (default: 25) - Volume MA Length (default: 20) - Volume Threshold (default: 1.5) - ATR Length (default: 14) - ATR Multiplier (default: 1.5) ### 3. Signal Interpretation #### Buy Signal Requirements 1. RSI crosses above oversold level (30) 2. Price below lower Bollinger Band 3. MACD histogram increasing 4. Fast EMA above Slow EMA 5. ADX above threshold (25) 6. Volume above threshold (if enabled) 7. Market volatility check (if enabled) #### Sell Signal Requirements 1. RSI crosses below overbought level (70) 2. Price above upper Bollinger Band 3. MACD histogram decreasing 4. Fast EMA below Slow EMA 5. ADX above threshold (25) 6. Volume above threshold (if enabled) 7. Market volatility check (if enabled) ### 4. Visual Indicators #### Chart Elements - **Moving Averages** - SMA (Blue line) - Fast EMA (Yellow line) - Slow EMA (Purple line) - **Bollinger Bands** - Upper Band (Green line) - Middle Band (Orange line) - Lower Band (Green line) - **Signal Markers** - Buy Signals: Green triangles below bars - Sell Signals: Red triangles above bars - **Background Colors** - Light green: Buy signal period - Light red: Sell signal period ### 5. Alert System #### Alert Types 1. **Signal Alerts** - Generated when buy/sell conditions are met - Includes comprehensive technical analysis - JSON-formatted for easy integration 2. **Frequency-Based Alerts** - Daily/Weekly/4-Hour/Hourly/Every Close - Includes current market conditions - Technical indicator values #### Alert Message Format ```json { "symbol": "TICKER", "side": "BUY/SELL/NONE", "rsi": "value", "macd": "value", "signal": "value", "adx": "value", "bb_upper": "value", "bb_middle": "value", "bb_lower": "value", "ema_fast": "value", "ema_slow": "value", "volume": "value", "vol_ma": "value", "atr": "value", "leverage": 10, "stop_loss_percent": 2, "take_profit_percent": 5 } ``` ## Best Practices ### 1. Signal Confirmation - Wait for multiple confirmations - Consider market conditions - Check volume confirmation - Verify trend strength with ADX ### 2. Risk Management - Use appropriate position sizing - Implement stop losses (default 2%) - Set take profit levels (default 5%) - Monitor market volatility ### 3. Optimization - Adjust parameters based on: - Trading pair volatility - Market conditions - Timeframe - Trading style ### 4. Common Mistakes to Avoid 1. Trading without volume confirmation 2. Ignoring ADX trend strength 3. Trading against the trend 4. Not considering market volatility 5. Overtrading on weak signals ## Performance Monitoring Regularly review: 1. Signal accuracy 2. Win rate 3. Average profit per trade 4. False signal frequency 5. Performance in different market conditions ## Disclaimer This indicator is for educational purposes only. Past performance is not indicative of future results. Always use proper risk management and trade responsibly. Trading involves significant risk of loss and is not suitable for all investors.Pine Script®指标由pautue提供44125
AI All Indicator - MFI divergenceDescription English All Indicator — is a professional all‑in‑one TradingView indicator that combines price and RSI divergences, multiple trend and momentum indicators, and a compact, non‑overlapping dashboard. It’s engineered to provide earlier, reliable reversal hints while avoiding label clutter. Key Features Two‑stage alert system: Stage1 gives subtle early hints (momentum flip, hidden divergence, HTF proximity). Stage2 is a confirmed divergence with volume, MFI and ADX confirmations and optional higher‑timeframe verification. Pane separation: Price lines and price divergences remain in the price pane; RSI divergence lines are drawn only in the RSI pane by default — no scaling conflicts. Clutter control: Labels are limited, stacked and auto‑pruned; Stage1 uses a single subtle marker per bar, Stage2 shows clear stacked labels. Multi‑TF confirmation: Optional higher timeframe (e.g., 1h/4h) check for stronger signals. Multiple confirmation filters: Volume spike, MFI divergence, ADX threshold — combine them for higher signal quality. Dashboard and style preserved: Keeps your existing dashboard layout, color presets and label styling — ready to publish. Performance safe: No unsafe history references; arrays used for stacking; label/line limits respected. Why you’ll want it Early signals without noise: Get earlier hints than pure pivot systems, but only act on signals that pass confirmations. Single script, clean separation: One indicator that cleanly separates price overlay and RSI pane — easy to install and publish. Configurable for any trader: Fast, Balanced or Robust modes let you tune sensitivity, volume multiplier and ADX threshold. TradingView‑ready: Clean, commented code, optimized for publishing. Quick publishing notes Suggested title: All Indicator — DB v3.0 (Unified Final) Short listing blurb: All‑in‑one Trend & Divergence Suite: Price & RSI divergences, Multi‑TF confirmation, Stage1/Stage2 Early‑Warning, Dashboard kept. Recommended defaults: Balanced (d_left=5, d_right=2, volume_mult=1.25, adx_threshold=30, max_labels=6). In the description explain Stage1 vs Stage2, how HTF and MFI are used, and note the option to draw RSI lines in the overlay (not recommended). Suggested images for the listing (descriptions only) Overview shot — Price pane above with green/red price divergence lines; RSI pane below showing RSI divergence lines and a compact early‑warning badge. Emphasize clean separation. Feature collage — small tiles: dashboard snapshot, Stage1 subtle marker, Stage2 label with volume spike confirmation, HTF confirmation badge. Annotated demo — chart annotated with arrows and short captions: “Stage1: Early Hint”, “Stage2: Confirmed Divergence”, “MFI + Volume + ADX = Filter”.Pine Script®指标由MacGyver_GER提供1
AI Gold Institutional Scalperworks Best on Gold (xausd/MGC) Built For 1 Minute timeframe Has Smart Trend Engine Liquidity break Detection Volume Confirmatone Atr Dynamic stop TP1 /TP2/ TP3 Pine Script®指标由VenusJ提供已更新 216
AI Pro Scalper work best on gold Build for 1 Minute time frame has smart trent engine Atr Dynamic Stop Tp1/ Tp2/ Tp3 alert ready Pine Script®指标由VenusJ提供37
Custom Asset HUDai generated for your convinience shows you atr ticker stock name earnings report Pine Script®指标由ili800912提供0
AI Heavy Buyer Scanner V6 - 100min to Close100 minutes before the end of daily trading, scan US-traded stocks and ETFs with a market cap > $50B and ETFs (including 3x leveraged). Locate Japanese candlesticks on an intraday chart where the following conditions are met: 1. The price has increased by at least 1% from the daily opening price. 2. The candlestick has a lower shadow that is at least 1% longer than the price. 3. The daily trading volume up to this time is 10% higher than the daily average of the last 100 days. Send an instant alertPine Script®指标由Izik68提供4
Ai Trading Entry ALGO Diamond by KBStill guessing entries? Still buying tops or selling bottoms and watching price move against you immediately? That’s not bad luck — that’s bad timing. And this script is built to fix exactly that. Most traders lose because they don’t know when to enter. They chase candles, rely on lagging indicators, or trade pure emotion. This indicator removes the guesswork by doing the heavy lifting for you — identifying when momentum is real, when volume confirms the move, and when price is actually ready to break or reverse. Built around a proven ATR-based trailing stop, this script first defines market direction, then waits for EMA 9 / EMA 21 trend alignment, volume expansion, and price-based confirmation before printing a signal. No random arrows. No hindsight indicators. No repainting tricks. Just clear, rule-based buy and sell signals designed to keep you on the right side of the move. Fast market drops — like violent NQ and ES opens — don’t get ignored. A built-in strong-move override detects aggressive momentum so you’re not left watching the move after it already happened. With optimized presets for NQ, ES, Gold, and Crypto, this single script adapts across markets and conditions — whether you scalp or trade intraday. The goal is simple: fewer trades, better entries, less emotional damage, and more consistency. If you’re tired of second-guessing every click, sick of entering trades that instantly go red, and ready to stop trading on hope — this is the tool you’ve been missing.Pine Script®指标由keshanbeharry提供7
Ai Trading Entry Buy/Sell indicator - Diamond ALGO by KBStill guessing entries? Tired of clicking buy or sell only to watch price instantly move against you? That’s not bad luck — it’s bad timing. This script fixes that. Most traders lose because they enter too early, chase moves too late, or trade without confirmation. This indicator removes the guesswork by doing the heavy lifting for you — identifying when momentum is real, when volume is backing the move, and when price is actually ready to break. Built around an ATR-based trailing stop, this script defines direction first, then waits for EMA 9 / EMA 21 trend alignment, volume expansion, and breakout confirmation before printing a signal. No random arrows. No lagging nonsense. Just clear, rule-based entries designed to keep you out of chop and on the right side of the move. Fast market drops — like the NQ and ES cash open — don’t get ignored. A strong-move override detects aggressive selling pressure so you’re not left watching the move after it already happened. Optimized presets for NQ, ES, Gold, and Crypto allow this single script to adapt across markets and timeframes. Whether you scalp or trade intraday, the goal is the same: fewer trades, better entries, and less emotional damage to your account. If you’re tired of second-guessing every entry, sick of death-by-a-thousand-small-losses, and ready to trade with structure instead of hope — this is the tool you’ve been missing.Pine Script®指标由keshanbeharry提供13
ES VWAP + GEX OverlayAI v6 ES VWAP + GEX Overlay. The system seems to want me to add more text for description before I know it it works. Pine Script®指标由jdye001提供4
Worldclassedge [Patrick nill]VWAP anchor = input.string("Session", title="Anchor Period") MILLIS_IN_DAY = 86400000 dwmBarTime = timeframe.isdwm ? time : request.security(syminfo.tickerid, "D", time) dwmBarTime := na(dwmBarTime) ? nz(dwmBarTime ) : dwmBarTime var periodStart = time - time makeMondayZero(dayOfWeek) => (dayOfWeek + 5) % 7 isMidnight(t) => hour(t) == 0 and minute(t) == 0 isSameDay(t1, t2) => dayofmonth(t1) == dayofmonth(t2) and month(t1) == month(t2) and year(t1) == year(t2) isOvernight() => not (isMidnight(dwmBarTime) or request.security(syminfo.tickerid, "D", isSameDay(time, time_close), lookahead=barmerge.lookahead_on)) tradingDayStart(t) => timestamp(year(t), month(t), dayofmonth(t), 0, 0) numDaysBetween(t1, t2) => diff = math.abs(tradingDayStart(t1) - tradingDayStart(t2)) diff / MILLIS_IN_DAY tradingDay = isOvernight() ? tradingDayStart(dwmBarTime + MILLIS_IN_DAY) : tradingDayStart(dwmBarTime) isNewPeriod() => var isNew = false if tradingDay != nz(tradingDay ) isNew := switch anchor "Session" => na(tradingDay ) or tradingDay > tradingDay "Week" => makeMondayZero(dayofweek(periodStart)) + numDaysBetween(periodStart, tradingDay) >= 7 "Month" => month(periodStart) != month(tradingDay) or year(periodStart) != year(tradingDay) "Year" => year(periodStart) != year(tradingDay) => false isNewPine Script®指标由AI-user提供1
Worldclassedge [Patrick nill]plotshape(long, title="BUY", text="Long▲", style=shape.labelup, textcolor=color.white, size=size.auto, location=location.belowbar, color=color.green) plotshape(short, title="SELL", text="Short▼", style=shape.labeldown, textcolor=color.white, size=size.auto, location=location.abovebar, color=color.red) alertcondition(long, title="BUY", message="Long▲") alertcondition(short, title="SELL", message="Short▼") // VWAP anchor = input.string("Session", title="Anchor Period") MILLIS_IN_DAY = 86400000 dwmBarTime = timeframe.isdwm ? time : request.security(syminfo.tickerid, "D", time) dwmBarTime := na(dwmBarTime) ? nz(dwmBarTime ) : dwmBarTime var periodStart = time - time makeMondayZero(dayOfWeek) => (dayOfWeek + 5) % 7 isMidnight(t) => hour(t) == 0 and minute(t) == 0 isSameDay(t1, t2) => dayofmonth(t1) == dayofmonth(t2) and month(t1) == month(t2) and year(t1) == year(t2) isOvernight() => not (isMidnight(dwmBarTime) or request.security(syminfo.tickerid, "D", isSameDay(time, time_close), lookahead=barmerge.lookahead_on)) tradingDayStart(t) => timestamp(year(t), month(t), dayofmonth(t), 0, 0) numDaysBetween(t1, t2) => diff = math.abs(tradingDayStart(t1) - tradingDayStart(t2)) diff / MILLIS_IN_DAY tradingDay = isOvernight() ? tradingDayStart(dwmBarTime + MILLIS_IN_DAY) : tradingDayStart(dwmBarTime) isNewPeriod() => var isNew = false if tradingDay != nz(tradingDay ) isNew := switch anchor "Session" => na(tradingDay ) or tradingDay > tradingDay "Week" => makeMondayZero(dayofweek(periodStart)) + numDaysBetween(periodStart, tradingDay) >= 7 "Month" => month(periodStart) != month(tradingDay) or year(periodStart) != year(tradingDay) "Year" => year(periodStart) != year(tradingDay) => false isNew srcVWAP = hlc3 var float sumSrc = 0 var float sumVol = 0 if isNewPeriod() periodStart := tradingDay sumSrc := 0 sumVol := 0 if not na(srcVWAP) and not na(volume) sumSrc += srcVWAP * volume sumVol += volume vwapValue = sumSrc / sumVol plot(vwapValue, title="VWAP", color=color.red, linewidth=3) // = enableCloud = input.bool(false, "Enable Cloud") lenn = input.int(20, "Period") mult = input.float(2.5, "StdDev Multiplier") tc = input.int(25, "Gauge Size", minval=3) upColor = input.color(#00ffbb, "Up Color") downColor = input.color(#ff1100, "Down Color") basis = ta.sma(close, lenn) upper1 = basis + ta.stdev(close, lenn) * mult lower1 = basis - ta.stdev(close, lenn) * mult // TP var int position = 0 if long position := 1 else if short position := -1Pine Script®指标由AI-user提供76
AI Indicator EMA big moveThe Institutional big move+ big move + Target indicator is designed to help trader identify high probabilty breakout,Pine Script®指标由VenusJ提供18
AI Reversal Probability Zones (Dual Mode)This custom-built indicator is designed to detect potential bullish and bearish reversals by aggregating multiple high-probability signals into a unified score. It blends momentum, volatility, trend deviation, and candle structure into a single visual line, enhanced by dynamic color zones that represent the probability and strength of a market reversal.Pine Script®指标由hugoxr27提供32
A+ Algo - DecideAI ALGO SETUP by A+. This Setup helps the Intraday Trader have an Edge in the market.Pine Script®指标由Arpitjain-forex提供2
ai learnerThis is one of the most powerful scripts you can run on this trading view platformPine Script®指标由TaylorBilyeu9提供12
AI Trend Buy & Sell SignalThis is using Candle stick pattern to identify the momentum swift trend movement to give signals the best location for Buy and Sell.Pine Script®指标由adamtan51提供140
SMC + VP Pro with POC Confluence [MR.M] V.2ยำรวมมิตร จาก AI เอาไปใช้กันนะครับ รวยแล้ว กดใจให้ด้วยนะครับ MM ให้ดี ไม่มีเครื่องมือใดชนะ 100 % อย่าขาดทุนนะ 😂😂😂💕💕💕 นี่เป็นการเผยแพร่สคริป ครั้งแรก SMC + VP Pro with POC Confluence + RSI Divergence = Volume Profile (POC, VAH, VAL) + Smart Money Concepts (FVG, OTE, BOS, Liquidity) + POC Confluence Detection (12 zones) + RSI Divergence (Regular + Hidden) + Higher Timeframe Analysis + Trading Signals (Conservative mode) + Risk Management (Auto SL/TP) + Information Dashboard → All-in-One Professional Trading System → Win Rate: 70-90% → Suitable for: Conservative to Balanced traders → Best on: H1, H4 timeframes ถ้ามันรก ก็ปรับเอาเองนะครับ ถ้ามีที่ต้องปรับปรุง แจ้งด้วยนะครับ V.2 ปรับปรุงเพียงเล็กน้อย คือ ปรับ✅ ควรเห็น VAH VAL Label เดียว (ราคาล่าสุด) จากที่ค้างไม่ลบอัตโนมัติ Pine Script®指标由kkk_mooy_in_FB提供256
SMC + VP Pro with POC Confluence [MR.M]ยำรวมมิตร จาก AI เอาไปใช้กันนะครับ รวยแล้ว กดใจให้ด้วยนะครับ MM ให้ดี ไม่มีเครื่องมือใดชนะ 100 % อย่าขาดทุนนะ 😂😂😂💕💕💕 นี่เป็นการเผยแพร่สคริป ครั้งแรก SMC + VP Pro with POC Confluence + RSI Divergence = Volume Profile (POC, VAH, VAL) + Smart Money Concepts (FVG, OTE, BOS, Liquidity) + POC Confluence Detection (12 zones) + RSI Divergence (Regular + Hidden) + Higher Timeframe Analysis + Trading Signals (Conservative mode) + Risk Management (Auto SL/TP) + Information Dashboard → All-in-One Professional Trading System → Win Rate: 70-90% → Suitable for: Conservative to Balanced traders → Best on: H1, H4 timeframes ถ้ามันรก ก็ปรับเอาเองนะครับ ถ้ามีที่ต้องปรับปรุง แจ้งด้วยนะครับ Pine Script®指标由kkk_mooy_in_FB提供60
Ai Kavach by Pooja v16✅ Fakeout Kavach by Pooja — Smart Fake Breakout Protector Fakeout Kavach is designed to help traders understand when a breakout is strong and when it is likely to be a trap. It works as a confirmation and filtering system, giving you a clear view of market strength, momentum, volume pressure, and potential reversal signs — without providing buy/sell recommendations. This is a support tool for traders who want cleaner entries, fewer trap trades, and better clarity in fast-moving markets.This tool adds an intelligent multi-layer confirmation system on your chart so you can quickly understand: ✔ When the breakout is real ✔ When the market has strength ✔ When momentum is fading ✔ And when you should simply avoid the move It doesn’t give buy/sell calls. Instead, it helps you decide “Should I trust this move or not?” ⭐ Core Features (Explained in Simple Language) 🔹 1. Fake Breakout Filter (RSI + MA Logic) Fakeouts often happen when price shows strength but momentum does not. This module checks: RSI strength RSI–MA crossover behaviour Momentum direction Push/rejection zones 📌 Benefit: Quickly see if the breakout has real strength behind it or it’s just a trap candle. 🔹 2. Trend Strength Filter (ADX Protection) Most traders lose money in sideways markets. ADX Filter helps you understand whether the market actually has trend strength or not. 📌 Benefit: Avoid taking trades when the market is weak, choppy, or directionless. Only focus on moves backed by strength. 🔹 3. SB/SS Smart Confirmation SB (Strong Break) and SS (Strong Slide) confirmations highlight alignment between: Momentum Trend Strength RSI structure 📌 Benefit: Cleaner entries, fewer false triggers, and more confidence in the move you take. 🔹 4. Divergence Detection (RSI Based) Catches early signs of: Bullish reversal Bearish reversal Exhaustion at highs/lows 📌 Benefit: Helps you avoid entering at the worst possible points and improves exit timing. 🔹 5. VAD Module (Volume + ATR + Delta Pressure) Fake moves usually have weak volume or no volatility. This module checks: Volume strength Volatility (ATR) Buying/selling pressure (Delta) 📌 Benefit: Helps you understand whether the breakout is backed by real buyer/seller pressure. 🔹 6. Session Protection Opening candles can be noisy and unpredictable. Session block lets you avoid signals during high volatility windows. 📌 Benefit: No more taking wrong entries during the rush at market open. 🔹 7. Fully Modular – Use Only What YOU Need Every feature has its own ON/OFF switch. You can create your perfect setup by enabling only what you prefer. 📌 Benefit: Suitable for scalpers, intraday traders, swing traders, and even beginners. 🎨 Customization Power — Fully Modular Design ✔ Every section of Fakeout Kavach has its own ON/OFF toggle: ✔ Turn RSI visuals on/off ✔ Enable or disable MA & fills ✔ Activate or hide divergences ✔ Use or ignore ADX trend filter ✔ Show or hide SB/SS signals ✔ Enable or disable session block ✔ Choose label style, shapes, colors, sizes ✔ Keep chart clean or run full analysis mode ✔ You decide what appears. ✔ You control the complexity. ✔ One indicator fits all types of traders. 🌍 Works Across All Markets ✔ Stocks ✔ Crypto ✔ Forex ✔ Commodities ✔ Indices All timeframes from scalping to swing trading. ⭐ What This Indicator Helps You With Avoiding trap candles ✔ Understanding when a move is strong or weak ✔ Filtering bad breakouts ✔ Confirming market structure with momentum ✔ Spotting reversal signs early ✔ Building confidence in your entries ✔ Staying out of sideways/no-volume zones 🛠 Support For indicator-related questions, clarification, or feature suggestions, you can contact the creator through TradingView’s comment section or direct message. ⚠ Disclaimer (TradingView Policy Safe) This indicator does not provide buy/sell signals, does not predict market movements, and does not guarantee results or profitability. It is a technical analysis tool intended to assist traders in making their own trading decisions. Always use proper risk management and follow your own trading plan.Pine Script®指标由financegurupooja提供已更新 1111