Pine Script®指标
在脚本中搜索"entry"

Entry / TP / SL Alert Bands (Simple & Stable)
Get an alert before you reach your take profit or stop loss. Set as a percentage over the distance to your stop loss and take profit and improve your Money Management
Pine Script®指标

Raeinex Momentum Liquidity IndexEntry arrow signals with volumetric momentum (buying and selling pressure) and the possibility to use all entry signals as liquidity area for price retest.
Pine Script®指标

ENTRY CONFIRMATION V2An indicator from candle man. Helps determine whether supply and demand zone are truly supply or demand.
Pine Script®指标

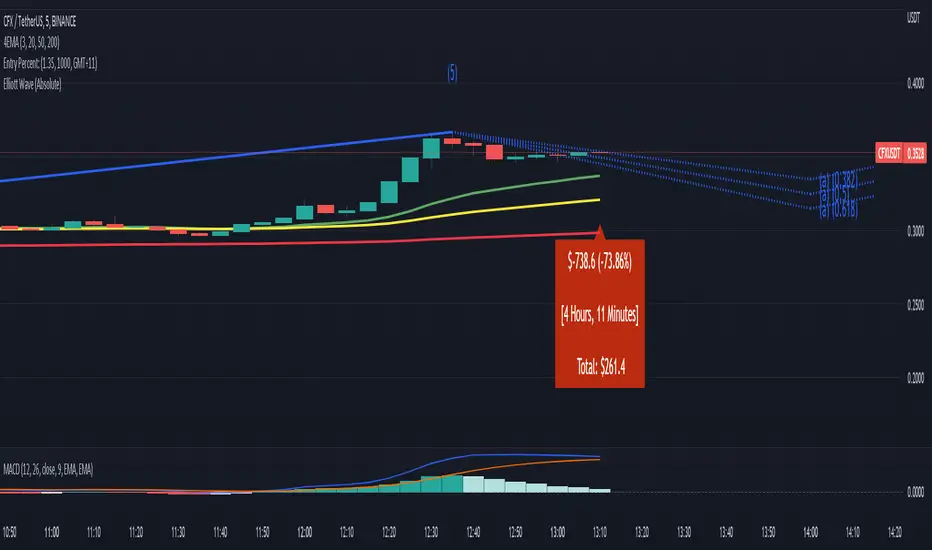
Entry Percent: EssamThis Pine Script code is designed to perform the task of computing and showcasing the profit percentage, profit value, and the duration for which a specific asset is held, all in real-time. The script effectively leverages the built-in resources to provide a seamless and robust experience, as it presents the calculated figures in an easily readable format on the chart, without causing any lag or disruptions to the chart.
Pine Script®指标
Pine Script®指标
[MV] %B with SMA + Volume Based Colored Bars
Entry Signal when %B Crosses with SMA and this is more meaningful if it supports colored bars.
Black Bar when prices go down and volume is bigger than 150% of its average, that indicates us price action is supported by a strong bearish volume
Blue Bar when prices go up and volume bigger than 150% of its average, that indicates us price action is supported by a strong bullish volume
VBC author @KIVANCfr3762
Pine Script®指标

FX Sniper: T3-CCI Strategy - With 100 IndicatorsEntry signal when moving above -100, sell signal when going below 100
Pine Script®指标

Amazing Crossover SystemEntry Rules
BUY when the 5 EMA crosses above the 10 EMA from underneath and the RSI crosses above the 50.0 mark from the bottom.
SELL when the 5 EMA crosses below the 10 EMA from the top and the RSI crosses below the 50.0 mark from the top.
Make sure that the RSI did cross 50.0 from the top or bottom and not just ranging tightly around the level.
How to setup Alert:
1) Add the Amazing Crossover System to your chart via Indicators
2) Find your currency pair
3) Set the timeframe on the chart to 1 hour
4) Press 'Alt + A' (create alert shortcut)
5) Set the following criteria for the alert:
Condition = 'Amazing Crossover System', Plot, ' BUY Signal'
The rest of the alert can be customized to your preferences
5) Repeat steps 1 - 4, but set the Condition = 'Amazing Crossover System', Plot, ' SELL Signal'
Pine Script®指标

Donchian Breakout AI Adaptive Trend
DESCRIPTION:
A self-adapting trend-following indicator that uses K-Means machine learning to analyze 27 Donchian Channel parameter combinations in real-time, identifying which breakout settings perform best in the current market regime.
━━━━━━━━━━━━━━━━━━━
🔍 HOW IT WORKS
The core logic is based on the Donchian Channel breakout — the original trend-following system used by the legendary Turtle Traders. Price breaking above the highest high signals a long, breaking below the lowest low signals a short.
The AI layer runs 27 parameter combinations simultaneously in the background:
• Entry lookback: 10, 20, 30 bars
• Exit lookback: 5, 10, 15 bars
• ATR filter: 1.0x, 1.5x, 2.0x
Each combination is tracked for real-time performance. K-Means clustering (an unsupervised machine learning algorithm) groups these into Best, Average, and Worst performing clusters — and the dashboard tells you what's working best right now.
━━━━━━━━━━━━━━━━━━━
★ HOW TO READ SIGNALS
Signals use a visual agreement system between the base strategy and the AI:
★ Bright + Large label = AI-confirmed signal (confidence ≥ threshold)
○ Dim + Small label = Signal fired but AI confidence is low
The number on each label is the AI confidence score (0-10). Higher = stronger agreement from the AI. You decide: trade all signals, or only the bright AI-confirmed ones.
Entry: Price breaks above the Donchian high (long) or below the Donchian low (short)
Exit: Price breaks the exit channel in the opposite direction, OR the ATR trailing stop is hit (orange step-line on chart)
Trend Filter: EMA(50) prevents counter-trend entries — longs only when price is above the EMA, shorts only when below. The EMA is plotted on chart (green = bullish, red = bearish).
━━━━━━━━━━━━━━━━━━━
📊 HOW TO READ THE DASHBOARD
Signal — Current position state:
★ LONG / ★ SHORT = AI-confirmed trade active
○ LONG / ○ SHORT = Trade active but AI confidence is low (⚠ CAUTION)
— WAITING = No trade, scanning for next breakout
Confidence — Only shown during active trades. A 5-factor composite score:
STRONG (8-10) / HIGH (6-7) / MODERATE (4-5) / LOW (2-3) / WEAK (0-1)
Visual bar: ■■■■■■■□□□ shows the score at a glance
Shows "—" when waiting (no signal to score)
Regime — Current volatility environment based on 20-bar annualized volatility:
LOW VOL = Quiet, fewer breakouts expected
NORMAL = Healthy trending conditions
HIGH VOL = Elevated volatility, wider moves
⚠ EXTREME = Crash/mania conditions
AI Next Entry — The entry lookback (in bars) that the best-performing cluster recommends for the next trade. Example: "20-bar breakout" means the AI thinks 20-bar Donchian highs/lows are optimal right now.
AI Next Exit — The exit lookback the best cluster recommends. Shorter = tighter exits (locks profit faster). Longer = gives trades more room to run.
AI Next Filter — The ATR filter multiplier the best cluster recommends. Higher = only trades strong breakouts. Lower = catches more breakouts including weaker ones.
Best WR — Win rate of the best-performing cluster's simulated trades. Trend-following typically runs 35-50% win rate with large winners compensating for small losses.
Clusters — Distribution of the 27 parameter combos across Best ● Average ● Worst groups. When most combos cluster into "Best," conditions are broadly favorable.
Trend(50) — EMA trend filter direction:
▲ BULLISH / longs only = Price above EMA, only long breakouts allowed
▼ BEARISH / shorts only = Price below EMA, only short breakdowns allowed
━━━━━━━━━━━━━━━━━━━
⚙️ KEY FEATURES
• Non-repainting — All signals use previous-bar confirmed data. Trailing stop updates on bar close only. No signal will appear mid-bar then vanish.
• ATR trailing stop — Locks in profits during extended trends, plotted as orange step-line on chart
• Trend filter — EMA(50) blocks counter-trend entries, preventing long signals during crashes
• ATR breakout filter — Removes weak/noisy breakouts that don't move enough
• Bright/dim visual system — Instantly see which signals the AI agrees with
• 7 alert conditions — Including AI-confirmed entries for selective trading
• Rich tooltips — Hover any signal label for full breakdown (breakout level, confidence, ATR, AI optimal params, cluster win rate)
━━━━━━━━━━━━━━━━━━━
📐 RECOMMENDED SETTINGS
Crypto (BTC, ETH) — 4H or Daily, default settings
Forex — 4H, ATR filter 1.0x for tighter moves
Commodities (Gold, Oil) — Daily, ATR trail 2.5x
Indices (SPY, NAS100) — Daily, trend MA 100
AI Confidence Threshold: Default 5. Raise to 6-7 for fewer but higher-conviction signals. Lower to 3-4 to see more signals.
━━━━━━━━━━━━━━━━━━━
🎓 THE AI EXPLAINED
The "AI" is K-Means clustering — a real unsupervised machine learning algorithm. Here's exactly what it does:
1. Simulates 27 Donchian strategies with different parameters every bar
2. Tracks each one's performance using an EMA-smoothed return metric
3. K-Means groups them into 3 clusters based on performance similarity
4. The best cluster's average parameters become the "AI Next" recommendation
5. Confidence is a 5-factor composite: cluster spread, win rate, breakout strength, trend alignment, and volatility expansion
This means the indicator constantly adapts. In choppy markets, longer lookbacks with stricter filters dominate the best cluster. In trending markets, shorter aggressive breakouts take over. You see this shift in real-time on the dashboard.
━━━━━━━━━━━━━━━━━━━
⚠️ DISCLAIMER
This indicator is a tool for analysis, not financial advice. Past performance does not guarantee future results. Always use proper risk management and position sizing.
━━━━━━━━━━━━━━━━━━━
Happy trading.
Pine Script®指标

Adaptive Trend Sabre [BOSWaves]Adaptive Trend Sabre - Dynamic Trailing Stop System with Tension-Based Support and Resistance Detection
Overview
Adaptive Trend Sabre is a tension-aware trend following system that tracks directional price movement through adaptive trailing stops, where band positioning dynamically adjusts based on price tension relative to the trend baseline and automatically generates support and resistance levels when extreme tension conditions are released.
Instead of relying on fixed trailing stop distances or static support/resistance plotting, trend state, band positioning, and level creation are determined through ATR-normalized tension measurement, elastic snap detection, and dynamic level management that maintains only the most relevant price zones.
This creates dynamic trend boundaries that reflect actual price tension rather than arbitrary technical levels - tightening during low-tension conditions when trend conviction is high, maintaining distance during stretched conditions when directional stress builds, and capturing snap levels at extremes to mark future support and resistance zones where price demonstrated significant elasticity.
Price is therefore evaluated relative to bands that adapt to tension dynamics and historically significant stress-release points rather than conventional fixed-distance trails.
Conceptual Framework
Adaptive Trend Sabre is founded on the principle that meaningful trend signals emerge when price maintains position relative to adaptive trailing stops that adjust based on tension dynamics, while significant support and resistance zones form at locations where extreme price tension is released back toward equilibrium.
Traditional trailing stop methods use fixed ATR multipliers that ignore the underlying tension dynamics and stress accumulation that occur during extended moves. This framework replaces static-distance logic with tension-driven band construction informed by actual price elasticity and snap behavior relative to the trend baseline.
Three core principles guide the design:
Trend direction should be determined by adaptive trailing stop breaches that adjust to maintain optimal distance from the moving average baseline.
Support and resistance levels should form automatically at points where extreme price tension releases, marking zones of proven price elasticity.
Tension measurement reveals whether price is operating within normal bounds or building stress that may lead to reversal or continuation acceleration.
This shifts trend analysis from fixed-distance trailing stops into adaptive, tension-anchored confidence boundaries with intelligent level detection.
Theoretical Foundation
The indicator combines configurable moving average smoothing, Average True Range volatility measurement, tension-based trailing stop logic, and snap-release level detection methodology.
A user-selected MA type (HMA, EMA, SMA, WMA, DEMA, TEMA, VWMA, ALMA, LSMA) provides the trend baseline for directional reference, while ATR offers volatility-normalized scaling for distance calculation and tension measurement. Tension detection identifies when price has stretched beyond threshold distances relative to the baseline, tracking extremes and triggering level creation upon release. The trailing stop advances in favorable trend direction but never retreats, creating a dynamic risk boundary.
Four internal systems operate in tandem:
Trend Baseline Engine : Computes user-selected moving average of price for directional reference and tension calculation anchor point.
Volatility Measurement System : Calculates 14-period ATR to provide adaptive scaling that normalizes distance and tension across varying market conditions.
Adaptive Trailing Logic : Maintains trailing stop at configurable ATR distance from baseline, advancing in trend direction but never reversing until price crosses the trail.
Snap-Level Detection System : Monitors tension thresholds, captures price extremes during stretched conditions, and creates support/resistance lines at release points with automatic extension and break management.
This design allows trend boundaries to reflect actual price behavior dynamics rather than reacting mechanically to fixed distance rules.
How It Works
Adaptive Trend Sabre evaluates price through a sequence of tension-aware processes:
Baseline Calculation : Selected MA type smoothing of close price creates a directional trend reference that filters short-term noise.
ATR Distance Scaling : 14-period ATR calculation multiplied by trail factor determines optimal trailing stop distance from baseline.
Trail Positioning : In bullish trend, trail sits below MA at ATR distance; in bearish trend, trail sits above MA at ATR distance.
Trail Advancement Logic : Bullish trail can only rise (never fall); bearish trail can only fall (never rise), creating unidirectional risk boundary.
Trend State Switches : Price closing below bullish trail triggers bearish state switch; price closing above bearish trail triggers bullish state switch.
Tension Measurement : Distance between close and MA baseline divided by ATR creates normalized tension reading showing price elasticity.
Snap Detection : When absolute tension exceeds snap threshold (default 2.0 ATR), system enters "snapped" state and begins tracking price extremes.
Extreme Capture : During bullish snap (tension > +2.0), highest high is recorded; during bearish snap (tension < -2.0), lowest low is recorded.
Release Identification : When tension returns below half the snap threshold after being snapped, system registers a release event at the captured extreme.
Level Creation : Release of bullish snap creates resistance line at captured high; release of bearish snap creates support line at captured low.
Level Management : Lines extend forward in time and are automatically deleted when price closes beyond buffer distance (0.25 ATR), maintaining only 8 most recent levels.
Retest Detection : Price touching trail or snap levels after cooldown period marks retests, with minimum bar spacing preventing excessive plotting.
Together, these elements form a continuously updating trend framework anchored in tension dynamics and elastic price behavior.
Interpretation
Adaptive Trend Sabre should be interpreted as tension-anchored trend boundaries with automated support/resistance detection:
Bullish Trend State (Green) : Established when price remains above adaptive trailing stop, indicating sustained upward momentum with trail acting as dynamic support.
Bearish Trend State (Red) : Established when price remains below adaptive trailing stop, signaling sustained downward momentum with trail acting as dynamic resistance.
Elastic Cloud : Visual gradient zone displays between MA baseline and trailing stop, with fill intensity reflecting current tension level - lighter when tension is low, darker when tension builds.
Tension Dynamics : High tension (>2.0 ATR) indicates price stretched far from baseline; low tension (<1.0 ATR) indicates price operating near equilibrium.
◆ Buy Signals : Green diamond markers appear when trend state switches from bearish to bullish at trail crossover, indicating momentum shift to upside.
◆ Sell Signals : Red diamond markers appear when trend state switches from bullish to bearish at trail crossunder, signaling momentum shift to downside.
✦ Retest Markers : Small diamonds identify price retouching trail or support/resistance levels during bullish/bearish trends after cooldown period.
Dotted Support Lines (Green) : Horizontal levels created at bearish snap releases, marking zones where price demonstrated extreme downward elasticity.
Dotted Resistance Lines (Red) : Horizontal levels created at bullish snap releases, marking zones where price demonstrated extreme upward elasticity.
Colored Candles : Bar coloring reflects current trend state for immediate visual reference.
Tension measurement, snap behavior, and trail dynamics outweigh isolated price movements.
Signal Logic & Visual Cues
Adaptive Trend Sabre presents three primary interaction signals:
Buy Signal (◆) : Green diamond appears when trend state switches from bearish to bullish via trailing stop crossover, suggesting momentum shift to upside with new dynamic support level established.
Sell Signal (◆) : Red diamond displays when trend state switches from bullish to bearish via trailing stop crossunder, indicating momentum shift to downside with new dynamic resistance level established.
Retest Confirmation (✦) : Small diamonds mark price revisiting trail or snap levels after cooldown period, suggesting trend continuation at established support/resistance zones.
Snap level creation provides automatic support/resistance detection when extreme tension conditions release, marking zones of proven price elasticity without manual drawing.
Alert generation covers trend state switches (bullish/bearish signals) and retest occurrences for systematic monitoring.
Strategy Integration
Adaptive Trend Sabre fits within adaptive trend-following and dynamic support/resistance approaches:
Trail-Based Position Management : Use trailing stop as primary risk boundary - exit long positions when price closes below bullish trail, exit short positions when price closes above bearish trail.
Snap Level Entry Refinement : Enter trends on retest of snap support/resistance levels for lower-risk entry points within established directional moves.
Tension-Aware Sizing : Reduce position sizing during high tension periods (>2.5 ATR) as price operates in stretched conditions with elevated reversal risk.
Multi-Level Zone Analysis : Monitor density of snap levels - clustered support/resistance zones indicate stronger price memory areas warranting attention.
Cloud-Aligned Directional Bias : Favor trades aligning with current trend state color rather than counter-trend positions against the trail.
Retest-Based Re-entry : Use retest signals as continuation confirmation opportunities to add to or re-enter positions within established trends.
Multi-Timeframe Trail Confirmation : Apply higher-timeframe trend state to filter lower-timeframe entry precision, entering only when trails align across timeframes.
Technical Implementation Details
Core Engine : Configurable MA baseline (HMA, EMA, SMA, WMA, DEMA, TEMA, VWMA, ALMA, LSMA) with 14-period ATR volatility measurement
Trail Model : Unidirectional advancing logic with ATR-scaled distance from MA baseline
Tension System : Normalized distance calculation with threshold-based snap detection (default 2.0 ATR)
Level Construction : Extreme capture during snap conditions with release-triggered line creation at high/low points
Level Management : FIFO queue with maximum capacity (default 8 levels), automatic extension, and break-based deletion with buffer zone
Visualization : Gradient-filled elastic cloud with bar coloring, diamond signals, and extended dotted snap levels
Signal Logic : State-switch detection with retest buffer (default 5 bars) and cooldown mechanisms
Performance Profile : Optimized for real-time execution across all timeframes with efficient level management
Optimal Application Parameters
Timeframe Guidance:
1 - 5 min : Micro-trend tracking for scalping with responsive trail distance settings
15 - 60 min : Intraday momentum following with balanced snap threshold characteristics
4H - Daily : Swing-level trend identification with sustained trail protection
Suggested Baseline Configuration:
MA Type : HMA
MA Length : 34
Trail Distance : 3.25 ATR
Snap Threshold : 2.0 ATR
Level Break Buffer : 0.25 ATR
Maximum Levels : 8
Show Retests : Enabled
Retest Cooldown : 5 bars
Bullish Color : Green (#00ff00)
Bearish Color : Red (#ff0000)
These suggested parameters should be used as a baseline; their effectiveness depends on the asset's volatility profile, trending characteristics, and preferred signal frequency, so fine-tuning is expected for optimal performance.
Parameter Calibration Notes
Use the following adjustments to refine behavior without altering the core logic:
Trail too close/loose : Adjust Trail Distance multiplier to modify how far the trailing stop sits from MA baseline - lower values create tighter trails with more frequent switches, higher values create looser trails with greater trend persistence.
Excessive snap levels : Increase Snap Threshold to demand more extreme tension before snap detection activates, reducing level creation frequency.
Missed important levels : Decrease Snap Threshold toward 1.5 ATR to capture less extreme tension releases as support/resistance zones.
Levels breaking too easily : Increase Level Break Buffer to require price to close further beyond snap lines before deletion.
Too many levels cluttering chart : Decrease Maximum Levels to maintain fewer historical snap zones, focusing on most recent tension releases.
Baseline too reactive : Increase MA Length for smoother trend reference that filters more short-term noise, or switch to slower MA types (SMA, ALMA).
Baseline too slow : Decrease MA Length for more responsive trend tracking, or switch to faster MA types (HMA, DEMA, TEMA).
Excessive retest markers : Increase Retest Cooldown to space out retest signals and reduce visual noise.
Adjustments should be incremental and evaluated across multiple session types rather than isolated market conditions.
Performance Characteristics
High Effectiveness:
Trending markets with clear directional persistence and sustained moves away from baseline
Instruments with consistent volatility characteristics where ATR scaling normalizes effectively
Momentum continuation strategies using trail as dynamic support/resistance boundary
Swing trading approaches benefiting from automated snap level detection at tension extremes
Breakout strategies where snap levels mark zones of proven elasticity for retest entries
Reduced Effectiveness:
Choppy, range-bound markets with frequent trail crossovers causing whipsaw signals
Extremely low volatility environments where snap threshold becomes difficult to breach
News-driven or gapped markets with discontinuous price action that bypasses trail logic
High-frequency mean-reversion dominant conditions where price oscillates around MA baseline
Consolidation and sideways price action where trend-following methodologies inherently struggle due to lack of sustained directional movement
Integration Guidelines
Confluence : Combine with BOSWaves structure analysis, volume indicators, or traditional support/resistance zones
Trail Respect : Honor trailing stop as primary risk boundary - close positions when trail is breached regardless of other factors
Level Awareness : Pay attention to snap level clusters as these represent zones of historical price memory and tension release
Tension Monitoring : Track tension readings to identify overextended conditions (>2.5 ATR) warranting profit-taking or position reduction
Retest Utilization : Treat retest signals as continuation confirmation opportunities rather than reversal warnings
State Discipline : Maintain directional bias aligned with current trend state until trail breach occurs
Multi-Timeframe Alignment : Use higher timeframe trend state as filter for lower timeframe entries to ensure confluence across time horizons
Disclaimer
Adaptive Trend Sabre is a professional-grade trend following and dynamic support/resistance detection tool. It uses ATR-normalized trailing stops with tension-based snap level creation but does not predict future price movements. Results depend on market conditions, volatility characteristics, parameter selection, and disciplined execution. BOSWaves recommends deploying this indicator within a broader analytical framework that incorporates price structure, volume context, and comprehensive risk management.
Pine Script®指标

CBC Flip with Targets and Filters [LuxAlgo]The CBC Flip with Targets and Filters indicator provides an institutional framework for identifying high-probability trend reversals based on the Candle By Candle (CBC) method.
By combining structural price action with dynamic ATR targets, stop losses, and intraday value filtering, this tool offers a straightforward strategy for managing risk and executing trades based on shifts in market bias.
🔶 USAGE
The Usage section describes how the script can be used to navigate market trends using price action confirmation and volatility-based levels.
🔹 Signal Identification
Bullish and bearish triangles indicate confirmed trend flips. A bullish flip is detected when price closes above a previous high, while a bearish flip occurs when price closes below a previous low. These signals only appear after the bar closes to ensure non-repainting execution.
🔹 Strategic Filtering
Align signals with intraday value by using the VWAP filter settings:
Confirmation mode: Ensures you only take long signals above the VWAP and short signals below it.
Contrarian mode: Used to identify potential mean-reversion opportunities when price flips against the current value area.
🔹 Risk Management
Every flip generates dynamic target and stop loss lines based on a customizable Average True Range (ATR). The 'Require candle close to stop' feature allows users to choose between a hard touch of the stop level or waiting for a candle close to invalidate the bias.
The script also includes retroactive outcome markers (circles and crosses) that appear on the signal candle to show whether the target or stop was reached first. A lack of symbol by the bullish or bearish triangles means neither the target nor stop loss criteria have been met.
🔹 Performance Verification
Refer to the real-time dashboard to monitor current trade progress and historical hit rates. The Current Target Progress metric in the dashboard tracks how far price moved in the trade direction, helping you optimize your ATR multipliers and assess trend strength.
🔶 DETAILS
🔹 Institutional CBC Logic
The Candle By Candle (CBC) methodology, popularized by maplestax, is a price action-centric approach that ignores minor fluctuations. By requiring a full candle close beyond the previous candle range, the script filters out wick rejections that often lead to false signals in volatile markets.
🔹 Non-Repainting Design
The indicator is designed to be fully non-repainting. Signals and levels are calculated based on closed bars, ensuring that what you see on the chart is consistent with historical performance and real-time execution.
🔶 SETTINGS
🔹 Indicator Settings
Bulls/Bears Color: Customizes the theme for bullish and bearish trend components.
ATR Length: Sets the lookback period for volatility calculations.
Target ATR Multiplier: Defines the distance of the profit target from the entry.
Stop ATR Multiplier: Defines the distance of the stop loss from the entry.
Require candle close to stop: When enabled, the stop loss is only triggered if a candle closes beyond the stop level.
Show Daily Anchored VWAP: Toggles the visibility of the session-anchored VWAP.
Filter Bias by VWAP: Choose between No Filter, Confirmation (Trend-following), or Contrarian (Mean-reversion).
🔹 Visuals
Show Flip Labels: Toggles the entry triangle icons.
Show Outcome Markers: Toggles the retroactive "X" and "Circle" markers on signal candles.
Label Size: Adjusts the size of the on-chart icons.
🔹 Dashboard
Dashboard: Toggles the performance metric table.
Position/Size: Adjusts the UI location and scale.
Historical Trade Count: Sets the sample size for the historical success rate calculation.
Pine Script®指标

Aura Matrix Pro DashboardThe Aura Matrix Pro is a high-precision trend-following system designed to filter out market noise and identify high-probability entries. By combining an advanced Exponential Hull Moving Average (EHMA) with real-time Multi-Timeframe (MTF) analysis, this indicator provides a complete "Control Center" directly on your chart.
Key Features
Dual-Line Confirmation: Uses a thick EHMA (50) for the main trend and a thin HMA (20) for entry confirmation. When price clears both, the trend is confirmed.
Aura Matrix Dashboard: A live monitor of 5m, 15m, 30m, and 1h timeframes.
Momentum Engine: The EHMA changes color (Green/Red) only when trend and price momentum (ROC) align. Gray bars signify "No-Trade" zones.
Volatility Bands (ATM): Integrated ATR channels that show the "stretch" of the market.
Understanding the Dashboard Metrics
1. Trend & Power (1-10)
Trend: Shows the bullish or bearish bias per timeframe.
Power: A custom scale derived from the ADX. A value above 5 indicates a healthy trend. Values 8-10 represent an explosive move.
2. ADX (Trend Strength)
The ADX column is your primary filter for sideways markets:
ADX < 20: The market is ranging. Avoid trend-following trades.
ADX > 25 (Purple): A strong trend is confirmed. This is the "Green Light" for traders.
3. Vol % (Relative Volume) – The "Truth" Filter
This is perhaps the most critical part of the dashboard. It compares current volume to the 20-period average:
Below 100% (e.g., 80%): Weak interest. The move is likely a "fakeout" or lacks institutional backing. Be cautious.
100% - 130%: Healthy volume. The trend is supported by steady participation.
Above 150% (Dark Blue): Institutional Pressure. Big players are moving the market. This is the highest confirmation for any trend breakout.
How to Trade with Aura Matrix Pro
Check the Matrix: Look for at least 3 timeframes to agree (e.g., all Green).
Verify ADX & Volume: Ensure ADX is > 25 and Vol % is > 100%.
The Entry: Wait for the price to be above the Green EHMA and the White HMA line.
The Exit: Exit when the EHMA turns Gray or the Power drops significantly below 4.
Pine Script®指标

Stochastic Momentum Index - SMI | TR🎯 Overview
Stochastic Momentum Index - SMI | TR is a refined momentum oscillator that measures the position of the closing price relative to the midpoint of the recent high-low range. Developed by Tiagorocha1989, this enhanced version of William Blau's Stochastic Momentum Index offers dual-mode operation with moving average customization and comprehensive visual features, helping traders identify momentum shifts, overbought and oversold conditions, and potential reversal points with greater precision than traditional stochastic oscillators.
🔧 How It Works
The Stochastic Momentum Index (SMI) is an evolution of the traditional stochastic oscillator. While standard stochastic measures where price closes within the recent high-low range, the SMI measures where price closes relative to the midpoint of that range, providing a more balanced view of momentum.
Core Calculation Logic:
The indicator calculates the SMI using the standard stochastic formula:
Stochastic = (Current Close - Lowest Low) / (Highest High - Lowest Low) × 100
Where the highest high and lowest low are determined over the specified Length SMI period
The resulting oscillator oscillates between 0 and 100, with:
Readings above 50 indicating price is closing in the upper half of the recent range (bullish momentum)
Readings below 50 indicating price is closing in the lower half of the recent range (bearish momentum)
Readings above 80 suggesting overbought conditions
Readings below 20 suggesting oversold conditions
The indicator compares SMI to a reference line that can be either:
The traditional 50 level (centerline)
A user-defined moving average of the SMI itself (SMI MA mode)
✨ Key Features
🔹 Dual Operating Modes
50 Level Mode: Classic SMI implementation where signals occur when the SMI crosses above or below the 50 centerline, indicating momentum shifts
SMI MA Mode: Enhanced version where signals occur when SMI crosses its own moving average, providing smoother, filtered entries
🔹 Flexible Moving Average Selection
Choose from six MA types for the SMI MA mode:
EMA (Exponential Moving Average) for responsive signals
SMA (Simple Moving Average) for smoother readings
RMA (Rolling Moving Average) for weighted recent data
WMA (Weighted Moving Average) for customizable weighting
VWMA (Volume-Weighted Moving Average) incorporating volume
HMA (Hull Moving Average) for reduced lag
🔹 Customizable SMI Parameters
Length SMI: Lookback period for SMI calculation (default 101)
Source SMI: Price source for calculations (default Close)
🔹 Extended Lookback Period
The default length of 101 makes this version particularly suitable for longer-term trend identification and filtering out short-term market noise.
🔹 Customizable Color Themes
Eight distinct color schemes to match your charting preferences:
Classic – Green for bullish, Red for bearish
Modern – White for bullish, Purple for bearish
Robust – Amber for bullish, Maroon for bearish
Accented – Violet for bullish, Pink for bearish
Monochrome – Light gray for bullish, Dark gray for bearish
Moderate – Green for bullish, Red for bearish
Aqua – Blue for bullish, Orange for bearish
Cosmic – Pink for bullish, Purple for bearish
🔹 Comprehensive Visual Feedback
Colored SMI Line: Changes color based on position relative to the reference line
Signal Line: Yellow line showing 50 or MA reference
Gradient Fill Zones: Clear visualization of overbought (above 80) and oversold (below 20) conditions
Dynamic Zone Fills: Semi-transparent fills showing when SMI is above or below the reference line
Color-Coded Candles: Bars reflect current SMI bias (above or below reference)
Signal Markers: Triangle up/down symbols at crossover points
Live Value Display: Current SMI value shown in a floating label
Trend Table: Bullish/Bearish status displayed on the chart
🔹 Ready-to-Use Alerts
Built-in alert conditions trigger LONG signals on bullish crossovers and SHORT signals on bearish crossunders across both operating modes.
⚙️ Settings Summary
Color Choice: Select from eight visual themes (Default: Classic)
Length SMI: Lookback period for SMI calculation (Default: 101)
Source SMI: Price source for calculations (Default: Close)
Entry/Exit Signal: Choose between 50 level or SMI MA mode (Default: 50)
Length MA: Moving average period for SMI MA mode (Default: 365)
SMI MA Type: Moving average method for signal line (Default: EMA)
📈 Practical Applications
🔹 Overbought/Oversold Detection
Traditional SMI usage identifies extreme conditions:
Readings above 80 suggest overbought conditions and potential reversal down
Readings below 20 suggest oversold conditions and potential reversal up
The indicator provides gradient fills in these zones for visual clarity
The long default period (101) makes these signals more significant and less frequent
🔹 Centerline Crossovers
In 50 Level mode, crossovers provide momentum signals:
Crossover above 50 → Bullish momentum strengthening
Crossunder below 50 → Bearish momentum strengthening
These signals often confirm trend direction changes
🔹 Signal Line Crossovers
In SMI MA mode, crossovers between SMI and its moving average provide filtered signals that reduce whipsaws in ranging markets while maintaining sensitivity in trends.
🔹 Divergence Trading
SMI is excellent for spotting divergences:
Bullish Divergence: Price makes lower low, SMI makes higher low → Potential upside reversal
Bearish Divergence: Price makes higher high, SMI makes lower high → Potential downside reversal
Divergences are most significant when occurring at extreme levels (above 80 or below 20)
🔹 Trend Confirmation
The position of SMI relative to 50 confirms trend direction:
SMI consistently above 50 confirms uptrend
SMI consistently below 50 confirms downtrend
The extended 101-period length ensures these signals reflect meaningful trends
🔹 Momentum Reversal Signals
Watch for SMI turning up from oversold levels or turning down from overbought levels:
Turn up from below 20 → Potential bullish reversal
Turn down from above 80 → Potential bearish reversal
🔹 Multiple Timeframe Analysis
Compare SMI readings across different timeframes:
Higher timeframe SMI confirms primary trend direction
Lower timeframe SMI identifies entry timing and short-term momentum
🎯 Ideal For
✅ Long-Term Traders seeking to identify major trend shifts with reduced noise
✅ Swing Traders wanting to capture medium to long-term momentum shifts
✅ Divergence Traders looking for reliable reversal signals
✅ Position Traders needing confirmation of trend strength and direction
✅ System Developers needing robust, smoothed momentum signals
✅ Trend Followers wanting to avoid false signals in choppy markets
📌 Key Takeaways
Extended Lookback Period: The default length of 101 makes this indicator particularly effective for filtering out short-term noise and identifying significant trend movements
Midpoint Focus: By measuring price relative to the midpoint of the range (rather than just the range extremes), SMI provides a more balanced view of momentum than traditional stochastic
Dual-Mode Flexibility: Choose between classic 50-level crossovers for traditional signals or MA-smoothed signals for filtered entries
Comprehensive Visualization: Color themes, gradient fills for overbought/oversold zones, candles, and labels provide immediate market awareness
Divergence Capability: Excellent for spotting both regular and hidden divergences that signal trend reversals or continuations
Alert-Ready: Built-in alerts for both LONG and SHORT signals across both operating modes
⚠️ Important Notes
The long default length (101) makes this SMI variant much smoother than traditional stochastic settings (typically 14). This reduces false signals but also makes the indicator slower to react to short-term price changes. The 365-day MA default in SMI MA mode is designed for longer-term trend context on daily charts. Readings above 80 and below 20 are significant but may persist during strong trends; consider combining with trend filters. Divergences are most reliable when they occur at extreme readings. Always combine with proper risk management and additional confirmation for best results.
Disclaimer: This indicator is provided for educational and informational purposes only. Past performance is not indicative of future results. Always conduct thorough testing and align with your risk management strategy before live deployment.
Pine Script®指标

Momentum - MOM | TR🎯 Overview
Momentum - MOM | TR is a classic and intuitive momentum oscillator that measures the rate of change in price over a specified period. Developed by Tiagorocha1989, this enhanced version of the traditional Momentum indicator offers dual-mode operation with moving average customization and comprehensive visual features, helping traders identify trend strength, momentum shifts, and potential reversal points with clarity and precision.
🔧 How It Works
The Momentum indicator calculates the absolute difference between the current price and the price from a specified number of periods ago. This simple yet powerful calculation reveals whether prices are accelerating (increasing momentum) or decelerating (decreasing momentum).
Core Calculation Logic:
The indicator calculates Momentum using the standard formula:
Momentum = Current Price - Price n-periods ago
Where n is the user-defined Length MOM
The resulting oscillator fluctuates around zero, with:
Positive Momentum values indicating that prices are higher than they were n-periods ago (upward momentum)
Negative Momentum values indicating that prices are lower than they were n-periods ago (downward momentum)
Zero line representing no net change over the period
The magnitude of the value indicates momentum strength:
Large positive values → Strong upward momentum
Large negative values → Strong downward momentum
Values approaching zero → Weakening momentum or consolidation
The indicator compares Momentum to a reference line that can be either:
The traditional zero level
A user-defined moving average of Momentum itself (MOM MA mode)
✨ Key Features
🔹 Dual Operating Modes
Zero Line Mode: Classic Momentum implementation where signals occur when Momentum crosses above or below the zero line
MOM MA Mode: Enhanced version where signals occur when Momentum crosses its own moving average, providing smoother, filtered entries
🔹 Flexible Moving Average Selection
Choose from six MA types for the MOM MA mode:
EMA (Exponential Moving Average) for responsive signals
SMA (Simple Moving Average) for smoother readings
RMA (Rolling Moving Average) for weighted recent data
WMA (Weighted Moving Average) for customizable weighting
VWMA (Volume-Weighted Moving Average) incorporating volume
HMA (Hull Moving Average) for reduced lag
🔹 Customizable Momentum Parameters
Length MOM: Lookback period for Momentum calculation (default 36)
Source MOM: Price source for calculations (default Close)
🔹 Extended Range Visualization
The indicator includes gradient fills at +/-6000, providing clear visualization of extreme momentum readings regardless of the instrument's price level.
🔹 Customizable Color Themes
Eight distinct color schemes to match your charting preferences:
Classic – Green for bullish, Red for bearish
Modern – White for bullish, Purple for bearish
Robust – Amber for bullish, Maroon for bearish
Accented – Violet for bullish, Pink for bearish
Monochrome – Light gray for bullish, Dark gray for bearish
Moderate – Green for bullish, Red for bearish
Aqua – Blue for bullish, Orange for bearish
Cosmic – Pink for bullish, Purple for bearish
🔹 Comprehensive Visual Feedback
Colored Momentum Line: Changes color based on position relative to the reference line
Signal Line: Yellow line showing zero or MA reference
Gradient Fill Zones: Clear visualization of extreme momentum readings
Dynamic Zone Fills: Semi-transparent fills showing when Momentum is above or below the reference line
Color-Coded Candles: Bars reflect current Momentum bias (above or below reference)
Signal Markers: Triangle up/down symbols at crossover points
Live Value Display: Current Momentum value shown in a floating label
Trend Table: Bullish/Bearish status displayed on the chart
🔹 Ready-to-Use Alerts
Built-in alert conditions trigger LONG signals on bullish crossovers and SHORT signals on bearish crossunders across both operating modes.
⚙️ Settings Summary
Color Choice: Select from eight visual themes (Default: Classic)
Length MOM: Lookback period for Momentum calculation (Default: 36)
Source MOM: Price source for calculations (Default: Close)
Entry/Exit Signal: Choose between zero line or MOM MA mode (Default: Zero Line)
Length MA: Moving average period for MOM MA mode (Default: 365)
MOM MA Type: Moving average method for signal line (Default: EMA)
📈 Practical Applications
🔹 Trend Direction Identification
The Momentum line's position relative to zero indicates trend direction:
Momentum above zero → Bullish trend
Momentum below zero → Bearish trend
The steepness of the slope indicates momentum strength
🔹 Zero Line Crossovers
In Zero Line mode, crossovers provide momentum signals:
Crossover above zero → Bullish momentum strengthening, potential trend reversal up
Crossunder below zero → Bearish momentum strengthening, potential trend reversal down
These are among the simplest and most intuitive trading signals
🔹 Signal Line Crossovers
In MOM MA mode, crossovers between Momentum and its moving average provide filtered signals:
Momentum crosses above its MA → Bullish signal
Momentum crosses below its MA → Bearish signal
These signals reduce whipsaws in choppy markets
🔹 Divergence Trading
Momentum is excellent for spotting divergences:
Bullish Divergence: Price makes lower low, Momentum makes higher low → Potential upside reversal
Bearish Divergence: Price makes higher high, Momentum makes lower high → Potential downside reversal
Divergences are most significant when occurring at extreme levels
🔹 Momentum Confirmation
The slope and magnitude of Momentum confirm trend strength:
Rising Momentum values → Strengthening bullish momentum
Falling Momentum values → Strengthening bearish momentum
Flattening Momentum → Momentum slowing, potential trend change
🔹 Centerline Rejections
When Momentum approaches zero but reverses before crossing, it can signal trend continuation:
Momentum pulls back toward zero but reverses up → Bullish continuation
Momentum rallies toward zero but reverses down → Bearish continuation
🔹 Multiple Timeframe Analysis
Compare Momentum readings across different timeframes:
Higher timeframe Momentum confirms primary trend direction
Lower timeframe Momentum identifies entry timing and short-term momentum shifts
🎯 Ideal For
✅ Trend Traders seeking to confirm trend direction and strength
✅ Momentum Traders wanting to measure the rate of price change
✅ Divergence Traders looking for early reversal signals
✅ Swing Traders capturing medium-term momentum shifts
✅ System Developers needing simple, reliable crossover logic
✅ Beginner Traders starting with one of the most intuitive indicators
📌 Key Takeaways
Simplicity and Intuition: Momentum is one of the most straightforward indicators, measuring exactly what its name suggests
Dual-Mode Flexibility: Choose between classic zero-line crossovers for simplicity or MA-smoothed signals for filtered entries
Unbounded Nature: Unlike RSI or Stochastic, Momentum has no upper or lower limits, making it suitable for strongly trending markets
Comprehensive Visualization: Color themes, gradient fills for extreme readings, candles, and labels provide immediate market awareness
Divergence Capability: Excellent for spotting both regular and hidden divergences
Alert-Ready: Built-in alerts for both LONG and SHORT signals across both operating modes
⚠️ Important Notes
Because Momentum is unbounded, the scale will vary significantly between different instruments and timeframes. The gradient fills at +/-6000 are arbitrary reference points and may not represent actual overbought/oversold conditions for all instruments. The default length of 36 provides a medium-term perspective; shorter lengths (9-14) provide more responsive signals, while longer lengths identify longer-term trends. The 365-day MA default in MOM MA mode is designed for longer-term trend context on daily charts. Divergences are most reliable when they occur after extended trends. Always combine with proper risk management and additional confirmation for best results.
Disclaimer: This indicator is provided for educational and informational purposes only. Past performance is not indicative of future results. Always conduct thorough testing and align with your risk management strategy before live deployment.
Pine Script®指标

TRIX | TR🎯 Overview
TRIX | TR is a sophisticated momentum oscillator that applies triple smoothing to price data to filter out insignificant price movements and identify meaningful trend changes. Developed by Tiagorocha1989, this enhanced version of Jack Hutson's classic TRIX indicator offers dual-mode operation with customizable moving averages and comprehensive visual features, helping traders identify trend direction, momentum shifts, and potential reversal points with reduced noise and greater precision.
🔧 How It Works
The TRIX indicator applies triple exponential smoothing to price data, then calculates the percentage rate of change of this smoothed series. This process eliminates short-term cycles and noise while highlighting the underlying trend and momentum.
Core Calculation Logic:
The indicator follows a multi-step smoothing process:
Logarithmic Transformation: The price source is converted to its natural logarithm (math.log), which helps normalize percentage changes and makes the indicator responsive to proportional price movements.
Triple Smoothing: The log price undergoes three consecutive smoothing operations using a user-selectable moving average:
First smoothing (ma1): Applied to the log price
Second smoothing (ma2): Applied to ma1
Third smoothing (ma3): Applied to ma2
Rate of Change Calculation: TRIX is calculated as the percentage rate of change of the triple-smoothed series:
TRIX = 10000 × (ma3 - ma3 )
The multiplication by 10000 scales the values for better visibility
The resulting oscillator fluctuates around zero, with:
Positive TRIX values indicating upward momentum
Negative TRIX values indicating downward momentum
Zero line crossovers signaling potential trend changes
The indicator compares TRIX to a reference line that can be either:
The traditional zero level
A user-defined moving average of TRIX itself (TRIX MA mode)
✨ Key Features
🔹 Dual Operating Modes
Zero Line Mode: Classic TRIX implementation where signals occur when TRIX crosses above or below the zero line
TRIX MA Mode: Enhanced version where signals occur when TRIX crosses its own moving average, providing smoother, filtered entries
🔹 Flexible Moving Average Selection
Choose from six MA types for both the triple smoothing and the signal line:
EMA (Exponential Moving Average) for responsive signals
SMA (Simple Moving Average) for smoother readings
RMA (Rolling Moving Average) for weighted recent data
WMA (Weighted Moving Average) for customizable weighting
VWMA (Volume-Weighted Moving Average) incorporating volume
HMA (Hull Moving Average) for reduced lag
🔹 Customizable TRIX Parameters
Length TRIX: Lookback period for the moving averages (default 18)
Source TRIX: Price source for calculations (default Close)
MA Type: Moving average method used for all three smoothing steps
🔹 Logarithmic Processing
By applying TRIX to log prices rather than raw prices, the indicator responds proportionally to percentage changes, making it more consistent across different price levels and instruments.
🔹 Customizable Color Themes
Eight distinct color schemes to match your charting preferences:
Classic – Green for bullish, Red for bearish
Modern – White for bullish, Purple for bearish
Robust – Amber for bullish, Maroon for bearish
Accented – Violet for bullish, Pink for bearish
Monochrome – Light gray for bullish, Dark gray for bearish
Moderate – Green for bullish, Red for bearish
Aqua – Blue for bullish, Orange for bearish
Cosmic – Pink for bullish, Purple for bearish
🔹 Comprehensive Visual Feedback
Colored TRIX Line: Changes color based on position relative to the reference line
Signal Line: Yellow line showing zero or MA reference
Gradient Fill Zones: Clear visualization of extreme readings (+100 to -100)
Dynamic Zone Fills: Semi-transparent fills showing when TRIX is above or below the reference line
Color-Coded Candles: Bars reflect current TRIX bias (above or below reference)
Signal Markers: Triangle up/down symbols at crossover points
Live Value Display: Current TRIX value shown in a floating label
Trend Table: Bullish/Bearish status displayed on the chart
🔹 Ready-to-Use Alerts
Built-in alert conditions trigger LONG signals on bullish crossovers and SHORT signals on bearish crossunders across both operating modes.
⚙️ Settings Summary
Color Choice: Select from eight visual themes (Default: Classic)
Length TRIX: Lookback period for the triple smoothing (Default: 18)
Source TRIX: Price source for calculations (Default: Close)
Entry/Exit Signal: Choose between zero line or TRIX MA mode (Default: Zero Line)
MA Type: Moving average method for all smoothing steps (Default: EMA)
Length MA TRIX: Moving average period for TRIX MA mode (Default: 365)
📈 Practical Applications
🔹 Trend Direction Identification
The TRIX line's position relative to zero indicates trend direction:
TRIX above zero → Bullish trend
TRIX below zero → Bearish trend
The steepness of the slope indicates momentum strength
🔹 Zero Line Crossovers
In Zero Line mode, crossovers provide momentum signals:
Crossover above zero → Bullish momentum strengthening, potential trend reversal up
Crossunder below zero → Bearish momentum strengthening, potential trend reversal down
These signals often lead traditional moving average crossovers
🔹 Signal Line Crossovers
In TRIX MA mode, crossovers between TRIX and its moving average provide filtered signals:
TRIX crosses above its MA → Bullish signal
TRIX crosses below its MA → Bearish signal
These signals reduce whipsaws in choppy markets
🔹 Divergence Trading
TRIX is excellent for spotting divergences:
Bullish Divergence: Price makes lower low, TRIX makes higher low → Potential upside reversal
Bearish Divergence: Price makes higher high, TRIX makes lower high → Potential downside reversal
Divergences are most significant when occurring at extreme levels
🔹 Momentum Confirmation
The slope and magnitude of TRIX confirm momentum:
Steeply rising TRIX → Strong bullish momentum
Steeply falling TRIX → Strong bearish momentum
Flattening TRIX → Momentum slowing, potential trend change
🔹 Cycle Identification
The triple smoothing process removes short-term cycles, helping identify medium to longer-term cycles and trends:
Default length 18 is suitable for identifying intermediate-term cycles
Shorter lengths for shorter-term cycles
Longer lengths for major trend identification
🔹 Multiple Timeframe Analysis
Compare TRIX readings across different timeframes:
Higher timeframe TRIX confirms primary trend direction
Lower timeframe TRIX identifies entry timing and short-term momentum
🎯 Ideal For
✅ Trend Traders seeking to identify and follow established trends with reduced noise
✅ Momentum Traders wanting to measure the acceleration of price movements
✅ Divergence Traders looking for early reversal signals
✅ Swing Traders capturing medium-term momentum shifts
✅ Cycle Analysts identifying underlying price cycles
✅ System Developers needing reliable, smoothed momentum signals
📌 Key Takeaways
Triple Smoothing: The three-stage smoothing process eliminates insignificant price movements, revealing the underlying trend
Logarithmic Processing: Using log prices makes TRIX responsive to percentage changes, providing consistency across different price levels
Dual-Mode Flexibility: Choose between classic zero-line crossovers for traditional signals or MA-smoothed signals for filtered entries
Comprehensive Visualization: Color themes, gradient fills for extreme zones, candles, and labels provide immediate market awareness
Divergence Capability: Excellent for spotting both regular and hidden divergences that signal trend reversals or continuations
Alert-Ready: Built-in alerts for both LONG and SHORT signals across both operating modes
⚠️ Important Notes
TRIX is a smoothed indicator, meaning it will be slower to react than single-smoothed oscillators. This makes it better suited for identifying intermediate to longer-term trends rather than short-term entries. The default length of 18 provides a balance between responsiveness and smoothness. The multiplication by 10000 scales the values for better visibility but does not change the signal logic. The 365-day MA default in TRIX MA mode is designed for longer-term trend context on daily charts. Divergences are most reliable when they occur after extended trends. Always combine with proper risk management and additional confirmation for best results.
Disclaimer: This indicator is provided for educational and informational purposes only. Past performance is not indicative of future results. Always conduct thorough testing and align with your risk management strategy before live deployment.
Pine Script®指标

Aroon | TR🎯 Overview
Aroon | TR is a versatile trend-following indicator that measures the time elapsed since price recorded its highest high and lowest low over a specified period. Developed by Tiagorocha1989, this enhanced version of Tushar Chande's classic Aroon indicator offers multiple visualization modes, customizable moving averages, and comprehensive visual features to help traders identify trend direction, trend strength, and potential reversal points with greater precision.
🔧 How It Works
The Aroon indicator consists of two lines: Aroon Up and Aroon Down. These lines measure how many periods have passed since price recorded a high or low within the lookback period. The relationship between these lines determines trend direction and strength.
Core Calculation Logic:
The indicator calculates the Aroon lines using the following logic:
Aroon Up: Measures the number of periods since the highest high within the lookback period
Formula: 100 × (Length - Periods Since Highest High) / Length
Aroon Down: Measures the number of periods since the lowest low within the lookback period
Formula: 100 × (Length - Periods Since Lowest Low) / Length
Both lines oscillate between 0 and 100, with:
Values above 50 indicating a recent high/low (strong trend)
Values approaching 100 indicating a very recent high/low (very strong trend)
Values approaching 0 indicating no recent high/low (weak or reversing trend)
The indicator also calculates Aroon as the difference between Aroon Up and Aroon Down (Aroon Up minus Aroon Down), creating an oscillator that oscillates around zero:
Positive Aroon values → Bullish momentum (Aroon Up above Aroon Down)
Negative Aroon values → Bearish momentum (Aroon Down above Aroon Up)
✨ Key Features
🔹 Multiple Display Modes
Average Aroon Mode: Shows the Aroon oscillator (Aroon Up minus Aroon Down) with signal line, providing a clean, oscillator-style view of trend strength and direction
Normal Aroon Mode: Displays the classic Aroon Up and Aroon Down lines for traditional analysis
Both modes can be combined for comprehensive analysis
🔹 Dual Operating Modes for Signals
Zero Line Mode: Signals occur when the Aroon oscillator crosses above or below the zero line
Aroon MA Mode: Enhanced mode where signals occur when Aroon crosses its own moving average, providing filtered entries
🔹 Flexible Moving Average Selection
Choose from six MA types for the Aroon MA mode:
EMA (Exponential Moving Average) for responsive signals
SMA (Simple Moving Average) for smoother readings
RMA (Rolling Moving Average) for weighted recent data
WMA (Weighted Moving Average) for customizable weighting
VWMA (Volume-Weighted Moving Average) incorporating volume
HMA (Hull Moving Average) for reduced lag
🔹 Customizable Aroon Parameters
Length Aroon: Lookback period for Aroon calculation (default 6)
Shorter periods (like 6) provide more responsive signals
Longer periods (like 14-25) provide smoother, more reliable signals
🔹 Customizable Color Themes
Eight distinct color schemes to match your charting preferences:
Classic – Green for bullish, Red for bearish
Modern – White for bullish, Purple for bearish
Robust – Amber for bullish, Maroon for bearish
Accented – Violet for bullish, Pink for bearish
Monochrome – Light gray for bullish, Dark gray for bearish
Moderate – Green for bullish, Red for bearish
Aqua – Blue for bullish, Orange for bearish
Cosmic – Pink for bullish, Purple for bearish
🔹 Comprehensive Visual Feedback
Aroon Oscillator: Colored line showing the difference between Aroon Up and Aroon Down
Signal Line: Yellow line for MA-based signals
Gradient Fill Zones: Clear visualization of extreme readings (+100 to -100)
Dynamic Zone Fills: Semi-transparent fills showing when Aroon is above or below the signal line
Aroon Up and Aroon Down Lines: Optional display of classic Aroon lines
Color-Coded Candles: Bars reflect current trend direction based on Aroon Up/Aroon Down relationship
Signal Markers: Triangle up/down symbols at crossover points
Live Value Display: Floating labels showing current values for each enabled component
Trend Table: Bullish/Bearish status displayed on the chart
🔹 Ready-to-Use Alerts
Built-in alert conditions trigger LONG signals when Aroon Up crosses above Aroon Down, and SHORT signals when Aroon Up crosses below Aroon Down.
⚙️ Settings Summary
Color Choice: Select from eight visual themes (Default: Classic)
Length Aroon: Lookback period for Aroon calculation (Default: 6)
Average Aroon: Toggle to show the Aroon oscillator (Aroon Up minus Aroon Down) (Default: Enabled)
Aroon: Toggle to show classic Aroon Up and Aroon Down lines (Default: Disabled)
Entry/Exit Signal: Choose between zero line or Aroon MA mode (Default: Zero Line)
Length MA: Moving average period for Aroon MA mode (Default: 365)
Aroon MA Type: Moving average method for signal line (Default: EMA)
📈 Practical Applications
🔹 Trend Direction Identification
The primary use of the Aroon system is identifying trend direction:
Aroon Up above Aroon Down → Bullish trend
Aroon Down above Aroon Up → Bearish trend
The wider the separation, the stronger the trend
🔹 Trend Strength Measurement
The actual values of Aroon Up and Aroon Down indicate trend strength:
Values above 70 → Strong trend (recent high/low)
Values between 50-70 → Moderate trend
Values below 30 → Weak trend or consolidation
Both lines below 50 → Possible ranging market
🔹 Trend Initiation Detection
When Aroon Up crosses above Aroon Down from below, it suggests a new uptrend is beginning. Conversely, when Aroon Down crosses above Aroon Up, it suggests a new downtrend is beginning.
🔹 Trend Exhaustion Signals
When Aroon Up is very high (above 80-90) and begins to turn down while Aroon Down remains low, it may indicate an uptrend is tiring. The opposite signals downtrend exhaustion.
🔹 Consolidation Identification
When both Aroon lines are low (below 30-40) and moving horizontally, it suggests a consolidation phase with no clear trend.
🔹 Aroon Oscillator Analysis
The Aroon oscillator (Aroon Up minus Aroon Down) offers additional insights:
Positive values indicate bullish dominance
Negative values indicate bearish dominance
Crossovers of the zero line confirm trend changes
Crossovers of the moving average provide filtered signals
🔹 Multiple Timeframe Confirmation
Compare Aroon readings across different timeframes:
Higher timeframe Aroon confirms primary trend direction
Lower timeframe Aroon identifies entry timing
🎯 Ideal For
✅ Trend Traders seeking early identification of new trends
✅ Swing Traders wanting to capture trend initiations and reversals
✅ Range-Bound Traders identifying consolidation phases
✅ System Developers needing reliable trend direction signals
✅ Multi-Timeframe Analysts comparing trend strength across periods
📌 Key Takeaways
Time-Based Approach: Unlike most indicators that use price or volume, Aroon uniquely measures time since significant highs and lows
Multiple Display Modes: Choose between classic Aroon Up/Down lines or the Aroon oscillator based on your analysis style
Dual-Mode Signal Generation: Zero line crossovers for classic signals or MA-smoothed signals for filtered entries
Rich Visual Feedback: Color themes, gradient fills, candles, and floating labels provide immediate market awareness
Alert-Ready: Built-in alerts for trend change signals when Aroon Up crosses Aroon Down
⚠️ Important Notes
The Aroon indicator works best in trending markets and can produce false signals in ranging conditions. The default length of 6 makes this version very responsive to recent price action, ideal for shorter-term trading. For longer-term analysis, consider increasing the length to 14-25. The 365-day MA default in Aroon MA mode is designed for longer-term trend context on daily charts. Both lines below 50 often indicate consolidation - consider avoiding trend signals in these conditions. Always combine with proper risk management and additional confirmation for best results.
Disclaimer: This indicator is provided for educational and informational purposes only. Past performance is not indicative of future results. Always conduct thorough testing and align with your risk management strategy before live deployment.
Pine Script®指标

Aura V14 Bolt -TPSLAura V14 - TPSL is a comprehensive trend-following indicator designed to provide high-precision entry and exit points with integrated risk management levels. By combining ATR volatility, Money Flow Index (MFI) dynamics, and CCI momentum, this script filters out market noise and identifies the true direction of the trend.
Core Functionality:
Trend Identification: Features an advanced trend-calculation algorithm that changes bar colors and background shading for instant visual confirmation.
Automated Trade Levels: Upon every new BUY/SELL signal, the indicator automatically projects the following levels on your chart:
Entry Price (EP): Marked with a dashed blue line.
3 Take Profit Levels (TP1, TP2, TP3): Volatility-based profit targets.
Stop Loss (SL): Dynamic capital protection level.
Optimized Usage & Recommendations:
Best Performance: For Day Trading, the 15-minute (15m) timeframe offers the most consistent results.
Long-Term Strategy: For swing trading or more stable long-term trends, the following "Golden Settings" are recommended:
ATR Multiplier (ATM): 5
Multiplier: 5
Alpha Period (A): 14
ATR Period (ALP): 1
Magic Period: 20
Pine Script®指标

Trend Pressure Prism [LuxAlgo]The Trend Pressure Prism indicator is a comprehensive trend-analysis tool that synthesizes momentum, market structure, and pullback quality into a single composite oscillator to identify high-conviction trading opportunities.
🔶 USAGE
The indicator operates as a "prism," refracting price action through three distinct lenses to determine the total pressure behind a market move. Users can monitor the central ribbon to gauge trend strength and the "Agreement" metric to identify how unified the underlying forces are.
🔹 Trend States & Conviction
The oscillator fluctuates between -100 and 100. When the ribbon enters the "Extreme Zones" (above 80 or below -80), the background glows, signaling a period of high conviction.
Bullish Conviction: High positive pressure with unified agreement among the three pillars.
Bearish Conviction: High negative pressure with unified agreement among the three pillars.
Exhaustion: Occurs when the pressure score remains high but agreement drops below 50%, suggesting a potential reversal or thinning liquidity.
🔹 Filtered Crossover signals
The indicator includes a Signal Line (EMA) that generates entry and exit cues. To ensure only high-quality opportunities are highlighted, signals are filtered by primary conditions:
Relative Volume (RVOL): Ensures the move is backed by institutional participation.
Agreement Filter: Requires a minimum level of harmony between momentum and structure.
Dynamic Sizing: Signals are plotted as circles on the ribbon. Their size and opacity scale based on volume—larger, solid circles represent high-volume breakouts, while smaller circles indicate standard filtered moves.
🔶 DETAILS
The script is built upon three core components that form the Composite Pressure Score:
Momentum Drive: Measures the aggression of price movement using a normalized Rate of Change.
Structural Alignment: Analyzes price position relative to fast and slow EMAs to ensure the trend has structural support.
Pullback Quality: Evaluates the health of retracements by analyzing where price sits within its recent range.
The Agreement metric calculates the mathematical harmony between these three components. High agreement suggests a "perfect storm" where all three factors point in the same direction, increasing the probability of a sustained move.
🔹 Dashboard Information
The on-screen dashboard provides a real-time summary of the market's technical state:
Current State: Identifies the market regime, such as "Bullish/Bearish Conviction," "Exhaustion" (divergent forces), or "Glass / Neutral" (low-conviction environments).
Action: Provides a suggested context based on the prism's logic. This includes "Bullish/Bearish Cross" for potential entries, "Hold" for trending environments with high agreement, and "Wait" for low-conviction periods.
Pressure Score: The numerical value of the composite oscillator (-100 to 100).
Agreement: A percentage representing how unified the three internal forces are. Higher percentages indicate stronger confluence.
🔶 SETTINGS
🔹 Calculation Settings
Lookback Period: Determines the window used for momentum, structure, and range calculations.
Prism Sensitivity: Controls how reactive the normalized scores are to price changes.
Min Signal RVOL: The volume threshold required to trigger a signal circle (e.g., 1.2 requires 20% above average volume).
Min Signal Agreement: The required harmony between the 3 pillars (0.0 to 1.0) for a signal to appear.
🔹 Visual Settings
Prism Opacity: Adjusts the transparency of the central ribbon and conviction glows.
Enable Dashboard: Toggles the on-screen information panel.
Position/Size: Controls the placement and scale of the dashboard UI.
Pine Script®指标

Rolling Correlation & Breakdown Detector [LuxAlgo]The Rolling Correlation & Breakdown Detector indicator is a specialized "trust meter" designed for statistical arbitrage and pairs trading that monitors the stability of the relationship between two assets to identify when mean-reversion strategies are likely to fail.
🔶 USAGE
This indicator functions as a decision filter rather than a standalone entry signal generator. It is intended to be used alongside spread indicators or Z-score models to determine if the underlying relationship between two assets is healthy enough to trade.
The script monitors two primary factors: the raw Pearson correlation and the stability of that correlation. This helps traders avoid the "divergence trap," where a price gap looks like a mean-reversion opportunity, but the assets have actually undergone a structural regime shift.
🔹 The Three-State System
The indicator categorizes the relationship into three distinct regimes:
Healthy (Green): The correlation is high and stable. This is the optimal environment for statistical arbitrage trades.
Warning (Orange): The correlation is weakening or becoming volatile. New trades should be approached with caution, and existing positions should be managed tightly.
Breakdown (Red): The assets have "divorced." The correlation has collapsed or is moving erratically. In this state, mean-reversion signals should be ignored as the assets are no longer moving in tandem.
🔹 Statistical Arbitrage Filtering
Valid Trade: Your spread indicator shows an extreme (e.g., Z-Score > 2) AND the detector is Green.
Invalid Trade: Your spread indicator shows an extreme, but the detector is Red. This suggests a "regime shift" where one asset is repricing independently of the other.
🔶 DETAILS
While most traders only look at the absolute correlation value, this indicator introduces the concept of Correlation Stability. A pair with a lower but stable correlation is often more tradable than a pair with high correlation that is rapidly collapsing.
The script calculates the standard deviation of the correlation over a "Stability Window." If the correlation fluctuates wildly, the stability metric will spike, triggering a Warning or Breakdown state even if the raw correlation value remains relatively high. This acts as a "circuit breaker" to protect traders from macro-driven divergences or structural news events.
🔶 SETTINGS
🔹 General Settings
Asset B: The secondary symbol you wish to compare against the current chart symbol.
Correlation Length: The rolling lookback window used for the Pearson correlation calculation.
Stability Window: The window used to measure the volatility (standard deviation) of the correlation.
🔹 Breakdown Detection Thresholds
Healthy Threshold: The minimum correlation value required to be considered in a "Healthy" state.
Breakdown Threshold: The level below which the relationship is considered "Broken."
Stability Threshold: The maximum allowed volatility in the correlation before the state shifts to a Warning or Breakdown.
🔹 Dashboard
* Dashboard: Toggles the visibility of the real-time information table.
* Position/Size: Customizes the location and scale of the on-screen dashboard.
Pine Script®指标

3 Linear Regression Channels with AlertsHello
With this indicator, you will be able to see the direction of short, medium, and long-term movements using linear regression channels and Fibonacci numbers. You will also be able to identify entry and exit levels for trades using channel support and resistance levels and channel intersections.
Happy trading!
Pine Script®指标

ROC(2) Pivot (Linda Raschke)A daily bias level based on Linda Bradford Raschke's adaptation of the Taylor Trading Technique. The indicator plots a single price level — the point where the 2-period rate of change flips sign — and colors it by the current bias direction.
Concept
George Douglas Taylor observed in the 1950s that markets tend to swing in 2–3 day cycles: a buy day, a sell day, a sell-short day. Raschke formalized this with a simple calculation that captures where short-term momentum shifts.
The pivot is known before the session opens because it uses only prior daily closes:
Pivot = (Yesterday's Close − Close 3 days ago) + Close 2 days ago
Price above the pivot → long bias. Price below → short bias. One number, one rule.
Features
- Pivot line with bias-colored shading (long/short fill between price and pivot)
- Info table showing current bias, pivot price, streak, and respect score
- Streak — how many consecutive days the bias has held the same direction.
- Respect score — over the last N completed sessions, how many times did price stay entirely on one side of the pivot vs. crossing through it? Higher respect = the pivot is acting as meaningful support/resistance
- Alerts for bias flips (price crossing the pivot)
- Configurable colors, line width, fill transparency, table position/size, dark/light theme
How to use it
Check the pivot before the session. If price is above, favor long setups. If below, favor short setups. Use your own entry signals — the pivot provides directional context, not entries.
The respect score helps gauge conviction: if the pivot has been respected 7+ out of 10 sessions, traders are treating that level seriously. If only 3–4, the market is chopping through it and the bias carries less weight.
Non-repainting behavior
The pivot line itself does not repaint — it is calculated entirely from prior daily closes and is fixed at the open. The streak and respect scores use only completed daily bars (no intraday repainting). The real-time bias (line color, fill, table) updates as price crosses the pivot during the session, which is intended behavior — it reflects the current state, not a prediction.
Credits
Based on the 2-Period Rate of Change concept from Linda Bradford Raschke (Street Smarts, Chapter 8) and George Douglas Taylor's Taylor Trading Technique (1950).
This indicator is a visualization and context tool — it does not generate buy/sell signals and is not a standalone trading system.
Pine Script®指标

Multi-Timeframe Quad EMAMulti-Timeframe Quad EMA Indicator (built based on standard tradingview ema calculation)
Overview
The Multi-Timeframe Quad EMA is a sophisticated technical analysis tool that displays up to four Exponential Moving Averages (EMAs) on your chart, with the ability to source each from different timeframes. This versatile indicator allows traders to visualize multiple moving averages simultaneously, offering a comprehensive view of price trends across various time periods.
Key Features
Multi-Timeframe Analysis
Each EMA can be configured to display data from any timeframe
Allows for comparing short-term and long-term trends on a single chart
Provides cross-timeframe insights without switching between chart periods
Customizable Visualization
Four independent EMAs, each individually configurable
Toggle any EMA on or off based on your analysis needs
Color customization for each EMA line
Adjustable line thickness for visual emphasis
Optional display offset for each EMA
Visual Smoothing
Optional smoothing feature for cleaner visual representation
Multiple smoothing methods: SMA, EMA, WMA, and RMA
Adjustable smoothing length to control the degree of smoothing
Smoothing affects only the display, not the underlying calculations
Information Display
On-chart information table showing EMA parameters
Customizable table position (choose any corner of the chart)
Optional value display showing current EMA values
Clear indication of timeframe and calculation length for each EMA
Use Cases
Trend Identification
Multiple EMAs help identify the current market trend direction
Shorter EMAs show immediate price action, longer EMAs show overall trend
EMA crossovers can signal potential trend changes
Multi-Timeframe Strategy Development
Compare how trends appear across different timeframes
Identify potential entry and exit points based on multiple timeframe analysis
Develop strategies that consider both short-term and long-term market conditions
Support and Resistance Levels
EMAs often act as dynamic support and resistance levels
Multiple EMAs provide several potential support/resistance zones
Price interaction with these levels can signal potential reversals or continuations
Market Structure Analysis
The relationship between different period EMAs helps understand market structure
EMA alignments can indicate trend strength or weakness
Divergences between EMAs may signal potential trend changes
Technical Details
Calculation Methods
Uses true EMAs with proper calculation methods
Option to apply visual smoothing for display purposes only
Multi-timeframe data properly synced using secure request methods
Performance Considerations
Optimized for efficient chart rendering
Dynamic table creation only when needed
Minimal resource usage even with all features enabled
Pine Script®指标
