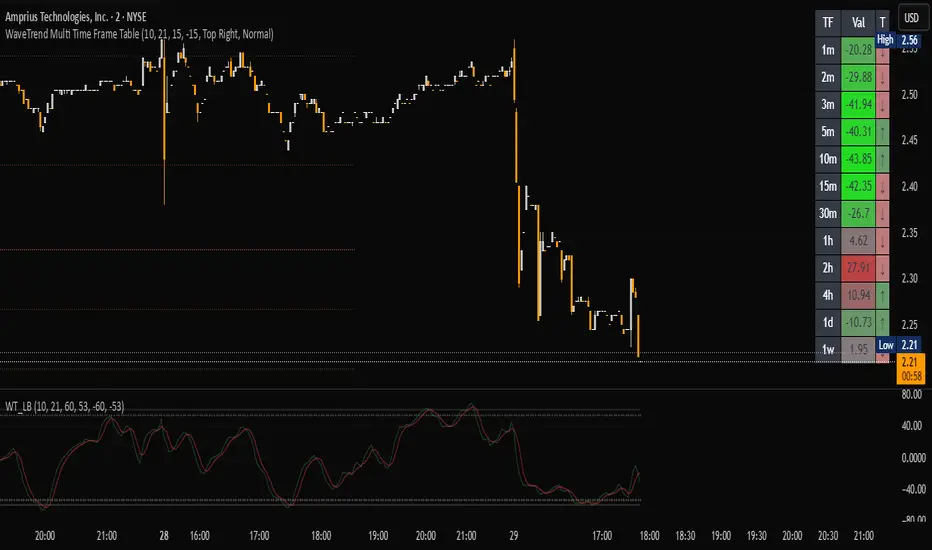
WaveTrend Matrix (1m-1w) – Custom ThresholdsA visual control panel for momentum exhaustion across ten key time-frames.
—
🧬 DNA
This is a fork of LazyBear’s original WaveTrend Oscillator .
The oscillator logic is 100 % intact; I simply stream the values into a compact table so that day- and swing-traders can see the “bigger picture” at a glance.
📈 What does it do?
Calculates WaveTrend on ten granularities: 1m, 3m, 5m, 15m, 30m, 1h, 2h, 4h, 1d, 1w.
Displays the current oscillator print in a color-coded matrix.
• Red = overbought (≥ high threshold)
• Green = oversold (≤ low threshold)
• Gray = neutral / in-range
All thresholds are user-adjustable.
Built on Pine v5, zero repainting, works on any symbol.
🛠 Parameters
Channel Length – WT “n1” (default 10)
Average Length – WT “n2” (default 21)
Red from – overbought cut-off (default +60)
Green under – oversold cut-off (default –60)
🚀 How to use it
1. Apply the indicator to your chart – no extra setup required.
2. Read the matrix top-down before every entry:
• Multiple deep-green rows → market broadly oversold → watch for longs.
• Multiple deep-red rows → market broadly overbought → watch for shorts or stay flat.
3. Combine with your trend filter (EMA-stack, VWAP, structure) to avoid counter-trend trades.
Pine Script®指标