ICT & SMC Multi-Timeframe by [KhedrFX]Transform your trading experience with the ICT & SMC Multi-Timeframe by indicator. This innovative tool is designed for traders who want to harness the power of multi-timeframe analysis, enabling them to make informed trading decisions based on key market insights. By integrating concepts from the Inner Circle Trader (ICT) and Smart Money Concepts (SMC), this indicator provides a comprehensive view of market dynamics, helping you identify potential trading opportunities with precision.
Key Features
- Multi-Timeframe Analysis: Effortlessly switch between various timeframes (5 minutes, 15 minutes, 30 minutes, 1 hour, 4 hours, daily, and weekly) to capture the full spectrum of market movements.
- High and Low Levels: Automatically calculates and displays the highest and lowest price levels over the last 20 bars, highlighting critical support and resistance zones.
- Market Structure Visualization: Identifies the last swing high and swing low, allowing you to recognize current market trends and potential reversal points.
- Order Block Detection: Detects significant order blocks, pinpointing areas of strong buying or selling pressure that can indicate potential market reversals.
- Custom Alerts: Set alerts for when the price crosses above or below identified order block levels, enabling you to act swiftly on trading opportunities.
How to Use the Indicator
1. Add the Indicator to Your Chart
- Open TradingView.
- Click on the "Indicators" button at the top of the screen.
- Search for "ICT & SMC Multi-Timeframe by " in the search bar.
- Click on the indicator to add it to your chart.
2. Select Your Timeframe
- Use the dropdown menu to choose your preferred timeframe (5, 15, 30, 60, 240, D, W) for analysis.
3. Interpret the Signals
- High Level (Green Line): Represents the highest price level over the last 20 bars, acting as a potential resistance level.
- Low Level (Red Line): Represents the lowest price level over the last 20 bars, acting as a potential support level.
- Last Swing High (Blue Cross): Indicates the most recent significant high, useful for identifying potential reversal points.
- Last Swing Low (Orange Cross): Indicates the most recent significant low, providing insight into market structure.
- Order Block High (Purple Line): Marks the upper boundary of a detected order block, suggesting potential selling pressure.
- Order Block Low (Yellow Line): Marks the lower boundary of a detected order block, indicating potential buying pressure.
4. Set Alerts
- Utilize the alert conditions to receive notifications when the price crosses above or below the order block levels, allowing you to stay informed about potential trading opportunities.
5. Implement Risk Management
- Always use proper risk management techniques. Consider setting stop-loss orders based on the identified swing highs and lows or the order block levels to protect your capital.
Conclusion
The ICT & SMC Multi-Timeframe by indicator is an essential tool for traders looking to enhance their market analysis and decision-making process. By leveraging multi-timeframe insights, market structure visualization, and order block detection, you can navigate the complexities of the market with confidence. Start using this powerful indicator today and take your trading to the next level.
⚠️ Trade Responsibly
This tool helps you analyze the market, but it’s not a guarantee of profits. Always do your own research, manage risk, and trade with caution.
在脚本中搜索"ict"

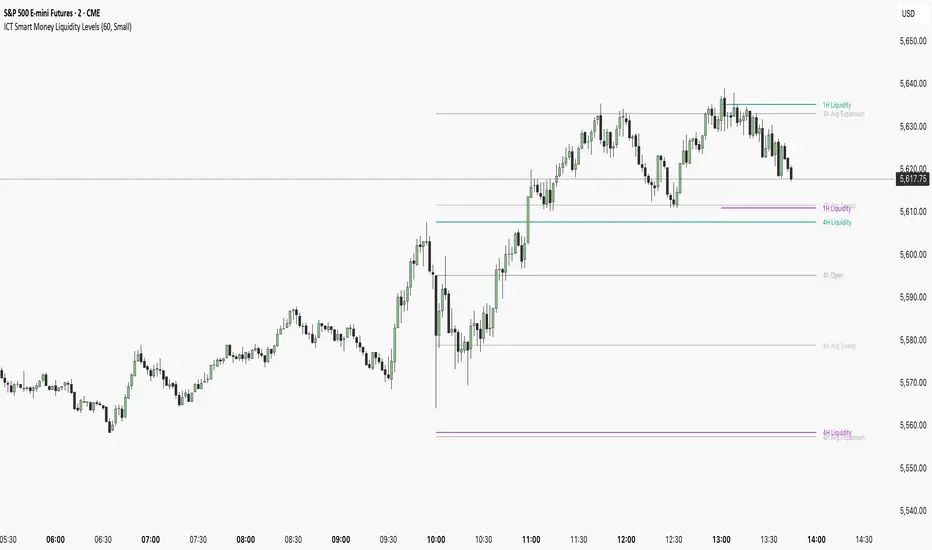
ICT Smart Money Liquidity LevelsThe ICT Smart Money Liquidity Levels indicator is designed to visualize key liquidity areas across multiple timeframes. Based on ICT concepts, this tool can help traders analyze price movement, liquidity sweeps, and expansion levels without switching between timeframes.
This indicator highlights liquidity levels at significant highs and lows, allowing users to track potential areas of interest where price may react. By also incorporating historical measurements, it also provides forecasted average sweep and expansion zones.
Features:
- Liquidity Levels
Plots previous HTF candle highs and lows. Available for 1H, 4H, Daily.
- Major Liquidity Levels
Highlights areas where price previously reached a significant high or low within 10 HTF candles. Available for 1H, 4H, Daily.
- Sweep and Expansion Forecast
Uses historical price data to forecast the average sweep and expansion levels for the next HTF candle. Available for 4H, Daily, Weekly, Monthly.
Why Is This Indicator Useful?
Based on ICT concepts, price seeks liquidity, often targeting trapped stops above highs and below lows before reversing or continuing its trend. High-timeframe (HTF) highs and lows, such as 1H, 4H, and Daily liquidity levels, act as natural draw points where price is likely to react. These levels represent areas where stop hunts, liquidity grabs, and institutional order flow often take place. By marking these zones, traders can anticipate where price may seek liquidity before making a significant move.
Additionally, historical liquidity sweeps and expansion zones provide insight into how price has behaved in similar situations in the past. According to ICT methodology, price often manipulates liquidity before expanding in the intended direction. By tracking average sweep and expansion levels, traders can forecast potential price movement, aligning their entries with areas where liquidity has historically been taken or distributed.
Disclaimer:
This indicator is for informational and educational purposes only. It does not provide financial, investment, or trading advice. No guarantees are made regarding accuracy, completeness, or profitability. Trading involves risk, and past performance does not indicate future results. Users are solely responsible for their trading decisions. By using this indicator, you acknowledge that the creator is not liable for any financial losses or decisions based on the information provided.
More Examples:
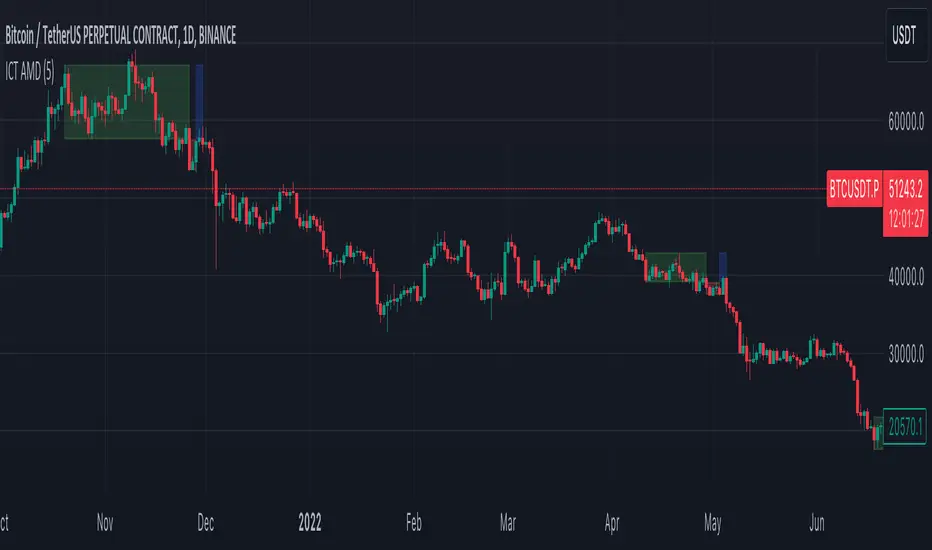
ICT AMDWhat the indicator does
This indicator, named "ICT AMD indicator", is designed for traders who follow the ICT (Inner Circle Trader) theory, focusing on identifying and visualizing phases of market structure related to Accumulation, Manipulation, and Distribution. These phases are crucial for understanding the market's direction and potential turning points. The indicator:
Draws boxes on the chart to represent Accumulation, Manipulation, and Distribution areas, providing a visual representation of these key market phases.
Highlights areas where the market is likely accumulating assets before a big move, manipulating prices to trigger retail stop losses, and distributing assets after a significant price move.
How the indicator does it
The indicator implements its functionality through a series of calculated steps and conditions:
Utilizes pivot points to identify potential swing highs and lows within the market, which serve as the basis for determining the phases of Accumulation, Manipulation, and Distribution.
Allows users to customize the pivot range and whether to include wicks in the pivot calculation, giving flexibility in identifying swing points based on personal trading style or strategy.
Creates visual boxes on the chart where these phases are identified:
Accumulation boxes are drawn when the market is perceived to be gathering assets, indicated by a specific price behavior around swing lows.
Manipulation boxes appear around price levels where the market is likely pushing beyond key accumulation or distribution zones, possibly to trigger stop-loss orders.
Distribution boxes are established following the manipulation phase, indicating areas where the market is offloading assets post-accumulation.
Adjusts the right edge of these boxes as new price information becomes available, ensuring they remain relevant and accurate to current market conditions.
Employs color coding (green for Accumulation, red for Manipulation, and blue for Distribution) to make the distinction between different market phases clear and intuitive.
How traders can use it
Traders can leverage the "ICT AMD indicator" to enhance their market analysis and decision-making process:
Identify potential entry and exit points by observing the transitions between Accumulation, Manipulation, and Distribution phases.
Adjust their risk management strategies based on the identification of Manipulation areas, which could indicate areas of high stop-loss activity.
Use the Accumulation and Distribution boxes to gauge the strength of a trend or potential reversal points, as these areas often precede significant market moves.
Incorporate the indicator's insights with other analysis tools or indicators to confirm trade hypotheses or to refine entry and exit strategies.
Apply the visual cues provided by the indicator to anticipate market moves based on historical patterns of Accumulation, Manipulation, and Distribution, aligning their trading strategies with the inferred market psychology.
By understanding and utilizing the visual and analytical insights provided by the "ICT AMD indicator", traders can potentially improve their trading outcomes by aligning their strategies with the underlying market dynamics it reveals.
ICT订单块交易【实时不滞后】Used to identify "Order Blocks" (OB), based on Break of Structure (BOS) and Retest mechanisms. It detects candles in the opposite direction after swing highs/lows to form potential supply/demand zones, confirming and plotting valid OBs only upon price retest. The indicator emphasizes "real" OBs: requiring a strong impulse (> ATR * multiplier) and retest verification.
- **Core Functions**: Detect BOS (Break of Structure); find opposite candles after prior impulses; verify strength and retest; draw OB boxes and labels.
- **Applicable Scenarios**: Suitable for ICT strategies, supply-demand trading, or reversal identification. Helps filter false breakouts and shows only high-probability zones.
- **Display Mode**: Overlaid on the main chart, displaying OBs as boxes, supporting up to 500 boxes.
- **Limitations**: Retest period fixed at 15 bars; based on simple candlesticks (no volume filter); no automatic cleanup of old OBs (manual management required).
The indicator has no built-in alerts but can be extended. ATR is used dynamically to validate strength.
## Input Parameters
Input parameters are concise, divided into core settings and display group. Below explains each parameter’s default value, type, and function.
### Core Settings
- **Structure Lookback** (int, default: 10, min: 3): Lookback period for structure detection (length for ta.highest/lowest). Higher values detect stronger structures.
- **Minimum Impulse Strength (ATR ×)** (float, default: 1.5, min: 0.5): Minimum impulse strength ((high-low) > ATR * this value). Ensures significant movement before OB.
- **Bars to watch for Retest** (int, default: 15, min: 1): Number of bars to monitor for retest. OB is confirmed only if price retests the OB zone within N bars after a breakout.
### Display Settings
- **Show Bullish OBs** (bool, default: true): Show bullish OBs (demand zone, rebounds after retest).
- **Show Bearish OBs** (bool, default: true): Show bearish OBs (supply zone, reverses after retest).
Colors are fixed: green (bullish, 80% transparency), red (bearish, 80% transparency).
## Calculations and Display
### Break of Structure (BOS) Detection
- **ATR Calculation**: ta.atr(14) used for strength verification.
- **Swing High/Low**: ta.highest(high, lookback) / ta.lowest(low, lookback) to identify structure. ...
## Calculation and Display
### Structure Breakout (BOS) Detection
- **ATR Calculation**: `ta.atr(14)` used for strength verification.
- **Swing High/Low**: `ta.highest(high, lookback)` / `ta.lowest(low, lookback)` identify structure.
- **BOS Trigger**:
- **bullBOS**: close > hh (breaks previous high).
- **bearBOS**: close < ll (breaks previous low).
### Order Block Identification
- **getLastOppositeCandle(isBullish)**:
- Search for the most recent "opposite" candle within the lookback period (bullBOS: bearish candle close < open; bearBOS: bullish candle close > open).
- Returns the index (idx); if none, then na.
- **OB Logic** (only when showBullish/Bearish=true):
- **Bullish OB (bullBOS)**:
- Find previous bearish candle (idx), check momentum: (high-low) > ATR * atrMult.
- Calculate obLow = low , obHigh = high .
- Backtest check: within 15 candles low inside → inRetest = true.
- If confirmed: draw green box (from bar_index - idx to current, obLow to obHigh); label "🟩 Bullish OB (Valid)" (top-left, green, 80% transparency, white text).
- Push into bullOBs array.
- **Bearish OB (bearBOS)**: symmetric, red box, label "🟥 Bearish OB (Valid)" (bottom-left).
- **Array Management**: var box bullOBs/bearOBs store all OBs; no automatic cleanup (expandable).
### Display Elements
- **Boxes**: dynamically from idx to current candle, visually showing OB area.
- **Labels**: displayed when confirmed, positioned based on obHigh/obLow.
- No lines/fills; pure boxes + labels.
## Alert Functionality
The indicator has no built-in alerts but can be extended via TradingView alerts, for example:
- **New OB**: bullBOS and inRetest or bearBOS and inRetest.
- **Backtest**: price enters OB range.
It is recommended to add `alertcondition()` for custom alerts. ...
It is recommended to add a custom alertcondition(), such as 'Bullish OB Confirmed'.
## Usage Tips
- **Optimization**: lookback=10 balances sensitivity; atrMult=1.5 filters weak impulses; retestBars=15 is suitable for intraday.
- **Customization**: turn off showBullish/Bearish to hide types; add volume filtering to the fork for better accuracy.
- **Explanation**:
- **BOS + Backtesting**: ensure OB is 'real' (not a false breakout); only draw after backtesting to avoid noise.
- **Strength**: (high-low)>ATR*1.5 indicates strong impulses, making OB more reliable.
- **Application**: Bullish OB = buy zone (support); Bearish OB = sell zone (resistance).
- **Limitations**: fixed backtesting period may miss late retracements; no volume/time filtering; few OBs in low-volatility markets.
- **Extensions**: add OB counts or Fibonacci extensions.
ICT订单块交易指标,用于识别“订单块”(Order Blocks, OB),基于结构突破(Break of Structure, BOS)与回测(Retest)机制。它通过检测摆动高/低点后的相反方向烛台,形成潜在供给/需求区域,仅在价格回测时确认并绘制有效OB。指标强调“真实”OB:需强冲动(> ATR * 乘数)与回测验证。
- **核心功能**:检测BOS(结构突破);查找前冲动相反烛台;验证强度与回测;绘制OB盒子与标签。
- **适用场景**:适合ICT策略、供给需求交易或反转识别。帮助过滤假突破,仅显示高概率区域。
- **显示模式**:叠加在主图上,使用盒子(boxes)显示OB,支持最大500个盒子。
- **限制**:回测期固定15柱;基于简单烛台(无成交量过滤);无自动清理旧OB(手动管理)。
指标无内置警报,但可扩展。数据使用ATR动态验证强度。
## 输入参数
输入参数简洁,分为核心设置与显示组。以下说明每个参数的默认值、类型和作用。
### 核心设置
- **Structure Lookback** (int, 默认: 10, 最小: 3):结构检测回溯期(ta.highest/lowest的长度)。较高值检测更强结构。
- **Minimum Impulse Strength (ATR ×)** (float, 默认: 1.5, 最小: 0.5):最小冲动强度((high-low) > ATR * 此值)。确保OB前有显著移动。
- **Bars to watch for Retest** (int, 默认: 15, 最小: 1):回测监控柱数。突破后N柱内价格回测OB区域才确认。
### 显示设置
- **Show Bullish OBs** (bool, 默认: true):显示看涨OB(需求区,回测后反弹)。
- **Show Bearish OBs** (bool, 默认: true):显示看跌OB(供给区,回测后反转)。
颜色固定:绿(看涨,80%透明)、红(看跌,80%透明)。
## 计算与显示
### 结构突破(BOS)检测
- **ATR计算**:ta.atr(14) 用于强度验证。
- **摆动高/低**:ta.highest(high, lookback) / ta.lowest(low, lookback) 识别结构。
- **BOS触发**:
- **bullBOS**:close > hh (上破前高)。
- **bearBOS**:close < ll (下破前低)。
### 订单块识别
- **getLastOppositeCandle(isBullish)**:
- 查找最近lookback柱内“相反”烛台(bullBOS: 熊烛 close < open;bearBOS: 牛烛 close > open)。
- 返回索引(idx);若无则na。
- **OB逻辑**(仅当showBullish/Bearish=true):
- **看涨OB (bullBOS)**:
- 查找前熊烛(idx),检查冲动:(high-low) > ATR * atrMult。
- 计算obLow=low ,obHigh=high 。
- 回测检查:15柱内low 在 内 → inRetest=true。
- 若确认:绘制绿盒(bar_index-idx 到当前,obLow到obHigh);标签“🟩 Bullish OB (Valid)”(左上,绿,80%透明,白文本)。
- 推入bullOBs数组。
- **看跌OB (bearBOS)**:对称,红盒,标签“🟥 Bearish OB (Valid)”(左下)。
- **数组管理**:var box bullOBs/bearOBs 存储所有OB;无自动清理(可扩展)。
### 显示元素
- **盒子**:动态从idx到当前柱,延伸显示OB区域。
- **标签**:确认时显示,位置基于obHigh/obLow。
- 无线条/填充;纯盒子+标签。
## 警报功能
指标无内置警报,但可通过TradingView警报扩展,例如:
- **新OB**:bullBOS and inRetest 或 bearBOS and inRetest。
- **回测**:价格进入OB范围。
建议添加alertcondition()自定义,如“Bullish OB Confirmed”。
## 使用提示
- **优化**:lookback=10平衡敏感;atrMult=1.5过滤弱冲动;retestBars=15适合日内。
- **自定义**:关闭showBullish/Bearish隐藏类型;fork添加成交量过滤提升准确。
- **解释**:
- **BOS+回测**:确保OB“真实”(非假突破);仅回测后绘制,避免噪音。
- **强度**:(high-low)>ATR*1.5表示强冲动,OB更可靠。
- **应用**:看涨OB=买入区(支撑);看跌OB=卖出区(阻力)。
- **局限**:回测期固定,可能错过晚回测;无成交量/时间过滤;低波动市场少OB。
- **扩展**:添加OB计数或斐波那契扩展。

ICT Open Range Gap & 1st FVG + MNO/PDHL Title:
ICT Open Range Gap & 1st FVG + MNO/PDHL (Source Rays)
Description:
This is an enhanced version of the "ICT Open Range Gap & 1st FVG" indicator (originally by fadizeidan), modified to include essential daily institutional reference levels with precise "Source Ray" visualization.
This tool is designed to declutter your chart by keeping only the active day's levels visible while providing historical precision for Previous Day High/Low and Midnight Open.
Key Features:
1. MNO (New York Midnight Open)
Automatically captures the exact opening price at 00:00 New York Time.
Draws a level extending to the current price action to act as a bias filter (Bullish above/Bearish below).
Note: This strictly uses 00:00 ET, distinct from the Settlement/Electronic open.
2. PDH & PDL with Source Rays
Previous Day High (PDH) and Previous Day Low (PDL) are not just arbitrary horizontal lines.
Source Ray Logic: The lines originate from the exact timestamp/candle where the High or Low occurred yesterday. This helps you visualize the "origin" of the liquidity pool.
The lines automatically extend to the right of the current price.
3. ICT Open Range Gap & 1st FVG (Original Logic)
Retains the core functionality of measuring the gap between the 09:30 NY Open and the prior Close.
Identifies the first 1-minute Fair Value Gap (FVG) after the opening bell.
Includes quadrant projections (25%, 50% CE, 75%) for the opening range.
Settings:
Daily Levels (Source Rays): A new settings group allows you to toggle MNO, PDH, and PDL on/off individually.
Customization: Fully customizable colors, line styles, and labels for all levels.
Active Only: To maintain a clean chart, daily levels (MNO/PDH/PDL) are persistent for the current session only and do not clutter historical data.
Credits:
Original script logic by fadizeidan.
Modifications for MNO & PDHL Source Rays by Assistant.

ICT Sweep + CHoCH + FVG Alerts
### 🔥 ICT Sweep + CHoCH + FVG Alerts
Script designed to automate ICT entry confirmations using:
• Liquidity Sweep (Buy/Sell Stops taken)
• Change of Character (CHoCH)
• Fair Value Gap (FVG) confirmation
### ✅ Conditions
**Long signal when:**
1. Bearish liquidity sweep
2. Bullish CHoCH
3. Bullish FVG forms and gets respected
**Short signal when:**
1. Bullish liquidity sweep
2. Bearish CHoCH
3. Bearish FVG forms and gets respected
### 🎯 Purpose
This script helps traders detect smart-money setup entries based on ICT logic and receive alerts in real time.
### 📡 Alerts
Supports webhook automation for bots, signal servers, or trading platforms.
*This script does not place trades automatically, alerts only.*
### ⚠️ Disclaimer
This tool is for educational purposes.
Always backtest and use proper risk management.
ICT Sweep + FVG Entry (v6) • Pro Pack 📌 ICT Sweep + FVG Entry Pro Pack
This indicator combines key ICT price action concepts with practical execution tools to help traders spot high-probability setups faster and more objectively. It’s designed for scalpers and intraday traders who want to keep their chart clean but never miss critical market structure events.
🔑 Features
Liquidity Pools (HTF)
• Auto-detects recent swing highs/lows from higher timeframes (5m/15m).
• Draws both lines and optional rectangles/zones for clear liquidity areas.
Liquidity Sweeps (BSL/SSL)
• Identifies when price sweeps above/below liquidity pools and rejects back.
• Optional Grade-A sweep filter (wick size + strong re-entry).
Fair Value Gaps (FVGs)
• Highlights bullish/bearish imbalances.
• Optional midline (50%) entry for precision.
• Auto-invalidation when price fully closes inside the gap.
Killzones (New York)
• Highlights AM (9:30–11:30) and PM (14:00–15:30) killzones.
• Option to block signals outside killzones for higher strike rate.
Bias Badge (DR50)
• Displays if price is trading in a Bull, Bear, or Range context based on displacement range midpoint.
SMT Assist (NQ vs ES)
• Detects simple divergences between indices:
Bearish SMT → NQ makes HH while ES doesn’t.
Bullish SMT → NQ makes LL while ES doesn’t.
SL/TP Helper & R:R Label
• Automatically draws stop loss (at sweep extreme) and target (opposite pool or recent swing).
• Displays expected Risk:Reward ratio and blocks entries if below your chosen minimum.
Filters
• ATR filter ensures signals only appear in sufficient volatility.
• Sweep quality filter avoids weak wicks and fake-outs.
🎯 How to Use
Start on HTF (5m/15m) → Identify liquidity zones and bias.
Drop to LTF (1m) → Wait for a liquidity sweep confirmation.
Check for FVG in the sweep’s direction → Look for retest entry.
Use the SL/TP helper to validate your risk/reward before taking the trade.
Focus entries during NY Killzones for maximum effectiveness.
✅ Why this helps
This tool reduces screen time and hesitation by automating repetitive ICT concepts:
Liquidity pools, sweeps, and FVGs are marked automatically.
Killzone timing and SMT divergence are simplified.
Clear visual signals for entries with built-in RR filter help keep your trading mechanical.
⚠️ Disclaimer: This script is for educational purposes only. It does not provide financial advice or guarantee results. Always use proper risk management.

ICT Sweep + FVG Entry (v6) • Antoine📌 ICT Sweep + FVG Entry (Antoine)
This indicator is designed for price action traders who follow ICT concepts and want a mechanical tool to spot liquidity sweeps, fair value gaps (FVGs), and precise entry signals.
🔎 Key Features
Liquidity Pools (HTF)
• Automatically plots recent swing highs/lows from a higher timeframe (5m/15m).
• These act as Buy Side Liquidity (BSL) and Sell Side Liquidity (SSL) levels where stop orders accumulate.
Sweep Detection
• Identifies when price breaks a pool (BSL/SSL) but closes back inside → a classic liquidity grab.
• Plots a triangle on the chart when a sweep is confirmed.
Fair Value Gap (FVG) Highlighting
• Detects bullish and bearish FVGs on the execution timeframe (ideal for 1m).
• Option to display active FVG zones with shaded boxes.
Entry Signals
• A signal (cross) appears when:
A liquidity sweep occurs.
An FVG forms in the direction of the rejection.
Price retests the FVG (entry at the 50% mid-level or edge).
Alerts Ready
• Get alerted for sweeps (bullish/bearish) and for entry confirmations (long/short FVG retests).
🎯 How to Use
Choose your HTF (5m or 15m) → The indicator maps major liquidity pools.
Drop to LTF (1m) → Wait for a sweep signal at one of the pools.
Confirm with FVG → If an FVG appears in the sweep’s direction, the indicator waits for a retest.
Entry → Enter on the retest of the FVG (edge or 50%).
Risk Management
Stop loss: just beyond the sweep’s wick.
Target: opposite liquidity pool.
Minimum recommended R:R: 1:2.
✅ Why this helps
This tool makes it easier to trade ICT-style setups without missing opportunities:
No need to manually draw every swing high/low.
Automatic FVG detection saves time.
Clear sweep + FVG + retest logic keeps your entries mechanical and disciplined.
⚠️ Disclaimer: This script is for educational purposes only. It does not guarantee profits. Always use proper risk management.

ICT Silver Bullet Zones (All Sessions)This Pine Script v6 indicator highlights the ICT Silver Bullet windows (10:00–11:00 local time) for all major forex/trading sessions: London, New York AM, New York PM, and Asia.
✅ Features:
Clearly visualizes Silver Bullet zones for each session.
Labels are centered inside each zone for easy identification.
Fully compatible with Pine Script v6 and TradingView.
Adjustable opacity and label size for better chart visibility.
Works on any timeframe and keeps historical zones visible.
Use Case:
Perfect for ICT strategy traders who want to identify high-probability trading windows during major market sessions. Helps in planning entries and understanding liquidity timing without cluttering the chart.
Instructions:
Add the script to your TradingView chart.
Adjust opacity and label size to suit your chart style.
Observe the SB zones for all sessions and plan trades according to ICT methodology.

ICT Directional FVG Indicator (Buffered SL)This is the first indicator I have ever made, and I am very new to Pine Script. I’ve tried my best to create this as a strategy, but I’m still learning, so please be kind and constructive with your feedback!
ICT Directional FVG Indicator (Buffered SL)
This indicator is designed for traders who follow ICT (Inner Circle Trader) concepts, focusing on Fair Value Gaps (FVGs), liquidity sweeps, and session-based trading. It automatically detects bullish and bearish FVGs, highlights them on the chart, and identifies liquidity sweep events. The indicator features three customizable Kill Zones (London, New York, and Asia sessions), each with independent toggles and color-coded backgrounds for clear visual separation.
Key features:
Fair Value Gap Detection: Highlights bullish and bearish FVGs in real time.
Liquidity Sweep Alerts: Marks potential liquidity sweep events for both highs and lows.
Session Kill Zones: Toggle each Kill Zone (London, New York, Asia) independently; background color changes only in enabled zones.
Trade Signal Visualization: Plots entry, stop loss, and take profit levels based on FVG and sweep logic, with a user-defined stop loss buffer.
Customizable Display: Easily enable or disable FVGs, sweeps, trade levels, and each Kill Zone to suit your strategy.
This tool is ideal for ICT-based traders who want a clear, automated view of FVGs, sweeps, and session activity, with full control over which sessions and signals are displayed.

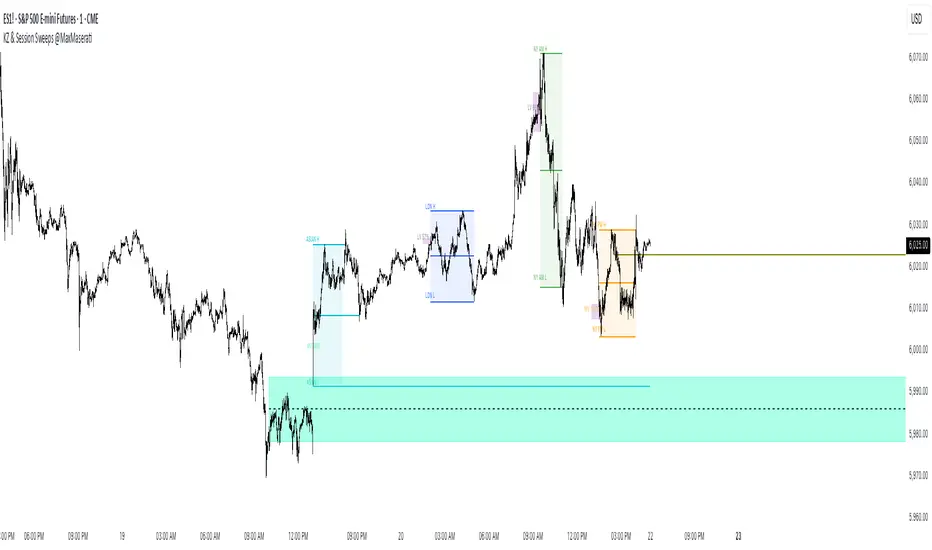
ICT Killzones Bias & Volume Sweeps @MaxMaserati📌 Overview
This indicator helps traders identify key ICT Killzones (Asian, London, NY AM, NY PM sessions) along with volume analysis and sweep detection. It highlights institutional order blocks, tracks session bias, and detects liquidity sweeps with volume confirmation.
Key Features:
✅ ICT Killzones (Asian, London, NY AM, NY PM)
✅ Volume Analysis (High/Low volume detection)
✅ Sweep Detection (Buyside/Sellside sweeps with volume confirmation)
✅ Session Bias (Bullish/Bearish bias based on price action)
✅ Customizable Sessions (Add personal trading hours)
✅ Institutional Order Build-up (30-min pre-session accumulation zones)
⚙️ Input Settings
1. Timezone Settings
Chart Timezone: Adjust to your local timezone (default: New York).
2. Session Toggles
Asian / London / NY AM / NY PM Sessions: Enable/disable each session.
NY Lunch Session: Optional session (disabled by default).
Personal Trading Time: Customize your trading hours.
3. Label Settings
Label Size: Tiny, Small, Normal, Large.
Session Labels: Customize text for High (H), Low (L), Mid (M) labels.
Background Transparency: Adjust session box opacity.
4. Volume Analysis
Show Volume Labels: Displays volume strength (🚀 Very High, 🔥 High, ⚖️ Normal, 💤 Low, 🐢 Very Low).
Volume Lookback Period: Adjusts volume comparison window.
High/Low Volume Thresholds: Define what constitutes high/low volume.
5. Sweep Detection
Buyside/Sellside Sweeps: Highlights liquidity sweeps.
Sweep Margin: Adjust sensitivity for sweep detection.
Fake Sweep Zones: Option to hide or highlight fakeouts.
Example of Session Sweep and Volume:
Here we have a Bullish Sweep of London Low session by NY AM
However, the volume was low suggesting buyers are not strong enough (M1)
And then the sellers took over and a pressure retest by the buyers of the level and then sellers entered with more power/pressure
6. Session Momentum & Bias
Show Session Bias: Indicates bullish/bearish bias for each session.
Bias Strength Threshold: Adjust sensitivity for bias detection.
📊 How It Works
1. Session Highs/Lows
The indicator tracks High, Low, and Mid prices for each session.
Lines and boxes are drawn to visualize the session range.
2. Volume Analysis
Compares current volume to historical average.
Displays volume strength with emojis (🚀, 🔥, ⚖️, 💤, 🐢).
Highlights high-volume sweeps for confirmation.
3. Sweep Detection
Detects buyside sweeps (liquidity above highs) and sellside sweeps (liquidity below lows).
Sweep zones expand if price lingers near the swept level.
4. 30 minute Pre-session Institutional order buildup
Highlights 30-minute pre-session zones where institutions may accumulate orders.
5. Session Bias
Calculates bias based on open/close price action within the session.
Displays Bullish, Bearish, or Neutral labels.
]
🎯 Trading Applications
1. Liquidity Sweeps
Look for sweeps with high volume as confirmation of institutional activity.
Fade fake sweeps (if enabled) when price reverses quickly.
2. Session Breakouts
Trade breakouts from Asian/London ranges during NY sessions.
Watch for volume expansion on breakouts for confirmation.
3. Pre- Session Institutional Block
Price often reacts to pre-session institutional position build-up (30-min before session opens).
LV:Low Volume, HV: High volume and MV: Medium Volume
NY AM Pre-Session institutional Order Build-up block with high sweep
🔧 Customization Tips
Adjust session times to normal future sessions to match your trading style.
Modify sweep sensitivity if too many/too few sweeps are detected.
Use volume thresholds to fine-tune high/low volume alerts.
📌 Final Notes
This indicator combines ICT concepts with volume analysis for a powerful trading edge. Use it alongside price action and market structure for best results at your own risk.
ICT Session by LasinsName: ICT Session by Lasins
Purpose: To visually identify and differentiate between the Asian, London, and New York trading sessions on the chart.
Features:
Highlights the background of the chart during each session.
Includes a mini dashboard in the top-right corner to show the active session.
Allows customization of time zones (exchange timezone or UTC).
Displays copyright and author information.
Key Components
Inputs:
useExchangeTimezone: A boolean input to toggle between using the exchange timezone or UTC for session times.
showDashboard: A boolean input to toggle the visibility of the mini dashboard.
Session Times:
The script defines three trading sessions:
Asian Session: 2000-0000 UTC (or adjusted for exchange timezone).
London Session: 0200-0500 UTC (or adjusted for exchange timezone).
New York Session: 0700-1000 UTC (or adjusted for exchange timezone).
Session Detection:
The is_session function checks if the current time falls within a specified session using the time function.
Background Coloring:
The bgcolor function is used to highlight the chart background during each session:
Asian Session: Red background.
London Session: Green background.
New York Session: Blue background.
Mini Dashboard:
A table is created in the top-right corner of the chart to display the active session and its corresponding color.
The dashboard includes:
A header row with "Session" and "Color".
Rows for each session (Asian, London, New York) with their respective colors.
Copyright and Author Information:
A label is added to the chart to display the copyright and author information ("© ICT Session by Lasins Raj").
How It Works
The script checks the current time and compares it to the predefined session times.
If the current time falls within a session, the chart background is highlighted with the corresponding color.
The mini dashboard updates to reflect the active session.
The copyright and author information is displayed at the bottom of the chart.
Customization
You can adjust the session times in the script to match your preferred timezone or trading hours.
The useExchangeTimezone input allows you to switch between UTC and the exchange timezone.
The showDashboard input lets you toggle the visibility of the mini dashboard.
Example Use Case
Traders who follow the ICT (Inner Circle Trader) methodology can use this indicator to identify key trading sessions and plan their trades accordingly.
The visual representation of sessions helps traders quickly recognize when major markets are open and active.

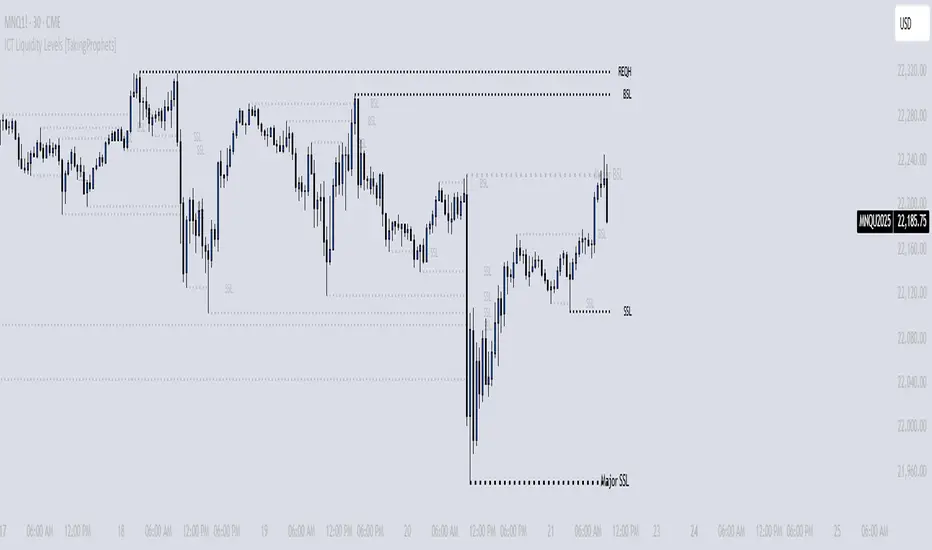
ICT Liquidity Levels [TakingProphets]Overview
This indicator is designed to dynamically identify and display key liquidity levels—areas where market participants are likely to engage. By analyzing price swing points, it highlights potential support and resistance zones that can signal reversals or breakouts. The script distinguishes between buyside and sellside liquidity levels, presenting them with customizable visual cues and labels for immediate clarity.
How It Works
Swing Point Detection:
The indicator uses a pivot-based method (with a configurable “Base Swing Strength”) to detect swing highs and lows. Each detected swing is evaluated for its “swing size” (percentage price movement), and if it exceeds a user-defined threshold, the level is classified as major.
Level Creation and Classification:
Overview
Built on core ICT principles, this indicator identifies key liquidity zones—areas where market imbalances can lead to liquidity sweeps. By dynamically analyzing swing points, it offers traders a real-time view of where liquidity is clustering, allowing for a deeper understanding of market structure. 🚀
How It Works
Swing Point Detection 🔍
• Uses a pivot-based method with a configurable “Base Swing Strength” to detect significant price swings.
• Calculates the swing size (percentage change) to flag zones that exceed the “Major Level Threshold” as major liquidity zones.
Level Creation & Classification 🛠️
• Buyside Liquidity Levels (BSL):
Identified from swing highs, marking zones where buying liquidity clusters.
• Sellside Liquidity Levels (SSL):
Identified from swing lows, highlighting zones of concentrated selling liquidity.
• Each zone is stored with its price, bar index, and classification (major or standard) before being drawn as a horizontal line on the chart.
Dynamic Level Management 🔄
• Extension: Liquidity lines automatically extend from their detection point to the current bar.
• Consolidation: When levels are close in price, the script merges them—updating labels (e.g., “REQH” or “REQL”) to denote unified liquidity zones.
• Traded-Through Detection: Adjusts or removes levels if the market moves beyond them, based on your settings.
• Age-Based Cleanup: Inactive zones are automatically removed after a set number of bars to maintain clarity.
Customization Options ⚙️
Visual Settings:
• Choose from solid, dashed, or dotted line styles and adjust line width.
• Option to display labels with customizable placement (left or right) for optimal clarity.
Color & Opacity:
• Set distinct colors for buyside and sellside liquidity zones.
• Configure opacity for zones that have been traded through, keeping them visible yet de-emphasized.
Detection & Cleanup Parameters:
• Adjust “Base Swing Strength” to control pivot detection sensitivity.
• Set the “Major Level Threshold %” to filter for significant liquidity zones.
• Decide whether to retain or remove zones once price moves through them.
• Define how many bars should pass before inactive zones are automatically deleted.
How to Use 🚀
Apply the Indicator:
Simply add the script to your chart—it automatically detects and marks key liquidity zones based on recent price action.
Adjust Inputs:
Fine-tune parameters like swing strength, threshold percentages, and visual settings to match the asset’s characteristics and your trading strategy.
Interpret the Visuals:
• Major Liquidity Zones:
Highlighted with thicker lines and distinct labels (e.g., “Major BSL/SSL”), indicating areas of heightened liquidity concentration.
• Consolidated Zones:
Merged labels (e.g., “REQH/REQL”) denote unified liquidity zones where clustering is significant.
• Traded-Through Zones:
Changes in opacity signal that the market has moved beyond a previously identified liquidity zone.
Underlying ICT Concepts 💡
Liquidity Pools & Sweeps:
Focused on identifying where liquidity is concentrated, the indicator aligns with ICT methodologies that highlight zones crucial for liquidity sweeps.
Pivot Analysis for Liquidity:
Enhances traditional pivot detection to spotlight liquidity clusters, providing a deeper insight into market structure.
Real-Time Adaptation:
With continuous updates and built-in cleanup, the indicator ensures that liquidity zones accurately reflect current market conditions.
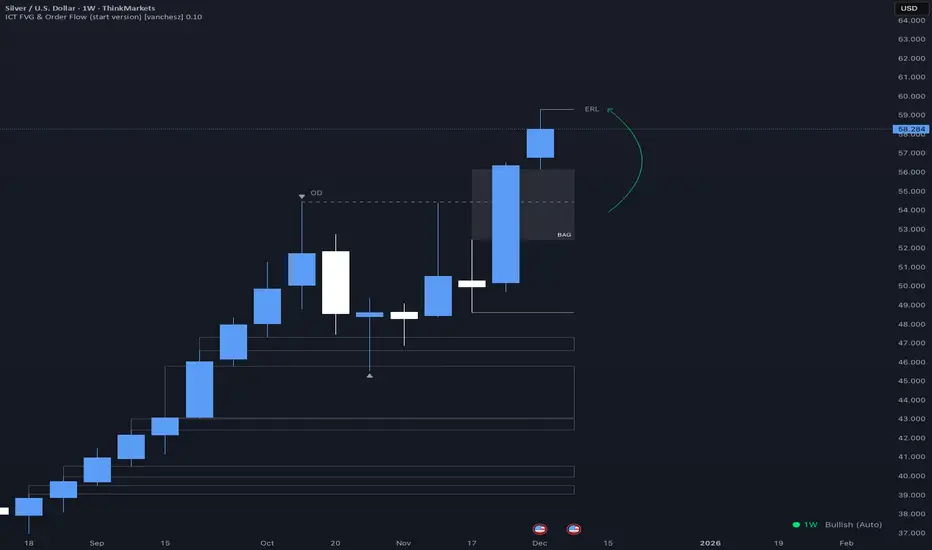
ICT FVG & Order Flow (start version) [vanchesz]Overview
Master liquidity with precision. This indicator brings the iCT trading concept to life by automatically detecting liquidity pools, fair value gaps, and key swing points. It shows you exactly where price is likely to move next — from Internal Range Liquidity (IRL) to External Range Liquidity (ERL). With built-in multi-timeframe validation, it helps you stay one step ahead of the market.
Concept
Markets move where liquidity is. According to iCT theory, price usually sweeps internal liquidity (IRL) first and then hunts for external liquidity (ERL). By mapping this process in real time, the indicator provides a clear framework for understanding market structure, liquidity grabs, and directional bias.
High Probability Leg
Context States
Key Features
Detects the High-Probability Leg (HPL) — the leg containing a fair value gap (FVG)
Highlights unmitigated FVGs within the current context.
Marks swing points (SP), IRL levels, and ERL targets automatically.
Identifies IRL rejections when liquidity is taken inside the leg
Multi-timeframe sweep check – if a single candle takes both IRL and ERL, the indicator zooms into a lower timeframe to confirm which liquidity was swept first
Flexible settings for swing points, look back bar count, depth, colors, and style
How to use
Start from the monthly chart to define the macro trend.
Analyze the latest order flow leg:
Bullish FVG = bullish context, Bearish FVG = bearish context
Step down to the daily timeframe and repeat the analysis.
Wait for price to reject from IRL (the indicator highlights it automatically).
Drop to a lower timeframe for entries — use timeframe alignment to select the right LTF.
Enter with the FVG model, targeting liquidity within the leg.
Place take profit inside the context — e.g., never above ERL(in a bullish setup).
Pro version gives you
Alerts for all context events (New context, New FVG, IRL rejection, Context failing by 2CR, ERL/SP sweep
Check of context failing by 2CR (two candle rejection)
Suggestions for every context state
This indicator is provided solely for educational and informational purposes.
It does not constitute financial advice, trading signals, or a recommendation to buy or sell any instrument.
ICT | SMC [Sky Eye] 體驗版12/15體驗版12/15
DC: discord.gg/8kE8XwmErc
輔助 SMC 位子畫線 幫助你加速學習
只需要知道這個位子是甚麼在去加強研究 ICT / SMC 即可
想學習更多可以到DC一起學習
DC: discord.gg/8kE8XwmErc
This tool helps you draw lines to indicate SMC positions, accelerating your learning.
You only need to know what each position represents before focusing your research on ICT/SMC.
To learn more, join us at DC.

ICT | SMC 工具箱 [Sky Eye]DC: discord.gg
輔助 SMC 位子畫線 幫助你加速學習
只需要知道這個位子是甚麼在去加強研究 ICT / SMC 即可
想學習更多可以到DC一起學習
DC: discord.gg
This tool helps you draw lines to indicate SMC positions, accelerating your learning.
You only need to know what each position represents before focusing your research on ICT/SMC.
To learn more, join us at DC.

ICT FVG & Order Flow (IRL to ERL)Overview
Master liquidity with precision. This indicator brings the iCT trading concept to life by automatically detecting liquidity pools, fair value gaps, and key swing points. It shows you exactly where price is likely to move next — from Internal Range Liquidity (IRL) to External Range Liquidity (ERL). With built-in alerts and multi-timeframe validation, it helps you stay one step ahead of the market.
Concept
Markets move where liquidity is. According to iCT theory, price usually sweeps internal liquidity (IRL) first and then hunts for external liquidity (ERL). By mapping this process in real time, the indicator provides a clear framework for understanding market structure, liquidity grabs, and directional bias.
How it works
Detects the High-Probability Leg (HPL) — the leg containing a fair value gap (FVG)
Highlights unmitigated FVGs within the current context.
Marks swing points (SPs), IRL levels, and ERL targets automatically.
Identifies IRL rejections when liquidity is taken inside the leg.
Identifies if a FVG is Respected or Disrespected by 2 Candle Rejection (2CR)
Notifies you of every critical liquidity event:
New context leg
New FVG
IRL rejection
ERL or SP liquidity sweep
FVG is Respected or Disrespected by 2CR
Key Features
Automatic drawing of IRL, ERL, and SP levels
FVG types: Simple FVG or Breakaway Gap (BAG)
Multi-timeframe sweep check – if a single candle takes both IRL and ERL, the indicator zooms into a lower timeframe to confirm which liquidity was swept first
Fully customizable alerts for all liquidity events
Flexible settings for swing points, lookback depth, colors, and style
How to use
Start from the monthly chart to define the macro trend.
Analyze the latest order flow leg:
Bullish FVG = bullish context
Bearish FVG = bearish context
Step down to the daily timeframe and repeat the analysis.
Wait for price to approach or reject from IRL (the indicator highlights it automatically).
Drop to a lower timeframe for entries — use timeframe alignment to select the right LTF.
Enter with the FVG model, targeting liquidity within the leg.
Place take profit inside the context — e.g., never above ERL in a bullish setup.
🔔 Alerts
New Context
New FVG
IRL Rejection
ERL Sweep
SP Sweep
2CR
⚙️ Customization
Context side (auto/manual)
LTF pointer (auto/manual)
Show/hide Resistance FVG, Overlapping Defense, ERL/SP sweeps, 2CR
Look back bars, swing lines, swing length, line offsets
* Full color customization (FVG, bullish/bearish, labels, boxes)

ICT Levels Breach Scanner (12M Timeframe)Detects and scans for breaches of key Inner Circle Trader (ICT) concepts on the yearly (12M) chart: Swing Lows (3-bar wick pivots), Rejection Blocks (3-bar body pivots), Fair Value Gaps (3-bar inefficiencies), and Volume Imbalances (bullish body gaps ≥0.15%, unmitigated).
Features:
Tracks active levels with arrays for real-time breach detection (price low below any level triggers alert).
Visuals: Blue solid lines (Swing Lows), orange dashed (Rejection Blocks), purple dotted (FVGs), green boxes (VIs)—all extending right.
Red triangle + bgcolor alert on breach bar; built-in alertcondition for notifications.
Optimized for Pine Screener: Filter stocks (e.g., US exchanges) showing symbols where price has traded below these levels on the latest 12M bar.
Usage: Apply to a 12M chart for viz, or add to Screener > Pine tab for multi-symbol scans. Customize gap % or add bearish variants via inputs. Ideal for spotting potential support in long-term trends.
ICT-inspired; test on liquid stocks like AAPL/TSLA. Not financial advice.

ICT Suspension BlocksICT Suspension Block (SB) Indicator
The ICT Suspension Block (SB) is a three-candle price action pattern that often act as support or resistance zones. A Suspension Block is a three-candle pattern showing a brief pause in price efficiency before continuation. These zones frequently serve as areas where price may later return, offering traders potential trading opportunities.
Pattern Definition
A Suspension Block forms when three consecutive candles move in the same direction but leave behind a specific body-to-body imbalance. (a gap between the bodies of consecutive candles).
Bullish Suspension Block (+SB):
All three candles are bullish (close > open).
Candle 1 close < Candle 2 open.
Candle 2 close < Candle 3 open.
Zone = from Candle 1 close to Candle 3 open.
Bearish Suspension Block (-SB):
All three candles are bearish (close < open).
Candle 1 close > Candle 2 open.
Candle 2 close > Candle 3 open.
Zone = from Candle 1 close to Candle 3 open.
These zones mark areas where price was temporarily imbalanced. Price often “respects” these levels later, either bouncing from them or breaking through them, which can provide valuable trade context.
Application
Suspension Blocks are used to mark areas where price may later react:
A Bullish SB can act as potential support.
A Bearish SB can act as potential resistance.
The significance of a block depends on market context. Blocks formed during strong, impulsive moves tend to be more meaningful than those in consolidation.
How the Indicator Works
Identifies bullish and bearish suspension blocks using body gap imbalances.
Draws colored zones (green = bullish, red = bearish) directly on the chart.
Extends zones forward until they are inversed by price action.
Once inversed, zones switch to a neutral color, allowing traders to annotate/extend them manually if desired.
Includes Consequent Encroachment (CE) lines (the 50% equilibrium of the block), which many traders use as reaction levels.
Features
Customizable colors for bullish, bearish, and inversed zones
Extend blocks indefinitely forward or limit them to a set number of bars
Adjustable maximum number of displayed blocks for performance control
Consequent Encroachment (CE) (Middle Point, 50%, Equilibrium) line feature
Configurable CE line style, color, and width
How to Use It
Trend Following: Blocks forming in the direction of trend can act as continuation zones.
Reversals: Opposite-direction blocks may signal exhaustion and potential turning points.
Liquidity Levels: CE lines (50% of block) often serve as reaction levels for entries, partials, or stop placement.
Context is Key: Suspension Blocks should not be used in isolation. Combine them with market structure, liquidity pools, or other confluence factors for best results.
Notes
This indicator is intended for technical analysis and research.
It should always be combined with proper risk management and a complete trading plan.
Past market behavior does not guarantee future results.

ICT SMC — OB & FVG (Enhanced v6)This indicator is a comprehensive implementation of ICT Smart Money Concepts (SMC), focusing on Order Blocks (OB) and Fair Value Gaps (FVG) with enhanced detection logic and session-based filtering.
🔍 Key Features
Impulse-Based OB Detection: Identifies bullish and bearish order blocks using configurable impulse bar logic and ATR-based movement thresholds.
Fair Value Gap Detection: Highlights FVGs based on price displacement logic, helping traders spot potential inefficiencies in price action.
Session Filtering: Allows users to filter signals based on major trading sessions (Sydney, Tokyo, London, New York).
Trend & Volume Confirmation: Integrates EMA slope, market structure breaks, and volume analysis to score trade signals.
Visual Zones: Displays OB and FVG zones using colored boxes with customizable transparency and color settings.
Signal Alerts: Generates long/short trade signals based on a scoring system and session validation, with built-in alert conditions.
⚙️ Customization
Adjustable EMA and ATR lengths
Configurable impulse bar count and movement thresholds
Toggleable session filters
Custom colors for OB and FVG zones
📈 Use Cases
This tool is ideal for traders who follow ICT concepts and want a visual, automated way to identify high-probability zones and trade setups based on smart money principles.

ICT 369 Sniper MSS Indicator (HTF Bias) - H2LThis script is an ICT (Inner Circle Trader) concept-based trading indicator designed to identify high-probability reversal or continuation setups, primarily focusing on intraday trading using a Higher Timeframe (HTF) directional bias.
Here are the four core components of the indicator:
Higher Timeframe (HTF) Bias Filter (Market Structure Shift - MSS): It determines the overall trend by checking if the current price has broken the most recent high or low swing point of a larger timeframe (e.g., 4H). This establishes a Bullish or Bearish bias, ensuring trades align with the dominant trend.
Fair Value Gap (FVG) and OTE: It identifies price imbalances (FVGs) and calculates the Optimal Trade Entry (OTE) levels (50%, 62%, 70.5%, etc.) within those gaps, looking for price to retrace into these specific areas.
Kill Zones (Timing): It incorporates specific time windows (London and New York Kill Zones, based on NY Time) where institutional trading activity is high, only allowing entry signals during these defined periods.
Signal and Targets: It triggers a Long or Short signal when all criteria are met (HTF Bias, FVG, OTE retracement, and Kill Zone timing). It then calculates and plots suggested trade levels, including a Stop Loss (SL) and three Take Profit targets (TP1, TP2, and a dynamic Runner Target based on the weekly Average True Range or ATR).
In summary, it's a comprehensive tool for traders following ICT principles, automating the confluence check across trend, structure, liquidity, and timing.

ICT SMC ToolKit By VIPIN | High Volume OB + BOS, CHoCH, FVG📌 ICT Smart Money Concepts (SMC) Toolkit
This indicator provides traders with a complete Smart Money Concepts (SMC) framework inside a single tool. It helps to visualize institutional trading footprints and market structure shifts more effectively without the need to combine multiple separate indicators.
---
🔹 Key Features
1. **Order Blocks (OB):**
- Automatically detects bullish and bearish order blocks.
- Helps traders identify institutional buying/selling zones where large players may be active.
- Volume filters included for more accurate signals.
2. **Break of Structure (BOS):**
- Marks market structure breaks that indicate continuation of the trend.
- Useful for identifying trend direction and confirming order flow.
3. **Change of Character (CHoCH):**
- Highlights early signs of market reversals.
- Shows when price transitions from bullish to bearish order flow (or vice versa).
4. **Fair Value Gaps (FVG):**
- Automatically draws zones of price imbalance.
- Traders can use these zones as possible retracement or entry levels.
- Helps to spot areas where price may return to "rebalance".
5. **Liquidity Sweeps:**
- Identifies liquidity grabs around recent highs and lows.
- Useful for spotting stop hunts and smart money manipulation before reversals.
6. **Custom Presets & Filters:**
- Users can toggle between OB-only, FVG-only, Sweep-only, or full SMC mode.
- Multiple color settings available for clear chart visualization.
---
🎯 Purpose of the Script
- Brings all major SMC tools (OB, BOS, CHoCH, FVG, Liquidity Sweep) together in one indicator.
- Reduces the need for multiple overlapping indicators.
- Helps traders simplify their workflow and keep charts clean.
- Focused on education, analysis, and market structure visualization.
---
⚠️ Disclaimer
This script is intended **for educational and analytical purposes only**.
It does not provide financial advice, trade recommendations, or guaranteed profits.
Traders should always manage their own risk and confirm setups with additional confluences.
---
ℹ️ Notes for Users
- This indicator works on multiple timeframes and instruments (Forex, Commodities, Indices, Crypto).
- Best used with a strong understanding of Smart Money Concepts (SMC) and ICT methodology.
- Combining this tool with your own analysis will provide the best results.

ICT Silver Bullet Zones (All Sessions, Custom Labels)CT Silver Bullet Zones
This indicator is designed for traders who follow the ICT *Silver Bullet* concept.
It automatically marks the **Silver Bullet window** (10:00–11:00 by default) across the **London, New York AM, New York PM, and Asia sessions**, with customizable settings for each session.
### Features:
* Separate adjustable time windows for **London, NY AM, NY PM, and Asia Silver Bullet sessions**.
* Colored session boxes with individual **opacity controls**.
* **Session labels placed at the top** of each zone, with customizable text size, color, and background opacity.
* Works on all timeframes and highlights only the Silver Bullet trading windows.
This tool is meant to help traders quickly identify ICT Silver Bullet opportunities in all major sessions without manual plotting.
