Liquidity Sentiment Profile (Auto-Anchored) [LuxAlgo]
The Liquidity Sentiment Profile (Auto-Anchored) is an advanced charting tool that measures by combining PRICE and VOLUME data over specified anchored periods and highlights the distribution of the liquidity and the market sentiment at specific price levels. This version is a variation of the previously published Liquidity Sentiment Profile , wherewith this version allows users to select a variety of different anchoring periods, such as 'Auto', 'Fixed Range', 'Swing High', 'Swing Low', 'Session', 'Day', 'Week', 'Month', 'Quarter', and 'Year'
Liquidity refers to the availability of orders at specific price levels in the market, allowing transactions to occur smoothly.
🔶 USAGE
A Liquidity Sentiment Profile (Auto-Anchored) is a combination of liquidity and a sentiment profile, where the right side of the profile highlights the distribution of the traded activity at different price levels, and the left side of the profile highlights the market sentiment at those price levels
The liquidity profile is categorized by assigning different colors based on the significance of the traded activity of the specific price levels, allowing traders to reveal significant price levels, such as support and resistance levels, supply and demand zones, liquidity gaps, consolidation zones, etc
The Liquidity Sentiment Profiles aim to present Value Areas based on the significance of price levels, thus allowing users to identify value areas that can be formed more than once within the range of a single profile
Level of Significance Line - displays the changes in the price levels with the highest traded activity (developing POC)
Buyside & Sellside Liquidity Zones - displays Liquidity Levels, also known as Supply and Demand Zones
🔶 SETTINGS
The script takes into account user-defined parameters and plots the profiles, where detailed usage for each user-defined input parameter in indicator settings is provided with the related input's tooltip.
🔹 Liquidity Sentiment Profile
Anchor Period: The indicator resolution is set by the input of the Anchor Period.
Fixed Period: Applicable if the Anchor Period is set to 'Fixed Range' then the period of the profile is defined with this option
Swing Detection Length: Applicable if the Anchor Period is set to 'Swing High' or 'Swing Low' then the length required to detect the Swing Levels is defined with this option which is then used to determine the period of the profile
🔹 Liquidity Profile
Liquidity Profile: Toggles the visibility of the Liquidity Profiles
High Traded Nodes: Threshold and Color option for High Traded Nodes
Average Traded Nodes: Color option for Average Traded Nodes
Low Traded Nodes: Threshold and Color option for Low Traded Nodes
🔹 Sentiment Profile
Sentiment Profile: Toggles the visibility of the Sentiment Profiles
Bullish Nodes: Color option for Bullish Nodes
Bearish Nodes: Color option for Bearish Nodes
🔹 Buyside & Sellside Liquidity Zones
Buyside & Sellside Liquidity Zones: Toggles the visibility of the Liquidity Levels
Buyside Liquidity Nodes: Color option for Buyside Liquidity Nodes
Sellside Liquidity Nodes: Color option for Sellside Liquidity Nodes
🔹 Other Settings
Level of Significance: Toggles the visibility of the Level of Significance Line
Price Levels, Color: Toggles the visibility of the Profile Price Levels
Number of Rows: Specify how many rows each profile histogram will have. Caution, having it set to high values will quickly hit Pine Script™ drawing objects limit and fewer historical profiles will be displayed
Profile Width %: Alters the width of the rows in the histogram, relative to the profile length
Profile Range Background Fill: Toggles the visibility of the Profiles Range
🔶 RELATED SCRIPTS
Liquidity-Sentiment-Profile
Buyside-Sellside-Liquidity
ICT-Concepts
在脚本中搜索"ict"

Liquidity Sentiment Profile [LuxAlgo]The Liquidity Sentiment Profile is an advanced charting tool that measures by combining PRICE and VOLUME data over specified anchored periods and highlights within a sequence of profiles the distribution of the liquidity and the market sentiment at specific price levels.
The Liquidity Sentiment Profile allows traders to reveal significant price levels, dominant market sentiment, support and resistance levels, supply and demand zones, liquidity availability levels, liquidity gaps, consolidation zones, and more based on price and volume data.
Liquidity refers to the availability of orders at specific price levels in the market, allowing transactions to occur smoothly.
🔶 USAGE
A Liquidity Sentiment Profile is a combination of a liquidity and a sentiment profile, where the right part of the profile displays the distribution of the traded activity at different price levels and the left part displays the market sentiment at those price levels.
The Liquidity Sentiment Profiles are visualized with different colors, where each color has a different meaning.
The Liquidity Sentiment Profiles aim to present Value Areas based on the significance of price levels, thus allowing users to identify value areas that can be formed more than once within the range of a single profile.
Level of Significance Line - displays the changes in the price levels with the highest traded activity (developing POC)
🔶 SETTINGS
The script takes into account user-defined parameters and plots the profiles, where detailed usage for each user-defined input parameter in indicator settings is provided with the related input's tooltip.
🔹 Liquidity Sentiment Profiles
Anchor Period: The indicator resolution is set by the input of the Anchor Period, the default option is AUTO.
🔹 Liquidity Profile Settings
Liquidity Profile: Toggles the visibility of the Liquidity Profiles
High Traded Nodes: Threshold and Color option for High Traded Nodes
Average Traded Nodes: Color option for Average Traded Nodes
Low Traded Nodes: Threshold and Color option for Low Traded Nodes
🔹 Sentiment Profile Settings
Sentiment Profile: Toggles the visibility of the Sentiment Profiles
Bullish Nodes: Color option for Bullish Nodes
Bearish Nodes: Color option for Bearish Nodes
🔹 Other Settings
Level of Significance: Toggles the visibility of the Level of Significance Line
Profile Price Levels: Toggles the visibility of the Profile Price Levels
Number of Rows: Specify how many rows each profile histogram will have. Caution, having it set to high values will quickly hit Pine Script™ drawing objects limit and fewer historical profiles will be displayed
Profile Width %: Alters the width of the rows in the histogram, relative to the profile length
Profile Range Background Fill: Toggles the visibility of the Profiles Range
🔶 LIMITATIONS
The amount of drawing objects that can be used is limited, as such using a high number of rows can display fewer historical profiles and occasionally incomplete profiles.
🔶 RELATED SCRIPTS
🔹 Buyside-Sellside-Liquidity
🔹 ICT-Concepts
🔹 Swing-Volume-Profiles

Market Structure CHoCH/BOS (Fractal) [LuxAlgo]The Market Structure CHoCH/BOS (Fractal) indicator is an experimental take on classical market structure, whereas fractal patterns are used for their construction instead of swing points.
Compared to utilizing swing points for highlighting market structure like our Smart Money Concepts indicator , fractal-based market structure can appear as more adaptive, however, it can also be more restrictive when it comes to returning swing points which can cause the indicator to miss reversals in some cases.
If enabled from within the settings, users can see support and resistance levels returned from the detected market structure with breakouts highlighted on the chart. Alongside this feature, an additional dashboard showing the structure to fractal structure percentage is also provided.
🔶 SETTINGS
Length: Length of the fractal patterns to detect.
🔹 Style
Bullish Structures: Show bullish structures.
Bearish Structures: Show bullish structures.
Support: Show support levels.
Resistance: Show resistance levels.
🔹 Dashboard
Show Dashboard: Show structure to fractal percentage dashboard on the chart.
Location: Location of the dashboard on the chart.
Size: Dashboard size.
🔶 USAGE
Market structure is commonly used to determine trend direction by using price positions relative to prior swing points. Using fractal patterns to determine market structure can allow users to obtain shorter, more frequent structure labels.
Market structure is commonly classified as follows:
Change of Character (CHoCH), also referred to as Market Structure Shift (MSS)
Break of Structure (BOS), also referred to as Market Structure Break (MSB)
Change of Characters indicate a shift in the market trend, confirming trend reversals. Break of Structures on the other hand occur once a trend is already determined, confirming new higher highs/lower lows.
Using higher length values allow users to detect longer-term fractals, thus highlighting longer-term market structures. The image above detects fractal patterns made of 7 candles, even if the increment is only of 2 bars this significantly reduces the amount of detected market structure labels.
The result obtained by utilizing fractals and higher settings can be a more dynamic view of market structure, however, as seen in the image above this can introduce very significant delay compared to utilizing pure swing points.
🔹 Support/Resistance
The indicator also returns support/resistance levels constructed from the market structure, these levels are obtained similarly to order blocks, finding the minimum on the interval of a bullish market structure and the maximum of a bearish market structure.
Price reaching a support/resistance level can be expected to bounce from it. Once a level is broken, the support/resistance level will no longer extend, and a circle will be displayed highlighting the break.
While utilizing this script for fractal-based market structure, these levels can be useful to ensure all swing points are still considered by the user with the possibility of the indicator missing reversals due to its calculation not being based on swing points themselves.
🔹 Dashboard
The dashboard reports the structure to fractal percentage, that is the amount of bullish/bearish market structures relative to the total amount of detected bullish/bearish fractal patterns.
This allows us to see how often a detected fractal pattern is used to display a market structure.
🔶 DETAILS
🔹 Fractals
In the context of technical analysis, Fractals refer to specific patterns that exhibit self-similarity at different scales or timeframes.
The most commonly known fractal pattern consists of a consecutive sequence of candles (more commonly 5), with the central candle being the lowest (in case of a bullish fractal) or highest (in case of a bearish fractal).
A bullish fractal has candles on the right side of the central candle with increasing lows, while candles on the left side have decreasing lows.
A bearish fractal has candles on the right side of the central candle with decreasing highs, while candles on the left side have increasing highs.
🔶 RELATED SCRIPTS
🔹 Smart Money Concepts
🔹 Market Structure Trailing Stop
🔹 ICT Concepts

30MIN CYCLE█ HOW DOES IT WORK?
The known 90 min cycle is used as one killzone. But actually all 18 min are relevant to search for a trade. All 18 min when a new box starts only then is the placement of an order valid. If the entry candle isn't in a box then it will probably fail. The boxes should only be used in the M1 or M5 timeframe. The best hitrate is in the M1 timeframe. Included are the last 48 "Mini-Killzones" für intraday trading and backtesting. These "Mini-Killzones" can be used with the "Liquidity Inducement Strategy".
█ WHAT MAKES IT UNIQUE?
This is the first indicator on tradingview that shows all mini-killzones for trading and backtesting a whole tradingday. The well-known killzones of ICT are from 08:00-11:00 and 14:00 - 17:00 (UTC+1) but with this indicator there is finally a refinement of the ICT Smart Money Concept killzones.
█ HOW TO USE IT?
For a proper use of this indicator we suggest to know already at least SMC or better Liquidity Indcuement Trading. This indicator is a further confluence before placing an order. After you made your setup you will have these mini-killzones as a confluence. We don't suggest to open a trade only according to this indicator.
█ ADDITIONAL INFO
This indicator is free to use for all tradingview users.
█ DISCLAIMER
This is not financial advice.

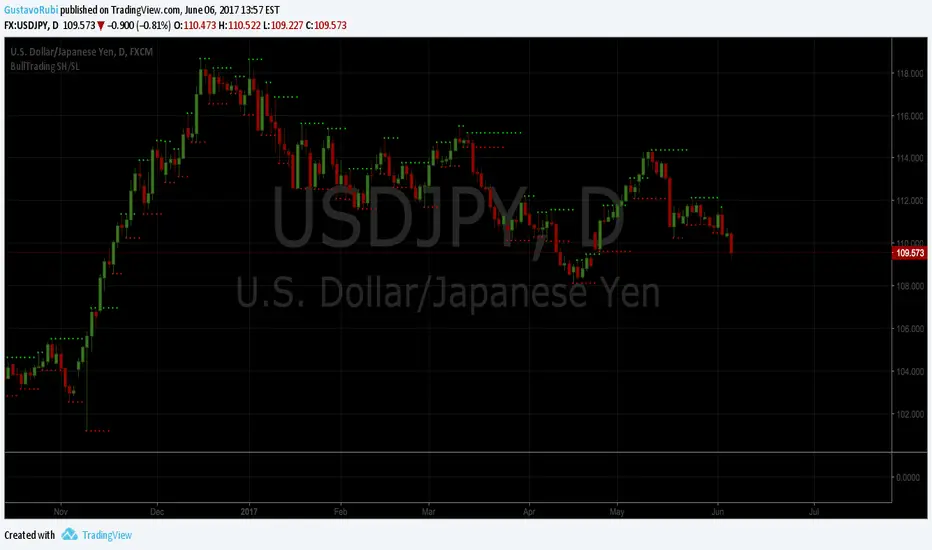
BullTrading SwingHigh/SwingLowTraders, good afternoon... are you in a mood for an excellent Institutional Trading Course?
Best of all for FREE!! (please use this valuable information with respect, there are people selling the information contained in this course as their own).
This guy has more than 20 years of trading experience under his belt. This information is a real gem for any trader, no matter the timeframe you trade. This script is a tribute for ICT production and shows the swing highs and swing lows used on institutional trading (Use it in D and 4H timeframes resolution for analysis in order to apply manual trading in lower timeframes).
Here is the link to the ICT Sniper Institutional Trading Course. Enjoy www.dropbox.com
STRUCTUREX OPTIONS CONTEXT - Smart Market Bias Framework█ WHAT THIS INDICATOR DOES
STRUCTUREX OPTIONS CONTEXT is a pre-trade decision framework, not a signal generator.
It answers five critical questions before a trader opens an options chain or considers execution:
- What is the directional bias? (Bull / Bear / Neutral)
- Is trading allowed, cautioned, or blocked right now?
- Is the market trending or ranging?
- Is volatility in expansion or decay risk?
- Is the current session suitable for trading?
This tool is designed to filter bad trades, protect against chop, and improve discipline.
█ WHAT THIS INDICATOR DOES NOT DO
- No BUY or SELL signals
- No trade entries or exits
- No option chain analysis
- No strike, expiry, or contract selection
- No profit, performance, or financial claims
- No alerts in v1.0
This indicator provides context only, not trading advice.
█ WHO THIS IS FOR
- Options traders (direction & permission before opening chains)
- Futures, forex, crypto, and equity traders (bias & regime context)
- Discretionary traders who already have an execution strategy
- Traders who want fewer trades, better timing, and clearer conditions
█ SUPPORTED MARKETS
Although designed for options decision-making, this indicator works on any chart:
- Indices (SPX, NQ, ES, DAX, FTSE)
- Stocks & ETFs (QQQ, SPY, AAPL, TSLA, etc.)
- Forex pairs
- Crypto assets
The logic is applied to the underlying price, which is exactly how professional options traders operate.
█ HOW TO USE
Best results using this stack order:
1. STRUCTUREX SESSIONS (bottom layer)
2. STRUCTUREX OPTIONS CONTEXT (middle layer)
3. STRUCTUREX CORE (top layer - structure/liquidity)
Practical Example:
- Bias = BULL
- Permission = GO
- Regime = TREND
- Environment = EXPAND
Only then does a trader consider opening the options chain.
If Permission = NO, do nothing.
█ WORKS STANDALONE OR STACKED
This indicator works perfectly on its own for bias and permission context.
For complete market analysis, stack with other STRUCTUREX modules:
STRUCTUREX SESSIONS — Session timing and kill zone visualization
STRUCTUREX CORE — Market structure, order blocks, and liquidity zones
Recommended stack order (bottom to top):
1. SESSIONS (timing context)
2. OPTIONS CONTEXT (bias & permission)
3. CORE (structure & zones)
Each module is independent — use what fits your workflow.
█ HUD BREAKDOWN
BIAS
- ▲ BULL — Bullish directional bias
- ▼ BEAR — Bearish directional bias
- ◆ NEUTRAL — No clear direction
PERMISSION
- ● GO — Conditions acceptable
- ◐ WAIT — Reduced quality environment
- ○ NO — Trading blocked
REGIME
- ↗ TREND — Market trending
- ↔ RANGE — Market ranging/consolidating
ENVIRONMENT
- ◉ EXPAND — Volatility expansion (momentum favorable)
- ◎ DECAY — Chop or volatility compression (theta risk)
SESSION
- □ OPEN — Inside allowed kill zone
- ■ CLOSED — Outside session window
█ RISK MODES
- Conservative — Strict thresholds, fewer trades
- Balanced — Default, professional discretion
- Aggressive — Earlier bias recognition (higher risk)
█ VISUAL CONTROLS
- HUD Size: Small / Normal / Large
- HUD Position: 8 screen positions available
- HUD Mode: Minimal / Clean / Detailed
- Optional background tint
- Optional state-change markers
All visuals are non-intrusive and optimized for live trading.
█ SETTINGS OVERVIEW
Quick Start:
- Enable/Disable module
- Risk Mode selector
- HUD Display mode
Decision Engine:
- Trend, Momentum, Location components
- EMA length and ATR multiplier
Session Filter:
- London and NY Kill Zone windows
- Time zone selection
Regime & Volatility:
- ATR-based trend detection
- Chop detection sensitivity
█ IMPORTANT DISCLAIMER
This indicator is not financial advice. It does not provide trade signals, entry points, exit points, or profit guarantees. All trading decisions remain the sole responsibility of the user. Use at your own risk.
█ VERSION
v1.0.0 — Initial Release
- Directional bias engine
- Trade permission framework
- Regime & volatility context
- Session gating
- Professional HUD interface

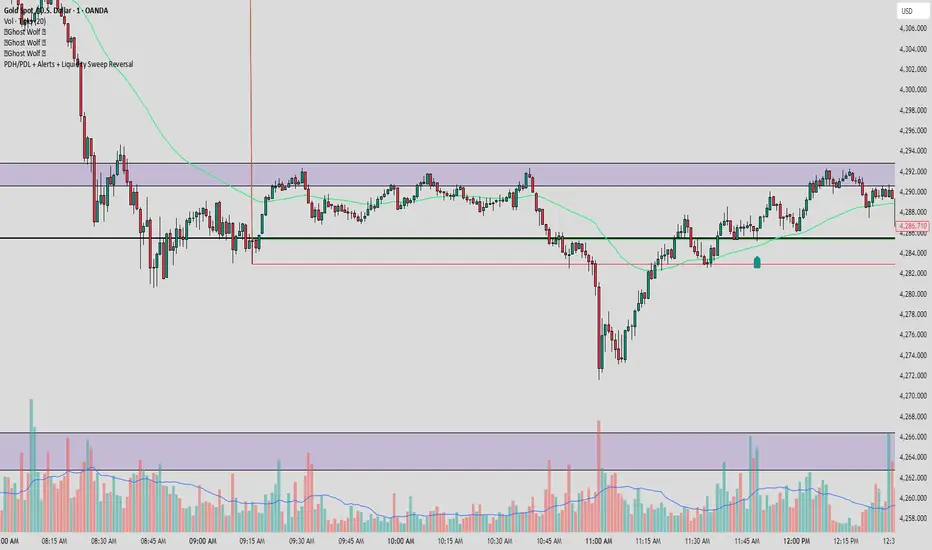
PDH/PDL + Alerts + Liquidity Sweep ReversalThis indicator is designed for traders who utilize Price Action to identify high-probability reversal zones at daily liquidity levels. It automatically plots the Previous Day High (PDH) and Previous Day Low (PDL) and monitors them for institutional "fake-outs" or liquidity sweeps.
Core Functionality
Daily Liquidity Levels: Automatically fetches and plots the PDH and PDL with custom labels and line styles.
Strict Reversal Logic: Unlike standard breakout indicators, this script looks for specific "trap" behavior where price pierces a level and is immediately rejected.
Institutional Precision Tooltips: Includes built-in precision guides for Wick Percentages and Lookback counts based on professional trading standards.
The "Strict Reversal" Setup
The indicator only triggers a Buy/Sell label when three specific criteria are met:
The Lookback: The level must have been respected as a boundary for a user-defined number of candles (Default: 7), confirming its strength.
The Sequence: The candle must open on the "safe" side of the level, pierce through it to grab liquidity, and then close back on the original side.
The Rejection (Wick %): The candle must leave a significant wick (Default: 72%). This 72% threshold aligns with the 2.5x Wick-to-Body ratio, signaling a violent institutional rejection.
Alert Options
The script features four consolidated alert conditions for seamless automation:
Sell Signal (Rejection): Triggers on strict bearish wick sweeps at key levels.
Buy Signal (Rejection): Triggers on strict bullish wick sweeps at key levels.
Price Cross Up: Alerts when price breaks above either PDH or PDL.
Price Cross Down: Alerts when price breaks below either PDH or PDL.
How to Use
Scalping: Use a 3–5 candle lookback on the 1m or 5m timeframe.
Intraday Reversals: Use the 7–10 candle lookback on the 5m or 15m timeframe for standard SMC setups.
Swing Trading: Use the 15+ candle lookback on the 1h or 4h timeframe to target major daily liquidity pools.
STRUCTUREX SESSIONS - Smart Market Session ContextSTRUCTUREX SESSIONS is a clean, lightweight market session visualization tool that helps traders understand when different global markets are active.
█ WHAT IT DOES
This indicator displays:
- Session Boxes: Visual background for Asia, London, and New York sessions
- Session Opens: Horizontal line marking each session's opening price
- Session Transitions: Vertical markers at London and NY open times
- Kill Zones: Optional high-probability trading windows (London/NY open periods)
█ WHAT IT DOES NOT DO
- No BUY/SELL signals — this is context only
- No alerts or webhooks
- No regime detection — use STRUCTUREX CORE for that
█ HOW IT WORKS
The indicator uses TradingView's time() function to detect when price is within each session window. Sessions are fully customizable with hour inputs. Kill zones support minute-precision timing (e.g., 13:30-15:30 for NY).
Session detection includes safety guards to prevent issues if start and end times are set equal.
█ DEFAULT SESSION TIMES
- Asia: 00:00 - 07:00
- London: 07:00 - 12:00
- New York: 12:00 - 17:00
- London Kill Zone: 07:00 - 09:00
- NY Kill Zone: 13:30 - 15:30
All times reference your selected time zone (Exchange, UTC, or specific city).
█ PRESETS
- Minimal: Session boxes only, no labels or opens
- Clean: Session boxes + open lines, labels optional
- Detailed: All features enabled (boxes, opens, labels, transitions)
█ HOW TO USE
1. Add to chart — default "Clean" preset works for most traders
2. Choose your time zone reference (Exchange recommended for most)
3. Enable Kill Zones if you trade London/NY open strategies
4. Adjust session times if your broker uses different hours
█ STACKING WITH STRUCTUREX CORE
Add SESSIONS first (bottom layer), then STRUCTUREX CORE on top. Sessions provide timing context for when to look for setups; CORE provides the actual structure and zones.
█ SETTINGS OVERVIEW
Quick Start:
- Master toggles for Sessions, Opens, Transitions, Kill Zones
- Visual Preset selector
Time Reference:
- Exchange, UTC, or specific city time zone
Sessions:
- Individual enable toggles
- Start/End hour for each session
- Session label visibility
Session Opens:
- Line style (Solid/Dashed/Dotted)
- Line width
- Open label visibility
Kill Zones:
- London and NY kill zone windows
- Minute-precision timing support
Performance:
- Past sessions to display (0-5)
- Max boxes limit
█ NOTES
- Works on any market and timeframe
- Optimized for FX and Crypto
- Lightweight with minimal resource usage
- Part of the STRUCTUREX indicator suite

CRT+ Advance Engulfing | @stefandimovCRT+ Lite implements institutional-style Candle Range Theory logic to identify displacement-driven engulfing structures with precision.
The script focuses on wick-based liquidity grabs, strict body closes, and optional higher-timeframe confirmation to highlight structurally valid bullish and bearish reversals.
Includes a Daily-only multi-market scanner and a compact dashboard for fast top-down analysis.
Designed for traders who prioritize structure, execution precision, and HTF alignment.

Auction Imbalance And Rebalance IndicatorThis indicator marks areas of Internal Range Liquidity along with Ecternal Range Liquidity

NY LONDON LUNCH AUTO**NY London Lunch Auto** is a precision session-anchor indicator designed for traders who focus on institutional timing and liquidity behavior.
This script automatically marks the **high and low of three key 15-minute New York session candles**:
• **3:00 AM NY** — London session expansion
• **8:00 AM NY** — New York open / kill zone
• **2:00 PM NY** — NY lunch / power hour transition
Each time one of these candles prints on the **15-minute chart**, the script captures its exact high and low and extends them forward as horizontal levels.
The levels remain **locked and unchanged** until the next key session candle appears, ensuring clean, non-repainting reference zones.
### Key Features
• Works **exclusively on the 15-minute timeframe**
• Automatically updates at **3AM, 8AM, and 2PM NY time**
• Levels stay fixed — no drifting or recalculation
• Clean, minimal design with customizable colors
• Ideal for liquidity sweeps, displacement, and ICT-style execution models
This indicator is built for traders who want **clarity, patience, and structure**, not clutter. It pairs seamlessly with liquidity sweep, displacement, and fair value gap strategies.

Displacement## Displacement Indicator (Institutional Momentum Filter)
This indicator highlights **true price displacement** — candles where price moves with **abnormal force relative to recent volatility**.
It is designed to help traders distinguish **real momentum** from normal market noise.
Displacement often precedes:
- Breaks of structure
- Fair Value Gaps (FVGs)
- Strong continuation or meaningful pullbacks
This tool focuses on **confirmation**, not prediction.
---
### 🔍 How Displacement Is Defined
A candle is marked as *displacement* only when **all conditions are met**:
• Candle body is larger than a multiple of ATR (volatility-adjusted)
• Candle body makes up a high percentage of the full candle (strong close)
• Directional conviction (bullish or bearish close)
This filters out:
- Small or average candles
- Wick-heavy indecision
- Low-quality breakouts
---
### 🎯 What This Indicator Is Best Used For
✔ Confirming impulsive moves
✔ Validating structure breaks
✔ Anchoring Fair Value Gaps
✔ Filtering low-probability setups
✔ Identifying institutional participation
Works best on **M5, M15, and H1**, especially during **London and NY sessions**.
---
### ⚠️ Important Notes
• This is **not** a buy/sell signal by itself
• Best used with trend, structure, or liquidity context
• Not designed for ranging or low-volatility markets
Think of this indicator as a **momentum truth filter** —
if displacement is missing, conviction is likely missing too.
---
### ⚙️ Inputs Explained
• ATR Length – defines normal volatility
• ATR Multiplier – how aggressive displacement must be
• Minimum Body % – ensures strong candle closes
All inputs are adjustable to fit different markets and styles.
---
### 🧠 Philosophy
Displacement reflects **commitment**, not anticipation.
This tool helps you wait for **proof**, not hope.
---
If you want, I can:
- Tighten this for **ICT-style language**
- Rewrite for **beginner clarity**
- Add a **“How I personally use it”** section
- Optimize it for **TradingView algorithm visibility**
**Tell me which you want changed.**

Liquidity Pools Smart Entry + Multi-TF Targets + VWAPOverview
This indicator is designed to help traders identify high-probability institutional-style entries using concepts from ICT (Inner Circle Trader) methodology. It combines liquidity pool detection, fair value gaps (FVG), swing levels, killzones, ATR-based targets, VWAP bias, and optional multi-timeframe analysis.
The script provides visual trade signals and a green-light confirmation system to streamline decision-making and reduce overtrading.
Key Features
Market Structure
Detects CHoCH (Change of Character) and BOS (Break of Structure).
Marks bullish and bearish breaks with labels on the chart.
Liquidity & Swings
Highlights Swing High/Low liquidity zones (SSL/BSL).
Shows horizontal swing lines for reference.
Fair Value Gap (FVG) Detection
Bullish and bearish gaps are plotted as shaded boxes.
Identifies potential institutional entry zones.
Killzones
Highlights London and New York sessions.
Helps align trades with high liquidity periods.
VWAP Filter
Plots the intraday VWAP.
Optional VWAP bias filter ensures trades follow intraday institutional flow.
Multi-Timeframe Confirmation
Supports 5-minute entry confirmation.
Shows SL/TP for both current TF and 5-min TF signals.
ATR-Based Stops & Targets
Entry signals automatically calculate SL (1.5 ATR) and TP (ATR x multiplier).
Customizable ATR multiplier.
Trade Light System
Visual green/red/gray indicators:
🟢 Green: All bullish conditions aligned → LONG allowed.
🔴 Red: All bearish conditions aligned → SHORT allowed.
⚪ Gray: Wait → conditions not aligned.
Inputs
Input Description
Show CHoCH/BOS Toggle structure labels on/off
Show Killzones Toggle session backgrounds on/off
Show Swing Liquidity Show SSL/BSL swing points
Show Horizontal Lines Extend swing lines horizontally
Show FVG Zones Show Fair Value Gaps
Show VWAP Display intraday VWAP
Swing Length Number of bars to calculate swing pivots
ATR Target Multiplier Multiplies ATR for TP calculation
Use HTF 200 EMA Filter Filter entries with higher timeframe trend
Use RSI Filter Filter entries using RSI 14
Use Volume Filter Filter entries with high volume confirmation
Use ATR Filter Filter entries based on ATR expansion
Use VWAP Filter Only allow trades in VWAP direction
How to Read the Chart
Structure Labels
BOS ↑ / BOS ↓: Breaks of structure showing trend direction.
Swing Liquidity
SSL (blue): Bullish swing low liquidity.
BSL (red): Bearish swing high liquidity.
FVG Zones
Green boxes: Potential bullish liquidity gaps.
Red boxes: Potential bearish liquidity gaps.
Killzones
Green background: London session.
Blue background: New York session.
VWAP
Purple line: Intraday volume-weighted average price.
Trade Lights
🟢 Green: All bullish conditions met — LONG ready.
🔴 Red: All bearish conditions met — SHORT ready.
⚪ Gray: Wait — conditions not aligned.
Entry Labels
Shows Entry price, SL, TP.
Separate labels for current TF and 5-min confirmation.
How to Use
Step 1: Identify Market Bias
Check HTF EMA: price above → bullish trend, below → bearish trend.
Check VWAP (if enabled): trade in direction of VWAP for institutional alignment.
Check Killzones: prefer entries during London or New York sessions.
Step 2: Confirm Entry Conditions
Wait for BOS / CHoCH to align with your trend.
Look for FVG zone and SSL/BSL liquidity.
Ensure RSI, ATR, Volume, VWAP filters (if enabled) all confirm.
Green/red Trade Light should be active.
Step 3: Place Trade
Use Entry Label price as reference.
SL: 1.5 ATR away.
TP: ATR x multiplier away.
Optional: check 5-min multi-TF confirmation label for additional confidence.
Step 4: Manage Trade
Follow ATR-based SL/TP.
Move stop to break-even after partial target if desired.
Only take trades when Trade Light is GREEN (LONG) or RED (SHORT).
Best Practices
Combine with volume profile or order block analysis for higher precision.
Avoid trading outside killzones.
Use multi-TF confirmation for safer entries.
Adjust ATR multiplier according to market volatility.

Ghost Scalp Protocol By [@Ash_TheTrader]
# 👻 GHOST SCALP PROTOCOL
### 💀 Stop Getting Trapped. Start Tracking the Banks.
Most retail traders lose because they enter exactly where institutions are exiting. They get caught in **"Stop Hunts"** and **"Fake-Outs."**
The **Ghost Scalp Protocol** is not just an indicator; it is a complete institutional trading system designed for **M1 & M5 Scalpers**. It combines **Smart Money Concepts (SMC)** with a **Physics-Based Momentum Engine ($p=mv$)** to detect high-probability reversals.
---
### ⚛️ THE LOGIC: 3-STAGE CONFIRMATION
This algorithm does not rely on lagging indicators. It uses a 3-step "Protocol" to validate every trade:
**1. THE GHOST TRAP (Liquidity Sweeps)**
* The script automatically draws "Ghost Lines" at key Swing Highs/Lows where retail Stop Losses are hiding.
* It waits for price to **sweep** these levels (Stop Hunt).
* **The Signal:** A Neon **Skull (☠️)** appears *only* if price aggressively rejects the level with high volume. This is the "Turtle Soup" pattern.
**2. THE PHYSICS ENGINE ($p = mv$)**
* Momentum is not just price speed; it is **Mass (Volume) x Velocity (Range)**.
* The dashboard calculates the "Force" of every candle.
* **The Signal:** An **Arrow (⬆/⬇)** appears when momentum surges **5x** above the average. This confirms the banks are pushing the move.
**3. BANK BIAS (Elasticity Filter)**
* Markets move like a rubber band.
* The script calculates a hidden "Fair Value" baseline.
* It creates a **Bias**: It only looks for Shorts in **PREMIUM (Shorting)** zones and Longs in **DISCOUNT (Accumulating)** zones.
---
### 📊 THE SMART DASHBOARD (HUD)
A futuristic, non-intrusive Heads-Up Display keeps you focused on the data that matters:
* **🏦 BANK BIAS:** Tells you if Institutions are likely **Accumulating** or **Shorting**.
* **📈 HTF TREND:** Automatically checks the **1-Hour Trend**. Don't fight the tide.
* **🚀 MOMENTUM:** Real-time Physics calculation.
* **Green Text:** Acceleration (Move is getting stronger).
* **Red Text:** Deceleration (Move is dying).
* **🌍 SESSION:** Shows active Bank Sessions (Tokyo, London, NY).
* **⚠️ OVERLAP ALERT:** Flashes GOLD when London & New York are open simultaneously (Peak Volatility).
---
### 🔥 STRATEGY: HOW TO TRADE
Use this checklist to execute high-probability scalps:
#### 📉 SHORT SETUP (SELL)
1. **Liquidity:** Wait for price to break above a **Red Ghost Line** (Sweep Highs).
2. **Signal:** Wait for the **Pink Skull ☠️** (Trap Detected).
3. **Confluence:**
* Dashboard Bias says: **"SHORTING"**
* HTF Trend says: **"BEARISH 📉"** (Optional but recommended).
4. **Entry:** On the Close of the Skull candle.
5. **Stop Loss:** Just above the wick swing high.
#### 📈 LONG SETUP (BUY)
1. **Liquidity:** Wait for price to break below a **Blue Ghost Line** (Sweep Lows).
2. **Signal:** Wait for the **Blue Skull ☠️** (Trap Detected).
3. **Confluence:**
* Dashboard Bias says: **"ACCUMULATING"**
* HTF Trend says: **"BULLISH 📈"** (Optional but recommended).
4. **Entry:** On the Close of the Skull candle.
5. **Stop Loss:** Just below the wick swing low.
---
### 🏆 RECOMMENDED PAIRS & TIMEFRAMES
* **⚡ Best Timeframes:**
* **1 Minute (M1):** For aggressive "Sniper" entries (High Frequency).
* **5 Minute (M5):** The "Gold Standard" for balanced Scalping.
* **15 Minute (M15):** Safer, higher win-rate Day Trading.
* **💎 Best Assets:**
* **Gold (XAUUSD):** Highly effective on liquidity sweeps.
* **Indices:** US100 (Nasdaq), US30 (Dow Jones).
* **Crypto:** BTCUSD, ETHUSD (High volatility).
* **Forex:** GBPUSD, EURUSD (London/NY Session).
---
### 🛠️ SETTINGS & CUSTOMIZATION
* **Surge Factor:** Default is **5.0x**. Lower this to 3.0 if you want more aggressive Momentum Arrows.
* **Smart Sessions:** Automatically converts to **New York Time** (EST) regardless of your location. No more time zone math.
* **Visuals:** Designed with "Ghost Glow" technology—97% transparent backgrounds that look classy and don't clutter your chart.
---
**"The Ghost Algo sees what you can't."**
*Trade Safe. Trade Smart.*
**~ Ash_TheTrader**

Universe Structure & Trend Zone [All-in-One]**Overview**
The "Universe Structure & Trend Zone" is a comprehensive all-in-one trading toolkit designed to combine Institutional Trend Following with Smart Money Concepts (SMC/ICT). It helps traders identify the dominant trend direction while providing precise entry points based on Market Structure Breaks (MSB) and Order Blocks.
This script aims to filter out market noise by allowing trades only when Price Action aligns with the long-term trend (SMA Zone).
**Key Features**
1. **Market Structure Breaks (MSB) & ZigZag:**
- Detects structural shifts in price (Bullish/Bearish MSB).
- Uses a default Signal Length of 10 to filter out minor swings and focus on significant structural changes.
- Visualizes high and low pivot points.
2. **Smart Trend Zone (SMA 200 Filter):**
- Incorporates a 200-period SMA Zone (Institutional Level) to determine the macro trend.
- **Trend Filter Logic:** The indicator intelligently filters signals. It displays Bullish Order Blocks only when the price is trending *above* the SMA Zone, and Bearish Order Blocks only *below* it. This drastically reduces false signals in choppy markets.
3. **Order Blocks (OB) & Breaker Blocks (BB):**
- Automatically identifies high-probability Order Blocks and Breaker Blocks.
- Includes optional filters for Volume and Premium/Discount zones to validate the blocks.
- Features an auto-cleanup mechanism to remove invalid or broken boxes, keeping the chart clean.
4. **Hull Moving Average (HMA):**
- A fast-reacting 55-period HMA is included to visualize short-term momentum shifts (Green for Bullish, Red for Bearish).
5. **Smart Range (Support/Resistance):**
- Plots the dynamic Highest High and Lowest Low of the selected timeframe (default 4H) to show the current trading range and Equilibrium (EQ) level.
**How to Use**
* **Step 1:** Check the **SMA Zone** (Gray/Green/Red Band). If Price > Zone, look for Longs. If Price < Zone, look for Shorts.
* **Step 2:** Wait for a **Market Structure Break (MSB)** label in the direction of the trend.
* **Step 3:** Look for an entry at the retest of an **Order Block (OB)** or **Breaker Block (BB)**.
* **Step 4:** Use the HMA color change as a confirmation trigger or trailing stop guide.
**Settings**
* **Signal Length:** Default is 10 (Optimized for standard swings).
* **Trend Filter:** Enabled by default (Recommended to stay with the trend).
* **Display:** You can toggle MSB lines, Boxes, and Labels on/off to suit your visual preference.
**Disclaimer**
This indicator is for educational purposes only and does not constitute financial advice. Always use proper risk management.

Ghost Protocol: Smart Money HUD [Ash_TheTrader]👻 GHOST PROTOCOL: The Institutional HUD
"Stop trading blind. Start seeing where the Smart Money is hiding."
Most indicators lag. They tell you what happened. Ghost Protocol tells you what is happening right now by combining two powerful concepts: Volume Absorption (Whale Defense) and Kinematic Physics (Price Velocity).
This is not just an indicator; it is a complete Heads-Up Display (HUD) for scalpers and day traders on NQ, ES, Gold, and Crypto.
🧠 The Concept: Why It Works
Retail traders lose money for two reasons:
Selling into a bottom (where Whales are absorbing orders).
Buying a fake breakout (where price lacks the energy to continue).
Ghost Protocol solves both by visualizing the invisible battle between aggressive orders (Retail) and passive limit orders (Institutions).
🛠️ The 3 Core Features
1. The "Ghost Walls" (Reversal Detector) 🛡️
What it is: Detects when massive volume hits the market but Price fails to progress. This is Absorption. A "Whale" is using a Limit Order Wall to absorb panic selling or FOMO buying.
The Visual:
🟢 Green Ghost Bubble + Beam: Buyers are absorbing sellers. (Bullish Wall).
🔴 Red Ghost Bubble + Beam: Sellers are absorbing buyers. (Bearish Wall).
Sticky Tech: The bubbles "stick" to the wicks perfectly, regardless of zoom level.
2. The "Velocity Terminal" (Breakout Validator) 🚀
What it is: A Physics Engine for price. It calculates Jerk (Change in Acceleration). Standard breakouts often fail, but a breakout with high "Jerk" (Surge) rarely comes back.
The Visual:
🟣 Plasma Purple Candle: Valid Breakout. Price is moving with high physical energy. Safe to follow.
⚪ Grey/Dull Candle: Fakeout. Price broke a level but lacks energy. The move is likely a trap.
3. The Smart Money Dashboard 💻
A sleek, "Classy" panel in the bottom right corner.
Monitors both engines simultaneously:
GHOST WALL: Scans for Reversals (Buy/Sell Walls).
VELOCITY: Scans for Momentum (Surge/Fakeout).
🎯 How to Trade This Script
Strategy A: The "Whale Reversal" (Scalping)
Step 1: Wait for price to push hard into a level.
Step 2 : A Ghost Wall (Ghost Icon 👻) appears.
Step 3 : A vertical Neon Beam lights up the background.
Action: Take the reversal immediately. Place stop loss just behind the bubble.
Strategy B: The "Physics Breakout" (Trend Following)
Step 1: Price breaks a key resistance or support level.
Step 2: Look at the candle color.
If it is Plasma Purple: ENTER. The physics engine confirms true momentum.
If it is Grey: WAIT. It is likely a fakeout designed to trap you.
⚙️ Settings & Customization
Bubble Distance: Adjust how close the Ghost bubbles sit to the candles.
Sensitivity: Tune the "Jerk Threshold" for the physics engine.
Visuals: Toggle the Background Beams, Dashboard size, and Neon colors to fit your dark/light mode setup.
Created by @Ash_TheTrader Trade with the Whales, not against them.
NY 8:00 8:15 Candle High & LowThis indicator plots the high and low of the New York 8:00–8:15 AM (EST) 15-minute candle and extends those levels horizontally for the rest of the trading day
The levels are **anchored to the 15-minute timeframe
Designed for **session-based trading, liquidity sweeps, ICT-style models, and NY Open strategies.
Lines automatically reset each trading day at the NY open window.
Clean, lightweight, and non-repainting.
This script is ideal for traders who want consistent, reliable session levels without recalculation or timeframe distortion.
Custom versions available
If you’d like:
- Different sessions (London, Asia, custom hours)
- Multiple session ranges
- Labels, alerts, or strategy logic
- A full strategy version with entries, SL/TP, and risk rules
Feel free to reach out — happy to build custom tools to fit your trading model.

Index Construction Tool🙏🏻 The most natural mathematical way to construct an index || portfolio, based on contraharmonic mean || contraharmonic weighting. If you currently traded assets do not satisfy you, why not make your own ones?
Contraharmonic mean is literally a weighted mean where each value is weighted by itself.
...
Now let me explain to you why contraharmonic weighting is really so fundamental in two ways: observation how the industry (prolly unknowably) converged to this method, and the real mathematical explanation why things are this way.
How it works in the industry.
In indexes like TVC:SPX or TVC:DJI the individual components (stocks) are weighted by market capitalization. This market cap is made of two components: number of shares outstanding and the actual price of the stock. While the number of shares holds the same over really long periods of time and changes rarely by corporate actions , the prices change all the time, so market cap is in fact almost purely based on prices itself. So when they weight index legs by market cap, it really means they weight it by stock prices. That’s the observation: even tho I never dem saying they do contraharmonic weighting, that’s what happens in reality.
Natural explanation
Now the main part: how the universe works. If you build a logical sequence of how information ‘gradually’ combines, you have this:
Suppose you have the one last datapoint of each of 4 different assets;
The next logical step is to combine these datapoints somehow in pairs. Pairs are created only as ratios , this reveals relationships between components, this is the only step where these fundamental operations are meaningful, they lose meaning with 3+ components. This way we will have 16 pairs: 4 of them would be 1s, 6 real ratios, and 6 more inverted ratios of these;
Then the next logical step is to combine all the pairs (not the initial single assets) all together. Naturally this is done via matrices, by constructing a 4x4 design matrix where each cell will be one of these 16 pairs. That matrix will have ones in the main diagonal (because these would be smth like ES/ES, NQ/NQ etc). Other cells will be actual ratios, like ES/NQ, RTY/YM etc;
Then the native way to compress and summarize all this structure is to do eigendecomposition . The only eigenvector that would be meaningful in this case is the principal eigenvector, and its loadings would be what we were hunting for. We can multiply each asset datapoint by corresponding loading, sum them up and have one single index value, what we were aiming for;
Now the main catch: turns out using these principal eigenvector loadings mathematically is Exactly the same as simply calculating contraharmonic weights of those 4 initial assets. We’re done here.
For the sceptics, no other way of constructing the design matrix other than with ratios would result in another type of a defined mean. Filling that design matrix with ratios Is the only way to obtain a meaningful defined mean, that would also work with negative numbers. I’m skipping a couple of details there tbh, but they don’t really matter (we don’t need log-space, and anyways the idea holds even then). But the core idea is this: only contraharmonic mean emerges there, no other mean ever does.
Finally, how to use the thing:
Good news we don't use contraharmonic mean itself because we need an internals of it: actual weights of components that make this contraharmonic mean, (so we can follow it with our position sizes). This actually allows us to also use these weights but not for addition, but for subtraction. So, the script has 2 modes (examples would follow):
Addition: the main one, allows you to make indexes, portfolios, baskets, groups, whatever you call it. The script will simply sum the weighted legs;
Subtraction: allows you to make spreads, residual spreads etc. Important: the script will subtract all the symbols From the first one. So if the first we have 3 symbols: YM, ES, RTY, the script will do YM - ES - RTY, weights would be applied to each.
At the top tight corner of the script you will see a lil table with symbols and corresponding weights you wanna trade: these are ‘already’ adjusted for point value of each leg, you don’t need to do anything, only scale them all together to meet your risk profile.
Symbols have to be added the way the default ones are added, one line : one symbol.
Pls explore the script’s Style setting:
You can pick a visualization method you like ! including overlays on the main chart pane !
Script also outputs inferred volume delta, inferred volume and inferred tick count calculated with the same method. You can use them in further calculations.
...
Examples of how you can use it
^^ Purple dotted line: overlay from ICT script, turned on in Style settings, the contraharmonic mean itself calculated from the same assets that are on the chart: CME_MINI:RTY1! , CME_MINI:ES1! , CME_MINI:NQ1! , CBOT_MINI:YM1!
^^ precious metals residual spread ( COMEX:GC1! COMEX:SI1! NYMEX:PL1! )
^^ CBOT:ZC1! vs CBOT:ZW1! grain spread
^^ BDI (Bid Dope Index), constructed from: NYSE:MO , NYSE:TPB , NYSE:DGX , NASDAQ:JAZZ , NYSE:IIPR , NASDAQ:CRON , OTC:CURLF , OTC:TCNNF
^^ NYMEX:CL1! & ICEEUR:BRN1! basket
^^ resulting index price, inferred volume delta, inferred volume and inferred tick count of CME_MINI:NQ1! vs CME_MINI:ES1! spread
...
Synthetic assets is the whole new Universe you can jump into and never look back, if this is your way
...
∞

FxNeel SessionAll types of ICT session you can draw here. Like Asia, London, NY, New Close, CBDR, Asia Kill zone and also Silverbullet Time zone.

UK100 London Judas & IFVG SetupUK100 London Judas & IFVG Setup
Overview This indicator is a specialized trading tool designed to automate the ICT Judas Swing strategy specifically for the UK100 (FTSE 100) index during the London Market Open. It combines institutional time-based logic with price action confirmation using Inversion Fair Value Gaps (IFVG) to identify high-probability reversal setups.
How It Works The strategy is based on the concept that the initial move after the London Open is often a "fake-out" (manipulation) designed to trap retail traders and engineer liquidity before the true trend of the day begins.
Session & Opening Price:
The script marks the London Open price (default 09:00 Warsaw / 08:00 London time) with a dashed line.
This serves as the "line in the sand." Prices moving away from this line initially are monitored for manipulation.
Judas Swing (Liquidity Sweep):
If price moves BELOW the open, it is hunting Sell-Side Liquidity (trapping sellers).
If price moves ABOVE the open, it is hunting Buy-Side Liquidity (trapping buyers).
The Entry Trigger: Inversion FVG (IFVG):
The indicator scans for Fair Value Gaps (FVG) created during the manipulation phase.
BUY Signal: The price manipulates lower, creates a Bearish FVG (Red Box), but then aggressively reverses and closes ABOVE that gap. The gap is now "Inverted" (turns Green), acting as support.
SELL Signal: The price manipulates higher, creates a Bullish FVG (Green Box), but then aggressively reverses and closes BELOW that gap. The gap is now "Inverted" (turns Orange), acting as resistance.
Key Features
Automated Pattern Recognition: No need to manually draw gaps. The script detects valid FVG inversions that align with the Judas Swing logic.
Built-in Risk Calculator: The signal labels display the exact Lot Size you should use based on your account balance and risk percentage (default 0.5%). It calculates this dynamically based on the Stop Loss distance.
Institutional Targets: The indicator fetches H1 Fractals (Liquidity) from the 1-hour timeframe and plots them on your 1-minute chart as blue lines. These are your primary Take Profit (TP) levels.
Stop Loss Visualization: Automatically suggests a Stop Loss placement behind the swing high/low of the reversal structure.
How to Use
Timeframe: Set your chart to 1 Minute (1m).
Asset: UK100 (FTSE 100).
Wait: Allow the London session to open. Watch for price to move away from the opening line.
Execute: When a BUY or SELL label appears:
Enter the trade using the Lot Size shown on the label.
Set your Stop Loss at the price shown on the label.
Target the blue H1 Liquidity lines for profit taking.
Settings
Timezone: Set this to your chart/exchange timezone (Default: Europe/Warsaw).
Account Balance: Input your current trading capital (e.g., 100,000) for accurate risk calculations.
Risk Per Trade %: The percentage of your account you are willing to lose if the Stop Loss is hit (Standard: 0.5% - 1.0%).
Contract Size: The value of 1 point movement (Check your broker's specifications. Usually 1 for CFDs).
Alerts You can set a single alert in TradingView to capture all signals. Select the indicator and choose "Any alert() function call". You will receive a notification with the direction (Buy/Sell), Entry Price, and Lot Size.

Quarterly Theory The Quarterly Theory indicator is a refined analytical tool that applies the ICT (Inner Circle Trader) framework and fractal time principles. It divides market time into structured quarterly cycles, anchored by the True Open of each period, to provide precise signals for trade entry and exit. This approach is consistently effective across all timeframes—from yearly and monthly charts down to 90-minute sessions.
The core model defines four distinct market phases within each cycle:
Q1 – Accumulation: A consolidation phase where the market builds a base for the next move.
Q2 – Manipulation (Judas Swing): Characterized by deceptive, rapid price action designed to trap traders before a true trend emerges.
Q3 – Distribution: A period of high volatility as positions are unwound and transferred.
Q4 – Continuation/Reversal: The cycle concludes with the established trend either extending or reversing.
By leveraging smart algorithms, the indicator analyzes these phases to detect critical market structures such as liquidity zones, stop-runs, and high-probability price patterns. This synthesis of Quarterly Theory, fractal timing, and liquidity analysis delivers a data-driven edge, empowering traders to decode complex market behavior and execute informed, strategic trades.

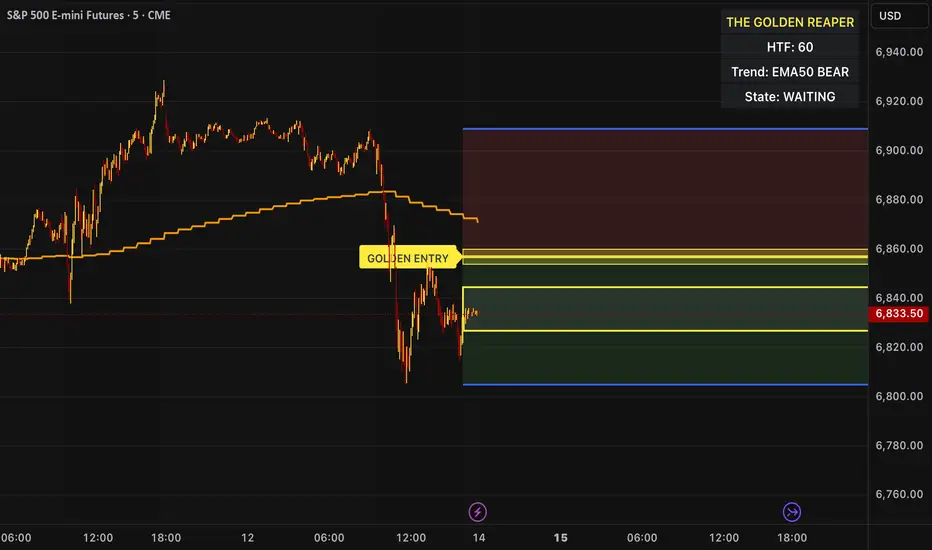
The Golden Reaper 🟡 THE GOLDEN REAPER
HTF OTE + EMA50 — Futures Scalping Framework
The Golden Reaper is a high-timeframe execution framework designed specifically for futures scalpers who trade with precision, patience, and structure.
This indicator focuses on HTF market structure, Optimal Trade Entry (OTE) zones, and equilibrium (50%) reclaim confirmation to identify high-probability execution areas for fast, controlled scalps.
It is not a signal spam tool.
It is a framework built for disciplined traders who wait for price to come to them.
⸻
🔑 Designed For
✔ Futures markets (ES, NQ, MNQ, MES, GC, MGC, CL, etc.)
✔ Scalpers & intraday traders
✔ 1H structure → 5m / 1m execution
✔ Traders who prefer few high-quality setups
⸻
🧠 Core Logic (How It Works)
1️⃣ High-Timeframe Structure (HTF)
The indicator identifies the most recent HTF swing high and low to define the active trading leg.
2️⃣ OTE Zone (Premium / Discount)
Price is expected to react within the OTE zone where liquidity is commonly targeted.
3️⃣ Golden Entry (EQ 50%)
The 50% equilibrium level is marked as the Golden Entry.
Price must reclaim this level for a setup to become valid.
4️⃣ Golden Execution Zone
After reclaim, a golden execution zone appears to define where entries are allowed.
5️⃣ EMA 50 Trend Filter
Trades are taken only in the direction of the HTF EMA 50 to avoid counter-trend scalps.
⸻
⚡ How Futures Scalpers Use It
Recommended Timeframes
• HTF Structure: 1 Hour
• Execution: 5 Minute / 1 Minute
Process
• Wait for price to reach the OTE zone
• Allow the setup to arm
• Enter only after price reclaims the Golden Entry
• Execute within the Golden Execution Zone
• Manage stops and targets manually
This approach helps scalpers:
✔ Avoid chasing price
✔ Reduce over-trading
✔ Improve entry precision
✔ Maintain consistency
⸻
🔔 Alerts Included
• OTE Touched – Setup is armed
• C-Reclaim Confirmed – Entry condition met
(Alerts are designed to assist — not replace — trader judgment.)
⸻
⚠️ Important Notes
• Designed for futures markets only
• Best used with price action confirmation
• No built-in stop loss or take profit (manual risk management required)
• Not financial advice
⸻
🧬 Who This Indicator Is For
✔ Futures scalpers
✔ ICT / Smart Money traders
✔ Structure-based traders
✔ Traders who value patience over frequency
❌ Not for:
• Signal chasers
• Indicator stacking
• Automated trading
• Beginners who want instant entries
⸻
🟡 Created By
ChartReaper / Tactiko
Instagram:
@officialchartreaper
@tactiko