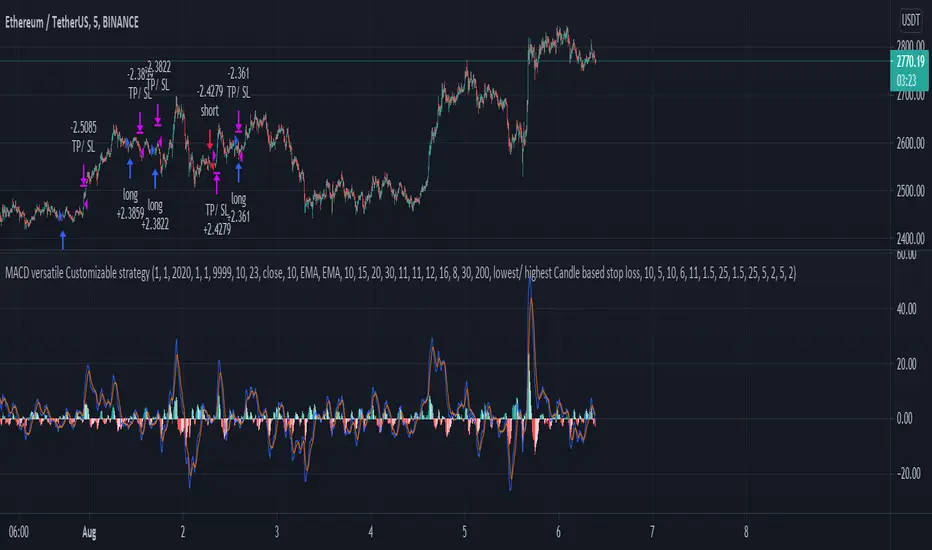
MACD with Support and Resistance - Signals, Alerts, TP and SLMACD with Support and Resistance - Signals Alerts SL and TP by Tech Store On
The script uses MACD for entering/exiting trades and support/resistance lines to take TP1 (take profit 1). Both MACD and support/resistance lines are fully configurable to your preference, and you can back-test it via TradingView. Once TP1 is taken, you can either set the indicator to close the trade at the end of the US trading session day (4PM ET) or you can continue taking partial profits where you wish or just wait until reversal signal alert.
For example: If you will be day trading SPY and you wish to close your positions no matter what right before the market closes (3:45PM ET > 15min before closes): Make sure to checkbox “Intraday – Close Position Before Market Closes” in the strategy/indicator Settings, so that you are alerted soon before the market closes, if you wish to continue holding the position – leave this checkbox unchecked.
SL: SL is set to be slightly above/below the MACD signal candle, which is best suited for this strategy from manual backtesting.
Strategy Take Profit Approach
While the initial position open and SL hit is always based on a closed candle bar (can’t do otherwise, as otherwise you will have 10s of fake signal alerts), there are 2 ways on trading this strategy in terms of TP1 / TP1 taken > back to Entry, which is based off Alert type.
You can switch this as you like within the indicator settings, “Checked: TP1/TP1 taken > back to Entry per Price Touch | Unchecked: per Candle Close”.
Candle Close vs Price Touch: with the Default method - Candle Close for an alert for TP1 or if price comes back to Entry after TP1 is taken will only be triggered once candle bar fully closes crossing the area, while Price Touch will alert when price touches the area before candle bar closes.
For example: your trade is running well, you grab TP1 and the price reverses and hits your trade Entry area. With Price Touch – you are immediately alerted to close your trade with no loss and with TP1 profit. With Candle Close - you will receive an alert only once candle bar fully closes on top of the Entry crossing it backwards, meaning it may lower your TP1 profit or even completely reverse the trade into loss in case it will be a huge candle bar for any reason. However, it may touch the Entry area, looking like the price is reversing, but then continue per initial trade direction, sometimes becoming a trend. So, while Price Touch seem like a more conservative approach, Candle Close can give you much bigger profits if you catch a trend, but you can always change it via the Settings.
Note: TradingView back-testing engine does not have a feature to open/close orders IMMEDIATELY via Price Touch trigger, but only when the candle closes after price touches the scripted area/line/etc., so you for the most accurate results, test your strategy out via Candle Close setting. Otherwise, decide yourself. I personally like more Candle Close since I can test it out via back-testing with the most accurate results.
Note: If you will be observing the strategy LIVE, during LIVE candle bar movement – it will look weird, like it’s placing an order after order during any trigger – this seem like a TradingView bug, but is only observational, once the candle bar is closed and you refresh TradingView it will all look correct.
Back-Testing
If you wish to do some back-testing, just modify the strategy/indicator Settings:
-----1) STRATEGY: This is for back-testing/experimenting with the script inputs.
----------a. You can setup a start date (date, month, year) from which it will start opening back-test trades, select a position size and select TP1 size, the idea here is to close half (or whatever you choose) portion of the trade once you hit your TP1, then to either close at small profit or to catch a trend and close the second portion of the position long way ahead from Entry, otherwise it will alert you to close the position if price comes back to Entry, at reversal signal or at the end of US trading session if the option for it is checked. If you wish to close the whole position at TP1, just enter the same amount for TP1 to match backtest position size. Otherwise you can experiment with TP1 sizing – try it out!
-----2) Feel free to experiment with MACD settings and with S&R Left/Right bars, you may be amazed how results will differ and find some really cool combinations!
-----3) Make sure you select/de-select “Intraday – Close Position Before Market Closes” setting depending on what you are back-testing and on which conditions
-----4) Note: If you wish to do some deep back-testing (1+ years), use the “Deep Backtesting” feature within Strategy Tester on the TradingView as otherwise it may show wrong results or even fail to compute the results
Add the alerts
-----Right-click anywhere on the TradingView chart
-----Click on Add alert
-----Condition: MACD with Support and Resistance - Signals
----------o Right underneath the condition click on the drop-down menu and select “alert() function calls only”
-----Expiration time: Whatever you wish
-----Alert actions: Whatever notifications you wish
-----Alert name: DO NOT TOUCH THIS
-----Hit “Create”
-----Note: If you change ANY Settings within the indicator – you must DELETE the current alert and create a new one per steps above, otherwise it will continue triggering alerts per old Settings!
- Note: If you add the alert while the script is currently “In Position” it will not know that. So either wait when there will be no position open at all or close your position partially if the bot opens it twice bigger or so in case per script the bot will think it is already in position.
Note: Because of the slippage and the order processing time between TradingView, AutoView and the Broker (it’s usually about a second or so), it is suggested to not use a timeframe lower than 1min. The script is working really well with 15M/H1 timeframes per my back-testing, but feel free to explore via Strategy Back-testing what’s best for the instrument you wish to trade.
在脚本中搜索"macd"

MACD ModifiedIn an attempt to improve the MACD for trading, I have added an alternative way to calculate the MACD Line and Overbought/Oversold (OB/OS) lines to filter signals.
The alternate calculation I named "Modified" and put the option to select it under "MACD Calculation" in the input menu. Traditionally the MACD is calculated as fastEMA - slowEMA, for "Modified" I changed the calculation to ((fastEMA - slowEMA) / slowEMA * 100). The goal of this change is to view the difference in MA as a percent of the slow. The hope is that this will compensate for securities that have had major gains or losses in their history.
For the OB/OS lines, I coded in three different ways to calculate them. Users can select which method they prefer in the input menu. The first is through pivot points. The script records the pivot points into an array and takes the average of the array. There are two arrays, one for the OB line and one for the OS line. I also added filters so it will only record pivots above/below a specific value. The crosses on the indicator are for debugging purposes only. They mark the pivots that were recorded into the arrays. The crosses are offset by the pivot strength and do not provide timely indications. All inputs are adjustable for the pivots in the "Pivots" section of the input menu. The second method for the OB/OS lines I added is Bollinger Bands. The user can choose to put it around the Signal or MACD line. The final method added is simply using the previous high/low pivot of the MACD line.

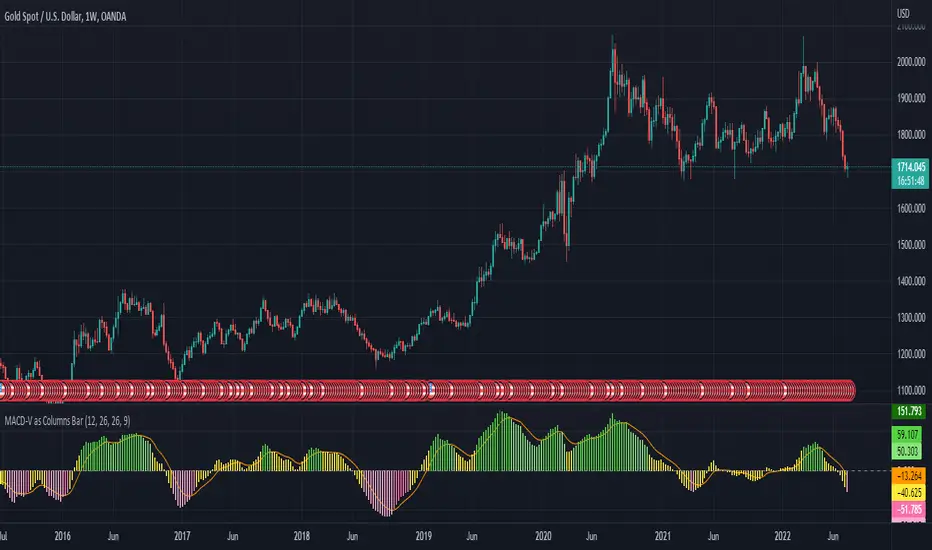
MACD-V as Columns BarI use MACD-V as Columns Bar and including the signal line
Not use MACD-V - Signal Line as Histogram
Enjoy!
MACD Scalper AnalysisThis is a scalper analysis movement designed around MACD and 200 EMA
The rules are simple:
For long we check if the close of the candle is above the ema200 and we have a crossover between macd and signal
Once this happens we analyse the next candle, if its close higher than open , we can consider it a win and if its close lower than open we consider a lose.
For short we check if the close of the candle is below the ema200 and we have a crossunder between macd and signal
Once this happens we analyse the next candle, if its close higher than open , we can consider it a loss and if its close lower than open we consider a win.
Once we have all of this we analyse the average percentage movement and establish if the specific asset or timeframe is worthy for us.
At the same time it can give a good idea if we can go with a divergence strategy, like for example we have a short entry, but we will actually go long and viceversa.
If you have any questions let me know !

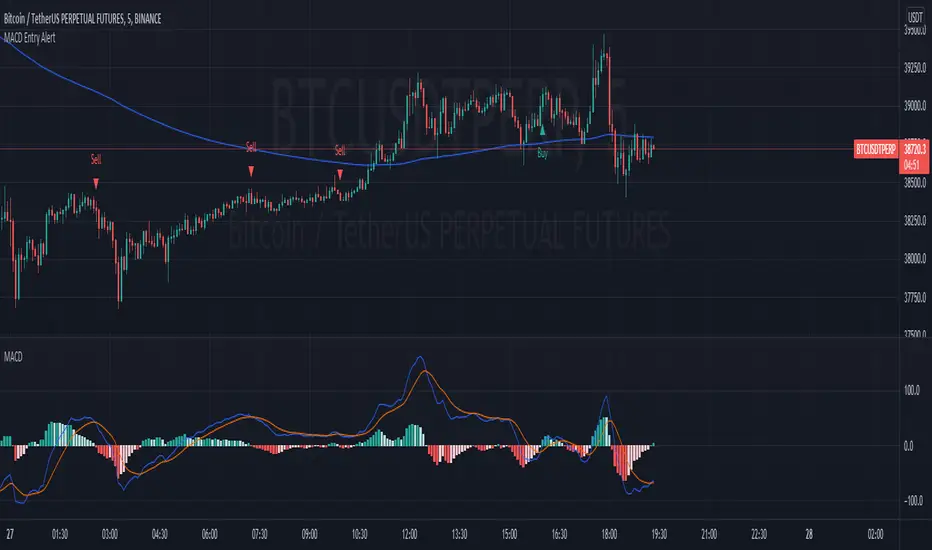
MACD Strategy AlertThis Indicator will only give you potential entry base on MACD strategy combine with a 200 EMA
-Sell when price under 200 ema and MACD is crossing the signal line above 0
-Buy when price above 200 ema and MACD is crossing the signal line under 0
-Sending Alert for each Potential Entry
MACD Strategy [Trading Nerd]This Strategy uses a EMA as a trend filter and MACD for entries. The stoploss can be calculated by the last highs/lows or by the ATR.
Entry Conditions
Long:
close price must be above the EMA
MACD-Line crossover MACD-Signal-Line
MACD-Signal- Line mus be below 0
Short:
close price must be below the EMA
MACD-Line crossunder MACD-Signal-Line
MACD-Signal- Line mus be above 0
Exit Conditions
The Stoploss can be set in two different ways:
1. By the calculated ATR value of the entry Candle. This Value can be multiplied with the ATR multiplier for SL .
For Longs: SL = entry Price - ATR * ATR-multiplier
For Shorts: SL = entry Price + ATR * ATR-multiplier
2. By the previous highest high or lowest low (also called Donchain Channels). The lookback length can be changed in the at Lookback length for HH/LL SL .
For Longs: SL = LL of the last X candles
For Shorts: SL = HH of the last X candles
Take Profit
The TP is calculated by the Risk * Risk Reward Ratio . The Risk Reward Ratio can be changed in the Settings. The Risk is the difference of entry price and stoploss price: Risk = absolute(entry price - stoploss price)
For Longs: TP = entry Price + Risk * Risk Reward Ratio.
For Shorts: TP = entry Price - Risk * Risk Reward Ratio.
Risk Management
You can set the Risk % per Trade in the settings. A Value of 2 means that the position size is calculated in a way that at a loosing trade the strategy will only loose 2% of the current capital (initial capital + net profit).
E.g.: The current capital is $1000 and a trade hits the SL. The strategy will only loose $20.
Info for Alerts: Alert message conversion of JSON Strings. You don't need to add any \n or \" to the alert String.
When you create the Alert the Message must be: {{strategy.order.alert_message}}

MACD Linear Regression by zdmreBoth the Moving Average Convergence Divergence (MACD) and the Linear Regression (LR) rank among the most popular momentum indicators used in trading. When used in combination with other technical indicators, both MACD and LR can offer value in validating trade opportunities to optimize your risk management practices.
While they represent a similar approach to evaluating trades, the functions of both MACD and LR are distinct, which makes them useful indicators to combine in trade evaluation. Here’s a look at how to use MACD and LR as part of your trade analysis.
***Use it at your own risk
If you have new ideas to improve this indicator then let me know please.
Keep Learning, Keep Earning
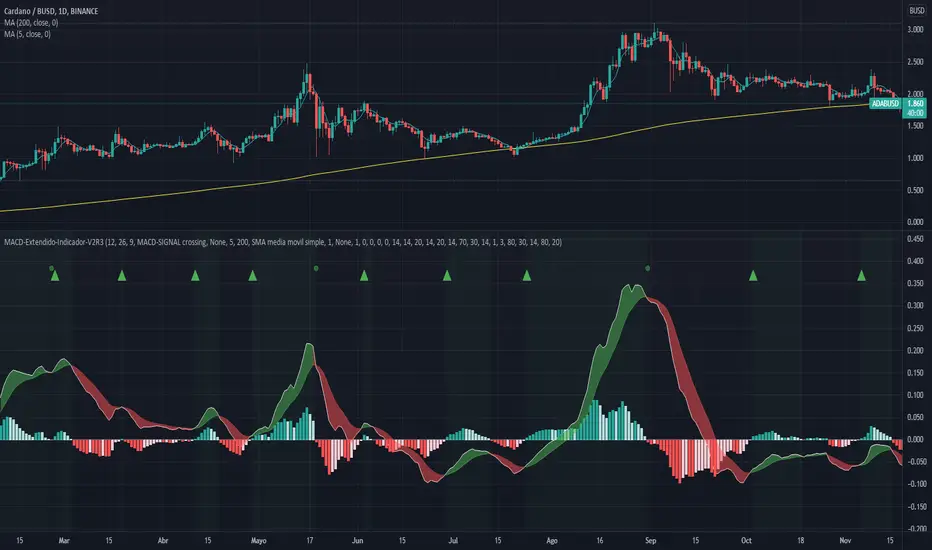
MACD-Extendido-Indicador por NeilMACD-Extendida-Estrategia
--------------------------------
DESCRIPTION
Resource that identifies entry and exit operations using the indicator
Average Convergence and Divergence Movements (MACD) and 5 strategies
INTERESTING
Novel strategies are implemented such as:
1. Overbought and oversold band to avoid horizontal movements
2. Control inputs and outputs at positions opposite the histogram line
3. Make a profit (take profit) without prior purchase orders
HOW DOES IT WORK (STRATEGIES)
1) Overbought and oversold:
Allows you to define an overbought upper band
Allows you to define an oversold ower band
Operations that occur within the band are ignored
2) Place of next operation (either side):
Indicates that the next operation can occur on either side of the histogram
3) Place of next operation (opposite side):
Indicates that the next operation must occur on the opposite side of the histogram
4) Take profit:
It allows defining the deviation in favor to execute a take profit.
It does not place a buy order at a distant point, instead it looks back and if the shift meets the expected deviation, take profit is executed
5) Loss control (stop loss):
It allows to define the deviation against to execute a stop loss.
It does not place a stop order at a distant point, instead it looks back and if the displacement meets the expected deviation the stop loss is executed
How to use it:
Press the "Indicators" option, go to the "Public Librarian" segment, write the name "MACD-Extendido-Indicador Neil", double-click on the record in question and you will have it added in your work panel, now, just It remains to be used to identify the inputs and outputs and you can do it visually or by defining the automatic notification alerts.
DESCRIPCION
Recurso que identifica operaciones de entradas y salida haciendo uso del indicador
Media Móvil de Convergencia/Divergencia (MACD) y 5 estrategias
NOVEDADES
Se implementan estrategias novedosas como:
1. Banda de sobrecompra y sobreventa para esquivar movimientos horizontales
2. Control de entradas y salidas en posiciones contrarias a la línea del histograma
3. Toma de ganancias (take profit) sin ordenes de compra previa
COMO FUNCIONA (ESTRATEGIAS)
1) Sobrecompra y Sobreventa:
Permite definir una banda superior de sobrecompra
Permite definir una banda inferior de sobreventa
Operaciones que ocurren dentro de la banda son ignoradas
2) Lugar de próxima operación (cualquier lado):
Indica que la próxima operación puede ocurrir en cualquier lado del histograma
3) Lugar de próxima operación (lado opuesto):
Indica que la próxima operación debe ocurrir en el lado opuesto del histograma
4) Toma de ganancias (take profit):
Permite definir la desviación a favor para ejecutar una toma de ganancia.
No coloca una orden de compra en un punto distante, en su lugar mira hacia atrás y si el desplazamiento cumple con la desviación esperada se ejecuta la toma de ganancia
5) Control de pérdida (stop loss):
Permite definir la desviación en contra para ejecutar una parada de pérdida.
No coloca una orden de parada en un punto distante, en su lugar mira hacia atrás y si el desplazamiento cumple con la desviación esperada se ejecuta la parada de la pérdida
Como usarlo:
Presione la opción "Indicadores", ubíquese en el segmento "Libreria Publica", escriba el nombre "MACD-Extendido-Indicador por Neil", haga doble clic sobre el registro en cuestión y lo tendrá agregado en su panel de trabajo, ahora, solo resta usarlo para identificar las entradas y salidas y puede hacerlo de forma visual o definiendo las alertas de notificación automática.
MACD, EMA, Know sure thing, Chopy Market StrategyHey there :)
This is the free version of the script. The following indicators / settings are missing:
- Support and resistance zones
- dynamic textboxes for alarms when using bots (3 Commas, Alertatron, etc.)
- a table showing the current position, indicators and other important information
With this script there is the possibility to completely customize the MACD . Starting with the MACD and signal line, the histogram and the color of the histogram.
Since the Pinecoders team has previously deleted the script, I will mention the fee settings in a bit more detail:
In this script a fee of 0.01% and a slipage of 15 was used. With each trade the total capital (100%) is used with a risk reward of 1 to 1.5.
The total capital, i.e. the risk, can be changed at any time under the "Settings" tab at "Equity".
I also added an EMA , the Know sure thing indicator and the Chopy Market indicator (by TradingRush) to the script to filter out bad trades.
The EMA:
Since the EMA is very reliable and shows whether there is an upward or downward trend, it should be used with the indicators in any case. It prevents long trades in downward movements and vice versa.
The KST Indicator:
The KST indicator has a similar movement as the MACD , but is by and large a bit more time delayed. It filters out false swings of the MACD and thus prevents bad trades.
The Chopy Market Indicator by Tradingrush:
The Chopy Market indicator, which was introduced by TradingRush in one of its videos, has the ability to detect sideways markets and block zones below this line for trades by means of a fixed value (the line).
To exit the trades, I added the following options:
ATR Exits. Exits based on past candles (lowest low, highest high).
Static exits based on set percentages.
In the next days I will create a tutorial for the script, just have a look on my profile.
If you have any questions about the script, let me know.

MACD, EMA, Know sure thing, Chopy Market - high adaptabilityHey there :)
This is the free version of the script. The following indicators / settings are missing:
- Support and resistance zones
- dynamic textboxes for alarms when using bots (3 Commas, Alertatron, etc.)
- a table showing the current position, indicators and other important information
With this script there is the possibility to completely customize the MACD . Starting with the MACD and signal line, the histogram and the color of the histogram.
Since the Pinecoders team has previously deleted the script, I will mention the fee settings in a bit more detail:
In this script a fee of 0.01% and a slipage of 15 was used. With each trade the total capital (100%) is used with a risk reward of 1 to 1.5.
The total capital, i.e. the risk, can be changed at any time under the "Settings" tab at "Equity".
I also added an EMA , the Know sure thing indicator and the Chopy Market indicator (by TradingRush) to the script to filter out bad trades.
The EMA:
Since the EMA is very reliable and shows whether there is an upward or downward trend, it should be used with the indicators in any case. It prevents long trades in downward movements and vice versa.
The KST Indicator:
The KST indicator has a similar movement as the MACD, but is by and large a bit more time delayed. It filters out false swings of the MACD and thus prevents bad trades.
The Chopy Market Indicator by Tradingrush:
The Chopy Market indicator, which was introduced by TradingRush in one of its videos, has the ability to detect sideways markets and block zones below this line for trades by means of a fixed value (the line).
To exit the trades, I added the following options:
ATR Exits. Exits based on past candles (lowest low, highest high).
Static exits based on set percentages.
In the next days I will create a tutorial for the script, just have a look on my profile.
If you have any questions about the script, let me know.
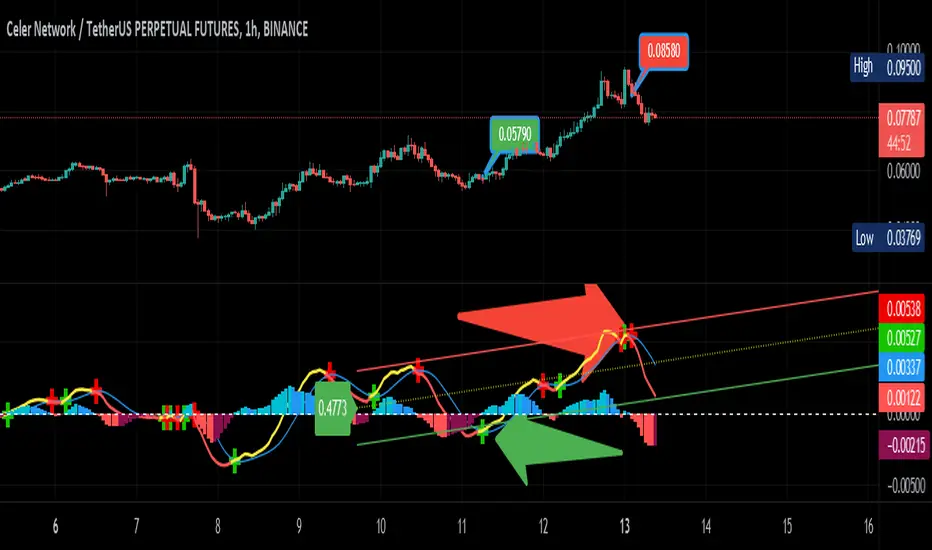
MACD hist divergence strategy with switch v2
sum Macd hist to compare their strength,the DIAMOND means total strength , if the strength divergence, the trend may change
Macd 面積比較力度, 鑽石代表總力度, 力度背離即可能發生反轉
for the bullish market, I will suggest you to close the sw of buying energy divergence ex:btc
對於大牛市會建議您將買點能量背離關掉ex 比特幣
this strategy only have long order by now
目前此策略只支援做多
按鈕簡介
switch info
1.macd 面積背離時價格是否有背離的開關
1.A divergence switch btw price and MACD hist
2.macd 快線下穿0軸賣出的選項
2. Once MACD fast_line crossunder 0 stop loss switch
3.the setting logic and method is like this
設定如下
A1. 大牛股 for bullish market
B1. 高勝率低利潤 for high winning rate but lower profit
C1 高頻適合小級別 for high frq trading, useful in low period
D1 極小級別 for extremeness low period

MACD + PSAR SetupThis indicator combines 3 elements:-
1. MACD which will act as a source of potential Buy Signal
2. PSAR which provides the confirmation for buy signal and for potential Buy on Dip Strategy
3. Breakout candles which provides the confirmation signal for Buy on Breakout strategy
4. The direction of the trend is provided by the Exponential Moving Average
The strategy is to have any counters which has triggered the MACD Golden Cross signal. These counters are to be out under watchlist for further confirmation.
The Buy Signal is confirmed when:-
1. Price is above EMA Direction(standard is set at 200)
2. PSAR has given the Buy Signal OR a Breakout Candle occurs.
Buy Signal is shown with a Green Diamond symbol whilst the Sell Signal is shown in Red Diamond Symbol.
The bullish and bearish condition is set via a green and red background
The MACD and PSAR codes are derived from the standard codes which is available in tradingview.

MacD Custom Indicator (updated to version 4)I updated existing script “ MacD Custom Indicator-Multiple Time Frame+All Available Options! ” originally created by ChrisMoody to Pine Script 4. version, so you can use it within your own strategy for algotrading or trading bots.

MACD BandsThis is MACD indicator on the price chart. You can read the same information as the original MACD but much more.
You can use it the same way as MACD but it won't use any space below your chart. Also you can use signal line and cloud as trend confirmation: e.g. if above them it can be a stronger uptrend.
The signal line (yellow by default) can be used as a support-resistance line.
If teal line is above maroon line, MACD is positive, otherwise it is negative
MACD value is the width of the cloud
Cloud color is green when MACD histogram is positive, red if negative
You can change MA types
MACD and histogram values can be seen in Data Window

MACD 50x Leveraged Strategy Real Equity Simulation Hello, I wrote this script to merge the two scripts I shared before.
The aim here is to see the real value of the state of the capital as a result of leveraged transactions and to combine both long and short directions.
Scripts :
MACD Long 50x Leverage Strategy :
MACD Short 50x Leverage Strategy :
The parameters have not changed so they are the same as the previous two scripts:
Adding margin: Forbidden or not specified. (Add Margin : No)
Position Size : %1 (0.01) (For each trade)
Stop-Loss : %2 (For each trade)
Long : Crossover(delta,0) (Standard MACD)
Long Exit : Long Stop Level or Short Entry
(In the case of Long Stop, all trades are closed and no positions are opened in short direction.)
Short : Crossunder(delta,0) (Standard MACD)
Short Exit : Short Stop or Long Entry
(In the case of Short Stop, all trades are closed and no positions are opened in the long direction.)
NOTE :
This is a simulation made using standard parameters, showing the state of the balance in very simple rules with leveraged transactions only.
The nice thing here is the direct observation of the results by making modifications on the strategy parameters.
Regards.

MACD Seasons by Dr Ken Longthis specific Moving Average Divergence Convergence Seasons Indicator is made by Dr Ken Long Tortoise Capital brings a unique way of the flow of the market, the 4 seasons are used to describe the areas of the MACD so for example when the area is below zero and hasn't crossed the EMA 5 we call that winter which is very bear bias, once you get support in winter and crosses above the EMA 5 we call that fall which is the first indication of support for price and some weakness toward the downside. if the MACD is above the zero line we call that summer which is a very bull bias valued area, and once it crosses below the EMA 5 then that's where we call fall mode showing us weakness and very slight indication of a possible reversal. the MACD can be both used for swing trade and day trading, it provides a unique insight to the markets showing the layers of a trend using seasons.

MACD with Lines - ChartWhat is MACD with Lines - Chart and why do you need it?
I use it for chart analysis to identify key macd /signal levels from which bullish / bearish market structure continues to develop.
Chart means that every Macd /Signal cross above/below the signal lines will be notified on your Chart and not on your MACD Indicator. To see them on your chart please choose "MACD with Lines - Default" in my library.
Once Signal, Macd or the Histogramm cross over or under your upper or lower signal line you will see background colors which you can adjust in the settings menu.
This small indicator is for a larger project which will be uploaded in several days/weeks.

MACD with Lines - DefaultWhat is MACD with Lines - Default and why do you need it?
I use it for chart analysis to identify key macd/signal levels from which bullish/bearish market structure continues to develop.
Default means that every Macd/Signal cross above/below the signal lines will be notified on your MACD Indicator and not on your chart. To see them on your chart please choose "MACD with Lines - Chart" in my library.
Once Signal,Macd or the Histogramm cross over or under your upper or lower signal line you will see background colors which you can adjust in the settings menu.
This small indicator is for a larger project which will be uploaded in several days/weeks.

MACD classic strategy setupsetup for a classic MACD strategy with some filter to choose.
it keep the default setup of MACD because is the most popular.
it place the stop loss and take profit based on the trading rush video of MACD, if you want a different profict factor you can change until to reach 3, over this as a fixed risk reward don't have so much sense

MACD With Trend Filter: Visual Backtest Module TemplateSample Strategy: MACD Crossover with trend filter options
MA Filter : Price Close Above MA, Search for Buy, Price Close Below MA, Search for Sell
ADX Filter : Take trade only when ADX is above certain treshold
MACD Signal : MACD Cross above signal line while under 0 line indicate Buy Signal
MACD Cross below signal line while above 0 line indicate Sell Signal
-----------------------------
Using Alert Module:
Enable Alert --> Enable TV's alert and plot signal to chart
Alert Type --> Set to take Buy only, Sell only or Both alert
----------------------------
Using Backtest Module:
Enable Backtest --> Enable Backtest simulation
Backtest Type --> Set to take Buy only, Sell only or Both
SL Type -->
ATR : Set SL in ATR times Multiplier below/above entry price
Fixed : Set SL in fixed point below entry point (in 'Dollar'). e.g. for Stocks -> 0.5 equals to 50cent while for EURUSD currency -> 0.005 equal to 50 pips
HiLo Bar : Set SL at highest/lowest wick of previous bar plus/minus Fixed point. e.g. EURUSD HiLo=3 and Fixed Point = 0.0005, buy trade will place SL 5 Pips below lowest of previous 3 bar
SL ATR Period --> Set Lookback Period used for SL's ATR calculation
SL ATR Multi --> Set ATR Multiplier for SL
SL Fixed --> Set Fixed Level for SL (Use when SL Type is either Fixed or HiLo Bar)
SL Bar --> Set Number of previous bar to check for SL placement
TP RR Ratio --> Set TP based on RR multiplier. e.g. 2 means TP level will be twice further from entry point compared to Entry-SL distance.
Notes: The point is for preliminary testing, so it only supports 1 trade at a time and no Trailing Stop
----------------------------
Disclaimer:
This script main objective is to create my personal indicator template so that i just have to modify the indicator module for preliminary testing in future.
Testing Alert Module so i can re-use it as template in future study/indicator
Testing Visual Backtest Module so i can re-use it as template in future study/indicator
i believe using Strategy function is a better approach for this but the entry/exit level seems to be hit n miss (at least for me, still trying to figure what i did wrong)
also, i rather code the strategy in other platform where i can use the more accurate tick data if i want to validate backtest statistics.
My study scripts was built only to test/visualize an idea to see its viability and if it can be used to optimize existing strategy.
credit: ADX code are originally from "ADX and DI" by @BeikabuOyaji although i re-wrote so i can have cleaner read and use RMA instead of SMA

MACD 50x Leveraged Short Strategy with Real Equity
Hello there ,
Short version of the Macd Long strategy.
MACD Long strategy:
Adding margin: Forbidden or not specified. (Add Margin : No)
Position size: (for each trade) 1%
Stop-Loss: (2% Above Entry Level)
Long: macd crossunder
Exit: macd crossover
Or ofc touching the stop-Loss value as predicted.
These strategies are just examples.
The goal is to observe true equity and equity change.
Warning: This strategy simulation is for Short direction only.
Regards.

macd strategyOkay
User Avatar
Rules using ( MACD 12 26 Close 9 ):
Place a SELL signal when :
1. Histogram bar turned RED from GREEN
2. Within the previous group of green histogram bars the maximum value reached/passed +5.5
3. MACD fast & slow have values > 0
Place a BUY signal when :
1. Histogram bar turned GREEN from RED
2. Within the previous group of RED histogram bars has maximum value reached/passed -5.0
3. MACD fast & slow have values < 0
MACD/EMA Golden CrossThis is a slight modification to the MACD indicator. The golden cross indicator makes use of EMA 7 and EMA 21 as well as MACD together, in which it will turn the MACD line yellow & fill the MACD with a yellow background when MACD is above the signal line and EMA7 is above EMA21. This is best suited for swing trading on a daily timeframe.
