Divergence Signal [TradingFinder] RSI & MACD Reversal On Swing🔵 Introduction
Sometimes in analyzing price charts using indicators, you may observe a discrepancy. For instance, while the price of stocks, currencies, or commodities is increasing, the indicator shows a decrease. Such a phenomenon in technical analysis is termed "divergence." Divergences are categorized into three types based on their formation and the prediction they make about the continuation of the price trend: "Regular Divergence," "Hidden Divergence," and "Time Divergence."
🟣 Important :
• This indicator exclusively identifies regular divergences since its primary function is to detect reversal points.
• This indicator identifies divergences using three indicators: "Moving Average Convergence Divergence" (MACD), "Relative Strength Index" (RSI), and "Awesome Oscillator" (AO). The user can choose each of these indicators in the settings using the "Divergence Detection Method" dropdown menu for identifying divergences. These settings are by default set to the MACD mode.
🔵Types of Divergence
Divergences, as mentioned, offer different predictions about the continuation of price trends. Hence, they have various types. We will focus on explaining regular divergences based on this indicator.
🟣 Regular Divergence(RD) :
Regular divergence is a situation arising from contradictory behavior between the indicator and the price chart at the end of a trend. By identifying regular divergences, we anticipate a change in trend direction resembling a reversal pattern.
Regular divergence has two types based on the trend and prediction:
Negative Regular Divergence (RD-) :
This type occurs between two price peaks at the end of an uptrend. Despite forming a new high, the indicator fails to recognize it, indicating a negative regular divergence. The likelihood of a subsequent downtrend is high. Negative divergence suggests strong selling pressure and weak buying power, portraying an unfavorable future for the stock.
Positive Regular Divergence (RD+) :
In contrast, positive regular divergence happens at the end of a downtrend and between two price troughs. As depicted in the chart, although the price forms a new low, the indicator doesn't acknowledge it. Positive regular divergence indicates robust buying pressure and weak selling power. Upon identifying positive divergence in the chart, we expect a price increase for the stock under review
🔵 How to Use
Information from the indicator is displayed in two ways: Table and Label.
🟣 Table : The table displays information about the latest divergence. This includes the type of divergence, existence or absence of divergence, consecutive divergences, divergence quality, and change in indicator phase.
Type Divergence : Indicates the type of divergence, which can be either "Bullish Divergence" or "Bearish Divergence."
Exist : Indicates the presence of divergence with a "+" sign and absence with a "-" sign. A green color is used for bullish divergence and red for bearish divergence.
Consecutive : Shows the number of consecutive divergences. For example, if there are 3 consecutive divergences, the number 3 is displayed.
Divergence Quality : Displays the quality of the divergence based on the number of consecutive divergences. If there is 1 divergence, the quality is "Normal"; for 2 divergences, it's "Good"; and for 3 or more divergences, it's "Strong."
Change Phase Indicator : Indicates whether a phase change in the indicator has occurred with "+" for yes and "-" for no.
🟣 Label : Unlike the table, which only shows information about the latest divergence, labels display information about each divergence at the point where it occurs. The information includes the type of divergence, detection method, divergence quality, consecutive divergences, and change in phase indicator. The selected method of detection is also displayed. For example, if the chosen method is the "AO" indicator, the label will show "Method: AO."
🔵 Settings
Fractal Period : Determines the period of swings. The minimum and default value is 2.
Divergence Detect Method : Selects the indicator (MACD, RSI, or AO) used for detecting divergences. The default indicator is MACD.
Show Fractal : Chooses whether to display fractals or not. The default is "No."
Show Table : Determines whether to display the table or not. The default is "Yes."
Show Label : Chooses whether to display labels or not. The default is "Yes."
Label Size : Adjusts the size of the labels from "Tiny" to "Large."
在脚本中搜索"macd"

MA + MACD alert TrendsThis is a strategy/combination of warning indicators using 6MA+MACD.
The strategy details are as follows: This is a simple warning strategy created so that we don't have to monitor the candlestick chart too often.
Note: This isn't an entry strategy; it's a signaling strategy for upcoming trends. For maximum efficiency, we should incorporate more formulas into the command. In the case below, I use Fibonacci to enter the command.
This strategy setting works for a 15-minute time frame, but it can still work for different time frames.
It has been working well with Gold and USOIL for the last two years, as well as with currency pairs like EURUSD and many others.
Components:
EMA100 + EMA200 + MA400 + MA800
MACD (timeframe greater than 1 timeframe)
Fibonacci retreat.
Uptrend alert:
Candles on both EMAs (100-200) + 2 SMAs (400-800)
In the previous 80 candles:
EMA100 cross up to EMA200
At the same time, the MACD cross up 0.
The uptrend warning will trigger when EMA6 cuts down to MA10. That's when the price creates the top and we'll wait for the market to go back to the Fibonacci threshold of 0.618 and start buying (or wait for markets to break up the trendline to buy).
Downtrend alert:
Candles are below both EMAs ( 100-200 ) + 2 SMAs ( 400-800 )
In the previous 80 candles:
EMA100 cross down to EMA200
At the same time, the MACD cross down zero.
The downtrend warning will trigger when EMA6 cuts to MA10. That's when the price creates a bottom and we'll wait for the market to go back to the Fibonacci threshold of 0.618 and start selling (or wait for the market to break down the trendline to sell).
Recommended RR: 1:1
If you have any questions please let me know!

[blackcat] L3 Faster MACDLevel 3
Background
I am seeking a way to make MACD faster
Function
By using stoch, but with MACD method, a faster MACD is made. short term faster kd is used for macd lines. long term kd is used for histogram, which can counteract the histogram grade gap caused by tradtional MACD.
Remarks
This is a Level 1 free and open source indicator.
Feedbacks are appreciated.

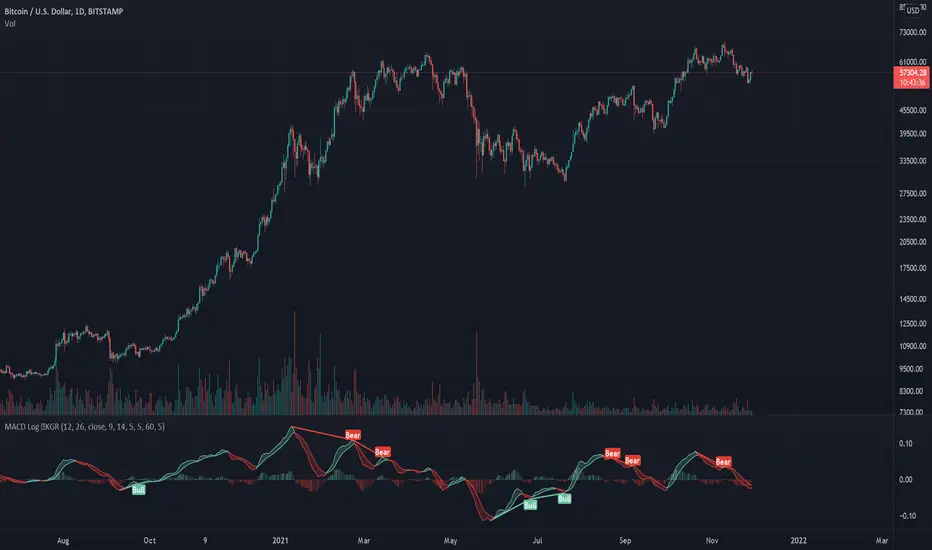
Logarithmic MACD ©KGRThis is a logarithmic MACD that comes with several advantages over the standard MACD.
Benefits: L MACD ©KGR vs Standard MACD
Normalized over longer time periods: LMACD: Yes - standard: No
Visual cues for tops: LMACD: Yes - standard: No
Visual cues for bottoms: LMACD: Yes - standard: No
Visual cues for crossing bull/bear LMACD: Yes - standard: No
Automatic divergence indicators LMACD: Yes - standard: No
Aligns with the total KGR suite highlighting confluence: LMACD: Yes - standard: No
KG Research focuses on developing crypto and general macro indicators.
Please like, follow and share to show your appreciation and support.
the KG Research team.
RSI + MACD Long-Only StrategyRSI + MACD Long-Only Strategy
Overview: Momentum-based, long-only strategy combining RSI and MACD. Entries favor upside momentum; exits trigger on momentum fades or risk targets. Signals are state-gated so you get one exit per entry (no multiple exits without a prior entry).
Entry conditions:
RSI crosses above the midline (default 50) while MACD is bullish (MACD > Signal, optionally MACD > 0), OR
MACD crosses above its Signal while RSI is at/above the midline.
Optional filters:
EMA trend filter: only enter if price > EMA(n).
Oversold context: only enter within N bars after RSI dipped below the oversold threshold.
Exit conditions:
RSI crosses below the midline, OR
MACD crosses below its Signal with MACD histogram ≤ 0.
Optional risk exit: Take Profit / Stop Loss based on percentage from average entry price.
Risk management:
Inputs: Use TP/SL (on/off), TP% (default 3.0), SL% (default 1.5).
Implements protective strategy.exit (limit/stop) while in position.
Signal-based exit uses strategy.close to flatten.
Position management:
Long-only, no pyramiding (single position at a time).
Internal state ensures entries occur only when flat and exits only when in a position.
Inputs you can tune:
RSI: length, overbought, oversold, midline.
MACD: fast length, slow length, signal length; toggle “Require MACD > 0”.
Signals: oversold lookback window; EMA trend on/off and EMA length.
Risk: TP% and SL%.
Visuals: show entry/exit markers, bar coloring; optional debug background on raw triggers.
Visuals and alerts:
Plots EMA (optional), draws entry/exit markers, optional bar coloring, and a faint background on raw long triggers to aid tuning.
Alert conditions provided for entries and exits.
Notes:
Designed for bar-close evaluation; performance varies by symbol/timeframe—tune inputs accordingly.
Long-only; intended for trend-following momentum with basic risk control.
Not financial advice.

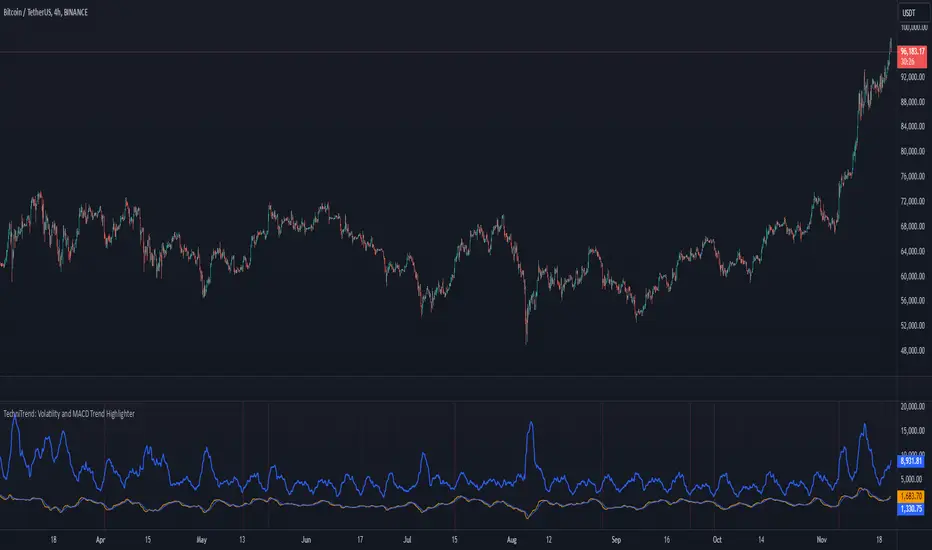
TechniTrend: Volatility and MACD Trend Highlighter🟦 Overview
The "Candle Volatility with Trend Prediction" indicator is a powerful tool designed to identify market volatility based on candle movement relative to average volume while also incorporating trend predictions using the MACD. This indicator is ideal for traders who want to detect volatile market conditions and anticipate potential price movements, leveraging both price changes and volume dynamics.
It not only highlights candles with significant price movements but also integrates a trend analysis based on the MACD (Moving Average Convergence Divergence), allowing traders to gauge whether the market momentum aligns with or diverges from the detected volatility.
🟦 Key Features
🔸Volatility Detection: Identifies candles that exceed normal price fluctuations based on average volume and recent price volatility.
🔸Trend Prediction: Uses the MACD indicator to overlay trend analysis, signaling potential market direction shifts.
🔸Volume-Based Analysis: Integrates customizable moving averages (SMA, EMA, WMA, etc.) of volume, providing a clear visualization of volume trends.
🔸Alert System: Automatically notifies traders of high-volatility situations, aiding in timely decision-making.
🔸Customizability: Includes multiple settings to tailor the indicator to different market conditions and timeframes.
🟦 How It Works
The indicator operates by evaluating the price volatility in relation to average volume and identifying when a candle's volatility surpasses a threshold defined by the user. The key calculations include:
🔸Average Volume Calculation: The user selects the type of moving average (SMA, EMA, etc.) to calculate the average volume over a set period.
🔸Volatility Measurement: The indicator measures the body change (difference between open and close) and the high-low range of each candle. It then calculates recent price volatility using a standard deviation over a user-defined length.
🔸Weighted Index: A unique index is created by dividing price change by average volume and recent volatility.
🔸Highlighting Volatility: If the weighted index exceeds a customizable threshold, the candle is highlighted, indicating potential trading opportunities.
🔸Trend Analysis with MACD: The MACD line and signal line are plotted and adjusted with a user-defined multiplier to visualize trends alongside the volatility signals.
🟦 Recommended Settings
🔸Volume MA Length: A default of 14 periods for the average volume calculation is recommended. Adjust to higher periods for long-term trends and shorter periods for quick trades.
🔸Volatility Threshold Multiplier: Set at 1.2 by default to capture moderately significant movements. Increase for fewer but stronger signals or decrease for more frequent signals.
🔸MACD Settings: Default MACD parameters (12, 26, 9) are suggested. Tweak based on your trading strategy and asset volatility.
🔸MACD Multiplier: Adjust based on how the MACD should visually compare to the average volume. A multiplier of 1 works well for most cases.
🟦 How to Use
🔸Volatile Market Detection:
Look for highlighted candles that suggest a deviation from typical price behavior. These candles often signify an entry point for short-term trades.
🔸Trend Confirmation:
Use the MACD trend analysis to verify if the highlighted volatile candles align with a bullish or bearish trend.
For example, a bullish MACD crossover combined with a highlighted candle suggests a potential uptrend, while a bearish crossover with volatility signals may indicate a downtrend.
🔸Volume-Driven Strategy:
Observe how volume changes impact candle volatility. When volume rises significantly and candles are highlighted, it can suggest strong market moves influenced by big players.
🟦 Best Use Cases
🔸Trend Reversals: Detect potential trend reversals early by spotting divergences between price and MACD within volatile conditions.
🔸Breakout Strategies: Use the indicator to confirm price breakouts with significant volume changes.
🔸Scalping or Day Trading: Customize the indicator for shorter timeframes to capture rapid market movements based on volatility spikes.
🔸Swing Trading: Combine volatility and trend insights to optimize entry and exit points over longer periods.
🟦 Customization Options
🔸Volume-Based Inputs: Choose from SMA, EMA, WMA, and more to define how average volume is calculated.
🔸Threshold Adjustments: Modify the volatility threshold multiplier to increase or decrease sensitivity based on your trading style.
🔸MACD Tuning: Adjust MACD settings and the multiplier for trend visualization tailored to different asset classes and market conditions.
🟦 Indicator Alerts
🔸High Volatility Alerts: Automatically triggered when candles exceed user-defined volatility levels.
🔸Bullish/Bearish Trend Alerts: Alerts are activated when highlighted volatile candles align with bullish or bearish MACD crossovers, making it easier to spot opportunities without constantly monitoring the chart.
🟦 Examples of Use
To better understand how this indicator works, consider the following scenarios:
🔸Example 1: In a strong uptrend, observe how volume surges and volatility highlight candles right before price consolidations, indicating optimal exit points.
🔸Example 2: During a downtrend, see how the MACD aligns with volume-driven volatility, signaling potential short-selling opportunities.
PT2_Stochastic RSI / MACDThis indicator is designed for use with Profit Trailer version 2 and plots the values of RSI, Stochastic, StochasticRSI and MACD.
Due to the decimal values that they all produce, There are some important things to understand before using this indicator.
In PT2, RSI and Stochastic require values between 0 and 100, but StochasticRSI requires values between 0.00 and 1.00. Because of this the following needs to be understood.
RSI:
----
The buy and sell values and limits are inputted as values between 0 and 100, but they get divided by 100 so to map alongside StochasticRSI on the indicator scale.
In other words an RSI buy value inputted as 30 will display as 0.3, but in your PT2 settings you would still input 30.
Stochastic:
-------------
Stochastic and StochasticRSI share common buy and sell value input fields for this indicator (so you can't use BOTH Stochastic and StochasticRSI at the same time, in the same indicator).
The buy and sell values and limits, need to be written as decimal values between 0.00 and 1.00 even though within the PT2 settings, Stochastic is inputted as values between 0 and 100.
So when translating values from this indicator to your PT2 settings, a Stochastic Buy Value of 0.3 in this indicator will be written in your PT2 settings as 30. Just like RSI.
StochasticRSI:
-----------------
PT2 uses StochasticRSI values between 0.00 and 1.00 (as mentioned above). It is because of this, to enable RSI and Stochastic to display together, everything is displayed using the decimal notation of between 0.00 and 1.00.
MACD:
--------
The MACD is completely different and produces a decimal value down to 9 decimal places as used in PT2, making it not compatible with the RSI and Stochastic values.
So at the top of the settings of this indicator, you need to choose which indicator you wish to view at a time (Stochastic-RSI or MACD, not both).
Also, Trading view doesn't handle negative decimals down to 9 places very well, so the Buy/Sell Value/Limit numbers you enter here will be divided by 100,000,000.
This means that if you enter a MACD Sell Value of -250 in this indicator, it gets translated to -0.000000250. This would be the decimal value you would put in your PT2 settings.
======================================================================================================================================================
I hope this indicator helps you all out, feel free to show any appreciation you have in what ever way you feel you can.
// Created 2018 - by @Squiggles#8806
// LTC Tip Jar: LX4bUBdjiRPsagUbZoAczSGgDC4YqTJL7w
======================================================================================================================================================

Coinopi_ma/macdi_[babelii]Special MA- Macdi oscillator
--->coinopi.com/indicator
--->The positive area below the line
MACD Momentum IndicatorMACD is likely one of the most misunderstood indicators. It is typically plotted with three parts: MACD, Signal line, and histogram. Traders then have the impression that all three parts make up the MACD. In reality, only one plot is the MACD line which we use in our system.
This indicator isolates that MACD line and shows it as a histogram plot with separate colors for rising, falling, positive or negative. You can also view it as a line chart instead which is how I personally view it.
The last piece implemented in this version of the indicator is that you can choose to fill the bars. When you turn on the bar fill, the bar colors on the chart will match the color status of the MACD. This is a quick reference of the MACD.
MACD can be used for regular divergences, and when viewed as a line can also be used for hidden divergences. When above zero, momentum is considered positive. When below zero, it is considered negative.
Elliott Wavers can also utilize the MACD crossing up and down to isolate wave counts. This can be complex, but an impulse isolated on one time frame can be verified as completed once the MACD crosses the zero line on the same time frame.

LA - MACD EMA BandsOverview of the "LA - MACD EMA Bands" Indicator
For Better view, use this indicator along with "LA - EMA Bands with MTF Dashboard"
The "LA - MACD EMA Bands" is a custom technical indicator written in Pine Script v6 for TradingView. It builds on the traditional Moving Average Convergence Divergence (MACD) oscillator by incorporating additional smoothing via Exponential Moving Averages (EMAs) and Bollinger Bands (BB) applied directly to the MACD line. This creates a multi-layered momentum and volatility tool displayed in a separate pane below the price chart (not overlaid on the price itself).
The indicator allows for customization, such as selecting a different timeframe (for multi-timeframe analysis) and adjusting period lengths. It fetches data from the specified timeframe using request.security with lookahead enabled to avoid repainting issues. The core idea is to provide insights into momentum trends, crossovers, and volatility expansions/contractions in the MACD's behavior, making it suitable for identifying potential trend reversals, continuations, or ranging markets.
Unlike a standard MACD, which focuses primarily on momentum via a single line, signal line, and histogram, this version emphasizes longer-term smoothing and volatility boundaries. It uses visual fills between lines to highlight bullish/bearish conditions, aiding quick interpretation. Below, I'll break down each component, its calculation, visual representation, and practical uses.
Detailed Breakdown of Each Component and Its Uses
MACD Line (Blue Line, Labeled 'MACD Line')
Calculation: This is the core MACD value, computed as the difference between a fast EMA (default length 12) and a slow EMA (default length 144) of the input source (default: close price). The EMAs are calculated on data from the selected timeframe.
Visuals: Plotted as a solid blue line.
Uses:
Measures momentum: When above zero, it indicates bullish momentum (prices rising faster in the short term); below zero, bearish momentum.
Trend identification: Rising MACD suggests strengthening uptrends; falling suggests downtrends.
Divergence spotting: Compare with price action—e.g., if price makes higher highs but MACD makes lower highs, it signals potential bearish reversal (and vice versa for bullish divergence).
In trading: Often used for entry/exit signals when crossing the zero line or other lines in the indicator.
MACD EMA (Red Line, Labeled 'MACD EMA')
Calculation: A 12-period EMA applied to the MACD Line itself.
Visuals: Plotted as a solid red line.
Uses:
Acts as a signal line for the MACD, smoothing out short-term noise.
Crossover signals: When the MACD Line crosses above the MACD EMA, it can signal a bullish buy opportunity; crossing below suggests a bearish sell.
Trend confirmation: Helps filter false signals in choppy markets by requiring confirmation from this slower-moving average.
In trading: Useful for momentum-based strategies, like entering trades on crossovers in alignment with the overall trend.
Fill Between MACD Line and MACD EMA (Green/Red Shaded Area, Titled 'MACD Fill')
Calculation: The area between the MACD Line and MACD EMA is filled with color based on their relative positions.
Color Logic: Green (with 57% transparency) if MACD Line > MACD EMA (bullish); red if MACD Line < MACD EMA (bearish).
Visuals: Semi-transparent fill for easy visibility without overwhelming the lines.
Uses:
Quick visual cue for momentum shifts: Green areas highlight bullish phases; red for bearish.
Enhances readability: Makes crossovers more apparent at a glance, especially in fast-moving markets.
In trading: Can be used to time entries/exits or as a filter (e.g., only take long trades in green zones).
Bollinger Bands on MACD (BB Upper: Black Dotted, BB Basis: Maroon Dotted, BB Lower: Black Dotted)
Calculation: Bollinger Bands applied to the MACD Line.
BB Basis: 144-period EMA of the MACD Line.
BB Standard Deviation: 144-period stdev of the MACD Line.
BB Upper: BB Basis + (2.0 * BB Stdev)
BB Lower: BB Basis - (2.0 * BB Stdev)
Visuals: Upper and lower bands as black dotted lines; basis as maroon dotted
Uses:
Volatility measurement: Bands expand during high momentum volatility (strong trends) and contract during low volatility (ranging or consolidation).
Mean reversion: When MACD Line touches or exceeds the upper band, it may signal overbought conditions (potential sell); lower band for oversold (potential buy).
Squeeze detection: Narrow bands (squeeze) often precede big moves—watch for breakouts.
In trading: Combines momentum with volatility; e.g., a MACD Line breakout above the upper band could confirm a strong uptrend.
BB Basis EMA (Green Line, Labeled 'BB Basis EMA')
Calculation: A 72-period EMA applied to the BB Basis (which is already a 144-period EMA of the MACD Line).
Visuals: Solid green line.
Uses:
Further smoothing: Provides a longer-term view of the MACD's average behavior, reducing noise from the BB Basis.
Trend direction: Acts as a baseline for the BB system—above it suggests bullish bias in momentum volatility; below, bearish.
Crossover with BB Basis: Can signal shifts in volatility trends (e.g., BB Basis crossing above BB Basis EMA indicates increasing bullish volatility).
In trading: Useful for confirming longer-term trends or as a filter for BB-based signals.
Fill Between BB Basis and BB Basis EMA (Gray Shaded Area, Titled 'BB Basis Fill')
Calculation: The area between BB Basis and BB Basis EMA is filled.
Color Logic: Currently set to a constant semi-transparent gray regardless of position.
Visuals: Semi-transparent gray fill.
Uses:
Highlights divergence: Shows when the shorter-term BB Basis deviates from its longer-term EMA, indicating potential volatility shifts.
Visual aid for crossovers: Makes it easier to spot when BB Basis crosses its EMA.
In trading: Could be used to identify overextensions in volatility (e.g., wide gray areas might signal impending mean reversion).
Zero Line (Black Horizontal Line)
Calculation: A simple horizontal line at y=0.
Visuals: Solid black line.
Uses:
Reference point: Divides bullish (above) from bearish (below) territory for all MACD-related lines.
In trading: Crossovers of the zero line by the MACD Line or BB Basis can signal major trend changes.
How It Differs from a Normal MACD
A standard MACD (e.g., the built-in TradingView MACD with defaults 12/26/9) consists of:
MACD Line: EMA(12) - EMA(26).
Signal Line: EMA(MACD Line, 9).
Histogram: MACD Line - Signal Line (bars showing convergence/divergence).
Key differences in "LA - MACD EMA Bands":
Periods: Uses a much longer slow EMA (144 vs. 26), making it more sensitive to long-term trends but less reactive to short-term price action. The MACD EMA is 12 periods (vs. 9), further emphasizing smoothing.
No Histogram: Replaces the histogram with fills and bands for visual emphasis on crossovers and volatility.
Added Bollinger Bands: Applies BB directly to the MACD Line (with a long 144-period basis), introducing volatility analysis absent in standard MACD. This helps detect "squeezes" or expansions in momentum.
Additional EMA Layer: The BB Basis EMA (72-period) adds a secondary smoothing level to the BB system, providing a hierarchical view of momentum (short-term MACD → mid-term BB → long-term EMA).
Multi-Timeframe Support: Built-in option for higher timeframes, unlike basic MACD.
Focus: Standard MACD is purely momentum-focused; this version integrates volatility (via BB) and multi-layer smoothing, making it better for trend-following in volatile markets but potentially overwhelming for beginners.
Overall, this indicator transforms the MACD from a simple oscillator into a comprehensive momentum-volatility hybrid, reducing false signals in trending markets but introducing lag.
Overall Pros and Cons
Pros:
Enhanced Visualization: Fills and bands make trends, crossovers, and volatility easier to spot without needing multiple indicators.
Reduced Noise: Longer periods (144, 72) smooth out whipsaws, ideal for swing or position trading in trending assets like stocks or forex.
Volatility Integration: BB adds a dimension not in standard MACD, helping identify breakouts or consolidations.
Customizable: Inputs for timeframes and lengths allow adaptation to different assets/timeframes.
Multi-Layered Insights: Combines short-term signals (MACD crossovers) with long-term confirmation (BB EMA), improving signal reliability.
Cons:
Lagging Nature: Long periods (e.g., 144) delay signals, missing early entries in fast markets or leading to late exits.
Complexity: Multiple lines and fills can clutter the pane, requiring experience to interpret; beginners might misread it.
Potential Overfitting: Custom periods (12/144/12/144/72) may work well on historical data but underperform in live trading without backtesting.
No Built-in Alerts/Signals: Relies on visual interpretation; users must manually set alerts for crossovers.
Resource Intensive: On lower timeframes or with lookahead, it might slow chart loading on Trading View.
This indicator shines in strategies combining momentum and volatility, like trend-following with BB squeezes, but test it on your assets (e.g., via backtesting) to ensure it fits your style.
For Better view, use this indicator along with "LA - EMA Bands with MTF Dashboard"

Anchored Volume-Weighted RSI & Multi-Normalized MACDAnchored Volume-Weighted RSI & Multi-Normalized MACD
Author: NEPOLIX
Overview
The "Anchored Volume-Weighted RSI & Multi-Normalized MACD" is a sophisticated Pine Script v6 indicator designed for TradingView. It combines an Anchored Volume-Weighted Relative Strength Index (VW-RSI) with a Multi-Normalized Moving Average Convergence Divergence (MACD) to provide traders with enhanced market analysis tools. This indicator allows for customizable anchoring, multiple normalization techniques, and stepped visualization for precise trend and momentum analysis.
Features
Anchored VW-RSI: Calculates a volume-weighted RSI anchored to a user-defined or auto-detected time point, offering a unique perspective on momentum with volume influence.
Multi-Normalized MACD: Supports various normalization methods, including Volume-Weighted, Min-Max, Volatility, Hyperbolic Tangent, Arctangent, and Min-Max with Smoothing, ensuring adaptability to different market conditions.
Flexible Anchoring: Choose from auto-detected anchor modes (1-day, 5-day, 30-day) or manual anchor time selection for tailored analysis starting from a specific point.
Stepped Visualization: Optional stepped mode for RSI and MACD values, reducing noise and highlighting significant changes based on user-defined thresholds.
Smoothing Options: Supports multiple moving average types (SMA, EMA, SMMA, WMA, VWMA) for RSI smoothing, with optional Bollinger Bands for volatility analysis.
Derivative Analysis: Plots derivatives for RSI and MACD to identify rate-of-change trends, with adjustable scaling and filtering.
Customizable Display: Options to toggle MACD line, signal line, histogram, and cross-point dots, with dynamic color changes based on market conditions.
Multi-Timeframe Support: Fetch data from higher timeframes for broader market context.
User-Friendly Inputs: Comprehensive input settings for general parameters, anchor settings, RSI, MACD, derivatives, and display options, organized into clear groups.
How It Works
VW-RSI: Computes a volume-weighted RSI by anchoring calculations to a specified time, using volume-weighted gains and losses for a more robust momentum indicator.
MACD Normalizations: Applies user-selected normalization techniques to the MACD, scaling it within defined bounds (-50 to 50 by default) for consistent comparison across instruments.
Anchoring Mechanism: Aligns calculations to a user-defined or auto-calculated anchor point (e.g., market open time adjusted for America/New_York timezone).
Stepped Mode: Discretizes RSI and MACD values into sections for clearer trend identification, with customizable section width and zero range.
Visualization: Plots RSI, MACD, signal lines, and histograms, with optional Bollinger Bands, derivatives, and stepped lines. Dynamic coloring highlights crossovers and histogram trends.
Use Cases
Trend Analysis: Use the anchored VW-RSI and normalized MACD to identify momentum shifts and trend strength.
Reversal Detection: Monitor overbought/oversold levels and MACD crossovers for potential reversal points.
Volatility Assessment: Leverage Bollinger Bands and volatility-normalized MACD for insights into market volatility.
Custom Strategies: Export variables (RSI, MACD, signal, etc.) for use in companion scripts or automated trading strategies.
Settings
General: Adjust section width, zero range, timeframe, and enable stepped mode.
Anchor Settings: Select auto or manual anchor modes, with options for 1-day, 5-day, or 30-day auto-anchoring, or manual bar selection.
RSI: Configure price source, length, smoothing type, Bollinger Bands multiplier, and derivative settings.
MACD: Set price source, fast/slow/signal lengths, normalization types, and derivative parameters.
Derivatives: Customize scale factors and filters for RSI and MACD derivatives.
Display Options: Toggle visibility of MACD, signal line, histogram, and crossover dots, with options for color changes.
Notes
Ensure the anchor time is valid when using manual mode by selecting a bar on the chart.
Normalization options should be chosen based on the instrument and market conditions for optimal results.
Stepped mode is ideal for reducing noise in volatile markets but requires careful threshold tuning.
The indicator is computationally intensive due to multiple normalizations; test on smaller datasets if performance issues arise.

Multifactor Buy/Sell Strategy V2 | RSI, MACD, ATR, EMA, Boll.BITGET:1INCHUSDT
This Pine Script code for TradingView is a multifactor Buy/Sell indicator that combines several technical factors to generate trading signals based on trend, volatility, and volume conditions. Here’s a breakdown of the main components and functionality:
Indicator Name
- Multifactor Buy/Sell Strategy V2 — an overlay indicator applied directly on the price chart.
### Input Parameters
The script includes multiple customizable parameters:
- RSI, EMA, MACD parameters — for setting periods and signals of MACD and RSI.
- ATR and Bollinger Bands — used for volatility analysis and level determination.
- Minimum Volatility Threshold — sets a minimum Bollinger Band width threshold for determining high volatility.
Core Indicators
1. RSI — calculated to identify oversold (below 30) and overbought (above 70) conditions.
2. EMA and MACD — calculates exponential moving averages and MACD histogram to determine trend direction.
3. ATR and Bollinger Bands — used to assess current volatility and establish dynamic upper and lower bands.
Volatility and Volume Analysis
- Determines the current ATR level and Bollinger Band width to evaluate high volatility.
- Calculates the volume moving average to track periods of increased volume during high volatility.
Trend Analysis
The script uses the difference between fast and slow EMAs to define strong trends:
- Uptrend — when the fast EMA is above the slow EMA, the price is above the fast EMA, and the trend is strong.
- Downtrend — when the fast EMA is below the slow EMA, the price is below the fast EMA, and the trend is strong.
Momentum Filter
- Based on the price change over the last three bars and compared against the minimum volatility threshold to identify strong momentum.
Buy and Sell Signal Generation
- Buy Signal: Uptrend with RSI oversold, positive MACD histogram, high volatility and volume, strong momentum, and sufficient Bollinger Band width.
- Sell Signal: Downtrend with RSI overbought, negative MACD histogram, high volatility and volume, strong momentum, and sufficient Bollinger Band width.
Visualization
- Buy and sell signals are displayed as green and red triangles on the chart.
- Plots for fast and slow EMAs, upper and lower bands, and Bollinger Bands.
Alerts
The script includes alert conditions for buy and sell signals, allowing notifications to be sent via email or mobile app.
Information Panel
A small table on the chart displays current volatility dataThis Pine Script code for TradingView is a multifactor Buy/Sell indicator that combines several technical factors to generate trading signals based on trend, volatility, and volume conditions. Here’s a breakdown of the main components and functionality:
Indicator Name
- Multifactor Buy/Sell Strategy V2 — an overlay indicator applied directly on the price chart.
Input Parameters
The script includes multiple customizable parameters:
- **RSI, EMA, MACD parameters** — for setting periods and signals of MACD and RSI.
- **ATR and Bollinger Bands** — used for volatility analysis and level determination.
- **Minimum Volatility Threshold** — sets a minimum Bollinger Band width threshold for determining high volatility.
Core Indicators
1. RSI — calculated to identify oversold (below 30) and overbought (above 70) conditions.
2. EMA and MACD — calculates exponential moving averages and MACD histogram to determine trend direction.
3. ATR and Bollinger Bands — used to assess current volatility and establish dynamic upper and lower bands.
Volatility and Volume Analysis
- Determines the current ATR level and Bollinger Band width to evaluate high volatility.
- Calculates the volume moving average to track periods of increased volume during high volatility.
Trend Analysis
The script uses the difference between fast and slow EMAs to define strong trends:
- Uptrend — when the fast EMA is above the slow EMA, the price is above the fast EMA, and the trend is strong.
- Downtrend — when the fast EMA is below the slow EMA, the price is below the fast EMA, and the trend is strong.
Momentum Filter
- Based on the price change over the last three bars and compared against the minimum volatility threshold to identify strong momentum.
Buy and Sell Signal Generation
- Buy Signal: Uptrend with RSI oversold, positive MACD histogram, high volatility and volume, strong momentum, and sufficient Bollinger Band width.
- Sell Signal: Downtrend with RSI overbought, negative MACD histogram, high volatility and volume, strong momentum, and sufficient Bollinger Band width.
Visualization
- Buy and sell signals are displayed as green and red triangles on the chart.
- Plots for fast and slow EMAs, upper and lower bands, and Bollinger Bands.
Alerts
The script includes alert conditions for buy and sell signals, allowing notifications to be sent via email or mobile app.
Information Panel
A small table on the chart displays current volatility
- Volatility Status — indicates high or low volatility.
- Bollinger Band Width — current width as a percentage.
- ATR Ratio — ratio of current ATR to long-term average ATR.
This script is suitable for trading in high-volatility conditions, combining multiple filters and factors to generate precise buy and sell signals.

RSI or MACD + Tendance Kijun LTThis script is an update of my previous script "RSI + Tendance Kijun LT", I will not explain it here, if needed have a look at it :
I made a new script (and not update the previous one) because some people may not be interested by MACD and for performance perspective they may be interested to only have RSI (since you can't have both but only switch from RSI and MACD)
So now, you can choose to have MACD instead of RSI with long term trend based on Kijun still dispaying. Why am I adding MACD even if most of the time I never use it ? It's for Elliott Wave purpose and principaly for triangle. With MACD, you can easily identify if you're forming a triangle or not in an Elliott Wave perspective (I'm not speaking about chartist triangle).
As an example, you can see ETHUSD in daily and something looking similar to a triangle. We can trade it with many possibility (breakout, support/resistance) but I'm interested in to identify if it's a triangle with an EW count (not chartist) and if it's the case I will consider different scenario (triangle are most of the time wave 4 so we could have one more push leg down on this ticker)
So, in my daytrading I'm still always using RSI except when I want to verify if we have a triangle :) and I need to switch to MACD for that to check the following things :
- am I able to draw a triangle as the price did
- may I able to join A to C and B to D and still have a triangle on MACD
- If Yes, I will take care of E point because it's the start of the 5th wave (E point may be a truncated wave of the triangle and not join the line of points A to C)
By adding this in my strategy, I can anticipate different scenarios and invalidate them if I didn't get the triangle on MACD (by having a D point on MACD not respecting the triangle form). Don't forget, we can decide to don't trade a triangle as an EW count but still trade it as a chartist form (breakout or anything else).
In summary for the next days/weeks, on ETHUSD in daily time unit I will therefore wait and see if the price goes up to point D by being validated on the MACD. If so, then I will look at the possible formation of point E around prices 141$ and 156$, if at these prices I have short signals then it will be interesting to go back in short position
--------------------------------------------------------
Ce script est une mise à jour de mon script précédent "RSI + Tendance Kijun LT", je ne l'expliquerai pas ici, si besoin jetez-y un oeil :
J'ai fait un nouveau script (sans forcer la mise à jour du précédent) parce que certaines personnes peuvent ne pas être intéressées par MACD et pour des raisons de performance, elles peuvent être intéressées à n'avoir que RSI (puisque vous ne pouvez pas avoir les deux en même temps mais seulement passer de RSI et MACD)
Donc maintenant, vous pouvez choisir d'avoir MACD au lieu de RSI avec une tendance à long terme basée sur Kijun qui s'affiche toujours. Pourquoi est-ce que j'ajoute MACD même si la plupart du temps je ne l'utilise jamais ? C'est pour Elliott Wave et surtout pour le triangle. Avec MACD, vous pouvez facilement identifier si vous formez un triangle ou non dans une perspective Elliott Wave (je ne parle pas de triangle chartiste).
Par exemple, vous pouvez voir que sur ETHUSD en unité de temps journalière nous avons quelque chose qui ressemble à un triangle. Nous pouvons faire des trade de pleins de manières différentes (cassure d'oblique, support/résistance) mais je suis intéressé d'identifier si c'est un triangle avec un compte EW (pas chartiste) et si c'est le cas, je vais envisager un scénario différent (sachant que les triangles sont la plupart du temps la vague 4 et donc envisager à la sortie une dernière poussée baissière type vague 5 sur ETHUSD)
Donc, dans mon daytrading, j'utilise toujours RSI sauf quand je veux vérifier si nous avons un triangle :) et j'ai besoin de passer à MACD afin de vérifier les éléments suivantes :
- Suis-je capable de dessiner un triangle comme le prix le dessine
- puis-je joindre A à C et B à D et toujours avoir un triangle sur MACD ?
- Si oui, je m'occupe du point E car c'est le début de la 5ème vague (le point E peut être une onde tronquée du triangle et ne pas joindre la ligne des points A à C).
En ajoutant cela dans ma stratégie, je peux anticiper différents scénarios et les invalider si je n'ai pas obtenu le triangle sur MACD (en ayant un point D sur MACD ne respectant pas la forme du triangle). N'oubliez pas, nous pouvons décider de ne pas le trade comme un triangle d'un décompte EW mais de le trade simplement comme un triangle chartiste (breakout ou autre chose).
En résumé pour les prochains jours/semaines, sur ETHUSD en unité de temps journalière je vais donc patienter et voir si le prix va jusqu'au point D en étant validé sur le MACD. Si oui, alors je regarderai l'éventuelle formation du point E autour des prix 141$ et 156$, si à ces prix j'ai des signaux vendeurs alors il sera intéressant de rentrer en position short

Advanced MACD Pro (WhiteStone_Ibrahim) - T3 Themed✨ Advanced MACD Pro (WhiteStone_Ibrahim) - T3 Themed ✨
Take your MACD analysis to the next level with the Advanced MACD Pro - T3 Themed indicator by WhiteStone_Ibrahim! This isn't just another MACD; it's a comprehensive toolkit packed with advanced features, unique T3 integration, and extensive customization options to provide deeper market insights.
Whether you're a seasoned trader or just starting, this indicator offers a versatile and powerful way to analyze momentum, identify trends, and spot potential reversals.
Key Features:
Core MACD Functionality:
Classic MACD Line: Calculated from customizable Fast and Slow EMAs using your chosen source (Close, Open, HLC3, etc.).
Standard Signal Line: EMA of the MACD line, with adjustable length.
Dynamic MACD Line Coloring: Automatically changes color based on whether it's above or below the zero line (positive/negative).
Zero Line: Clearly plotted for reference.
Enhanced MACD Histogram:
Sophisticated Color Coding: The histogram isn't just positive or negative. It intelligently colors based on momentum strength and direction:
Strong Bullish: MACD above signal, histogram increasing.
Weakening Bullish: MACD above signal, histogram decreasing.
Strong Bearish: MACD below signal, histogram decreasing.
Weakening Bearish: MACD below signal, histogram increasing.
Neutral: Default color for other conditions.
Optional Histogram Smoothing: Smooth out the histogram noise using one of five different moving average types: SMA, EMA, WMA, RMA, or the advanced T3 (Tilson T3). Customize smoothing length and T3 vFactor.
🌟 Unique T3 Integration (T3 Themed):
Extra T3 Signal Line (on MACD): An additional, fast-reacting T3 moving average calculated directly from the MACD line. This provides an alternative and often quicker signal.
Customizable T3 length and vFactor.
Dynamic Coloring: The T3 Signal Line changes color (bullish/bearish) based on its crossover with the MACD line, offering clear visual cues.
T3 is also available as a smoothing option for the main histogram (see above).
🔍 Disagreement & Divergence Detection:
Bar/Price Disagreement Markers:
Highlights instances where the price bar's direction (e.g., a bullish candle) contradicts the current MACD momentum (e.g., MACD below its signal line).
Visual markers (circles) appear above/below bars to draw attention to these potential early warnings or confirmations.
Histogram Color Change on Disagreement: Optionally, the histogram can adopt distinct alternative colors during these bar/price disagreements for even clearer visual alerts.
Classic Bullish & Bearish Divergence Detection:
Automatically identifies regular divergences between price action (Higher Highs/Lower Lows) and the MACD line (Lower Highs/Higher Lows).
Customizable pivot lookback periods (left and right bars) for divergence sensitivity.
Plots clear "Bull" and "Bear" labels on the price chart where divergences occur.
🎨 Extensive Customization & Visuals:
Multiple Color Themes: Choose from pre-set themes like 'Dark Mode', 'Light Mode', 'Neon Night', or use 'Default (Current Settings)' to fine-tune every color yourself.
Granular Control (Default Theme): Individually customize colors and thickness for:
MACD Line (positive/negative)
Standard Signal Line
Extra T3 Signal Line (bullish/bearish)
Histogram (all four momentum states + neutral)
Disagreement Markers & Histogram Alt Colors
Divergence Lines/Labels
Zero Line
Toggle Visibility: Easily show or hide the Standard Signal Line and the Extra T3 Signal Line as needed.
🔔 Comprehensive Alert System:
Stay informed of key market events with a wide array of configurable alerts:
MACD Line / Standard Signal Line Crossover
Histogram / Zero Line Crossover
MACD Line / Zero Line Crossover
Bullish Divergence Detected
Bearish Divergence Detected
Bar/Price Disagreement (Bullish & Bearish)
MACD Line / Extra T3 Signal Line Crossover
Each alert can be individually enabled or disabled.
The Advanced MACD Pro - T3 Themed indicator is designed to be your go-to tool for momentum analysis. Its rich feature set empowers you to tailor it to your specific trading style and gain a more nuanced understanding of market dynamics.
Add it to your charts today and experience the difference!
(Developed by WhiteStone_Ibrahim)

Linear Volume MACD | Lyro RS📊 Linear Volume MACD | Lyro RS is an advanced momentum and trend detection tool that fuses price action with volume-weighted MACD logic and linear regression analysis . Designed for traders seeking deeper insights into market strength and directional conviction, this indicator highlights trend shifts, volume anomalies, and potential reversal zones with precision.
✨ Key Features :
🔁 Multi-Mode Analysis: Switch between Linear Regression , Strong/Weak Trend , or Volume MACD logic.
📐 Volume-Adjusted MACD: Incorporates volume for a more realistic momentum view.
📊 Linear Regression Signal: Smoother and more reactive trend analysis.
🎯 Dynamic Stdev Bands: Visualize ±1 and ±2 standard deviation thresholds for anomaly detection.
🌈 Custom Color Themes: Choose from built-in palettes or define your own bullish/bearish signal colors.
⚠️ Alert Conditions: Built-in alerts notify you of potential trend shifts across all signal modes.
📈 How It Works :
🧮 MACD Core: Uses volume-weighted price to generate fast and slow EMAs, forming the MACD and signal lines.
📉 Histogram Logic: Histogram is either the traditional MACD histogram or its linear regression version.
📊 Signal Modes:
• Linear Regression: Detect trend based on smoothed MACD behavior.
• Strong/Weak Trend: Identifies accelerating/decelerating trend strength.
• Volume MACD: Classic volume MACD behavior for divergence spotting.
📏 Stdev Bands: Calculated over a long period (default 200) to highlight statistically significant moves.
🎨 Color-coded Feedback: Bar and background colors adjust dynamically with market condition.
⚙️ Customization Options :
🔄 Choose your Signal Type from three unique analysis modes.
📏 Modify Fast/Slow/Signal lengths and Regression parameters to suit your strategy.
📈 Enable or disable Stdev Bands and adjust multiplier.
🎨 Select from Classic, Mystic, Accented, or Royal color palettes — or create your own.
📌 Use Cases :
🟢 Identify trend continuation or reversal zones with volume-adjusted signals.
🔴 Detect volatility breakouts using standard deviation bands.
🧭 Use in confluence with price structure, RSI, or market sentiment.
⚠️ Disclaimer :
This indicator is for educational purposes only. It is not financial advice. Always use in conjunction with your own research and risk management strategy.

[DuDu95] SSL 4C MACD Laugerre RSI StrategyHello Guys! Nice to meet you all!
Before I start, my nickname has changed to 'DuDu95'!!
This is the Strategy introduced by youtube channel.
I made this based on the open source indicator by kevinmck100, vkno422, KivancOzbilgic. Thank you All!
### Entry Logic
1. Long Entry Logic
- close > SSL Hybrid baseline upper k (keltner channel)
- macd signal > 0 and current MACD value > previous MACD value
- Laguerre RSI < overbought Line.
2. short Entry Logic
- close < SSL Hybrid baseline lower k (keltner channel)
- macd signal < 0 and current MACD value < previous MACD value
- Laguerre RSI > overbought Line.
### Exit Logic
1. Long Exit Logic
- close < SSL Hybrid baseline lower k (keltner channel)
- macd signal < 0
2. short Entry Logic
- close > SSL Hybrid baseline upper k (keltner channel)
- macd signal > 0
### StopLoss
1. Can Choose Stop Loss Type: Percent, ATR, Previous Low / High.
2. Can Chosse inputs of each Stop Loss Type.
### Take Profit
1. Can set Risk Reward Ratio for Take Profit.
- To simplify backtest, I erased all other options except RR Ratio.
- You can add Take Profit Logic by adding options in the code.
2. Can set Take Profit Quantity.
### Risk Manangement
1. Can choose whether to use Risk Manangement Logic.
- This controls the Quantity of the Entry.
- e.g. If you want to take 3% risk per trade and stop loss price is 6% below the long entry price,
then 50% of your equity will be used for trade.
2. Can choose How much risk you would take per trade.
### Plot
1. Added Labels to check the data of entry / exit positions.
2. Changed and Added color different from the original one. (green: #02732A, red: #D92332, yellow: #F2E313)

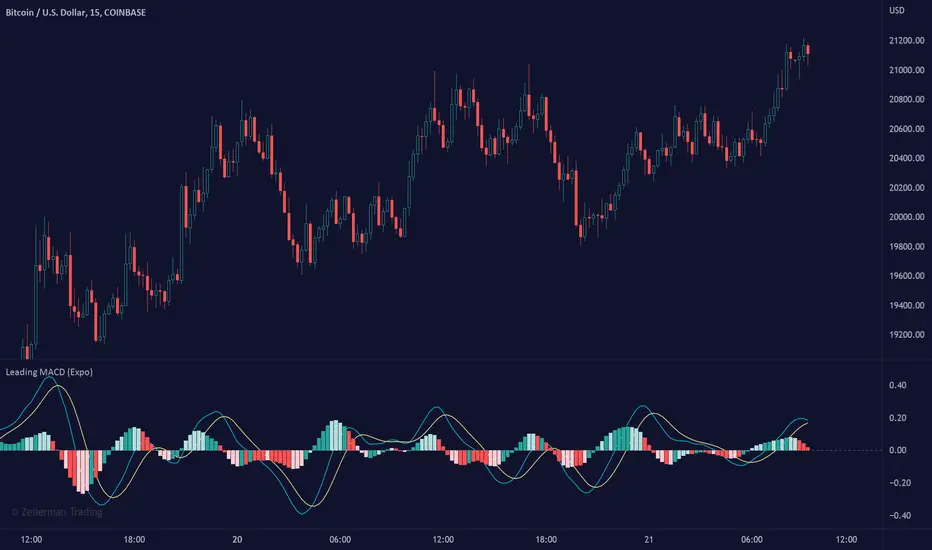
Leading MACD (Expo)Leading MACD (Expo) is designed to anticipate future price action, enabling traders to predict market movements ahead of time. The idea of a leading indicator is that traders can get in before the price move happens and ride the entire trend.
█ Moving average convergence divergence (MACD) is considered one of the most effective momentum and trend-following oscillators. However, the MACD is based on historical price action, making it a lagging indicator. A lagging indicator usually provides signals or insight once the price movement has passed or is in progress. That is why lagging indicators often are used to confirm a price trend or a move. On the other hand, the MACD histogram is more of a leading feature that can act as a sign of future trend changes.
█ The Leading MACD indicator takes all advantages of the traditional MACD and converts it into a fast-moving and leading oscillator that provides real-time insights about potential future price moves. As a result, it gives traders time to analyze a possible upcoming price move before it happens and be prepared for what's coming. However, the leading MACD should be combined with other forms of technical analysis to confirm potential entries and exits.
█ Leading vs. Lagging MACD
The leading MACD looks ahead and helps traders prepare for potential price moves. The traditional (lagging) MACD confirms price action that already has happened. A leading indicator reacts quicker to price changes, while a lagging indicator reacts slower. The different types of MACD have their own advantages and drawbacks, so make sure you understand the leading MACD and see if it fits in with your trading strategy.
█ HOW TO USE
Use the Leading MACD to get insights about potential price changes ahead of time. Get insights about whether a bullish or bearish move is strengthening or weakening. Other common ways are looking for divergences, finding trends, and measuring current momentum.
-----------------
Disclaimer
Copyright by Zeiierman.
The information contained in my Scripts/Indicators/Ideas/Algos/Systems does not constitute financial advice or a solicitation to buy or sell any securities of any type. I will not accept liability for any loss or damage, including without limitation any loss of profit, which may arise directly or indirectly from the use of or reliance on such information.
All investments involve risk, and the past performance of a security, industry, sector, market, financial product, trading strategy, backtest, or individual's trading does not guarantee future results or returns. Investors are fully responsible for any investment decisions they make. Such decisions should be based solely on an evaluation of their financial circumstances, investment objectives, risk tolerance, and liquidity needs.
My Scripts/Indicators/Ideas/Algos/Systems are only for educational purposes!
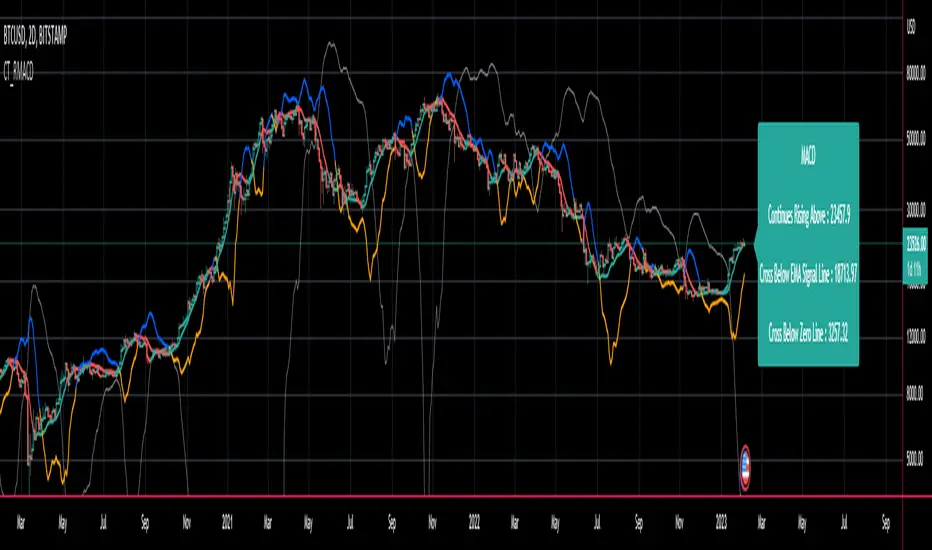
CT Reverse MACD CrossIntroducing the Reverse MACD Cross
MACD.... short for moving average convergence/divergence, is a trading indicator used in technical analysis of stock prices, created by Gerald Appel in the late 1970s.
It is designed to reveal changes in the strength, direction, momentum, and duration of a trend in a stock's price.
Prior work by Johny Dough showed how we can compute the price level required to make the MACD stay at its current level,
and also how to compute the price level required for the MACD to cross the zero line.
I have brought that idea to it logical conclusion for the MACD by creating a new function which also computes the price level required to cross the MACD with its signal line.
This allows the user to quickly see all of the most relevant information from the MACD and the actual price levels where the indicator will change its posture.
The MACD indicator (or "oscillator") is a collection of three time series calculated from historical price data, most often the closing price.
These three series are:
the MACD series proper shown here in blue
the "Signal Line" or "average" series shown here in red
the "Divergence" series which is the difference between the two shown here as a histogram.
There is also usually a baseline set at zero.
The MACD series is the difference between a "fast" (short period) exponential moving average (EMA), and a "slow" (longer period) EMA of the price series.
The average series (signal line) is an EMA of the MACD series itself.
The MACD indicator thus depends on three parameters, namely the time periods of the three EMAs.
The notation "MACD ( a, b, c )" usually denotes the standard indicator where the MACD series is the difference of EMAs with characteristic times a and b, and the average series is an EMA of the MACD series with characteristic time c.
There is an infobox which displays...
Whether the MACD is falling or rising
the price level which will make the MACD to change from rising to falling or vice versa
the price level which will cause the MACD to cross the signal line
the price level which will cause the MACD to cross the zero line
The most commonly used values are 12 for the fast, 26 for the slow, and 9 for the signal line, that is, MACD ( 12, 26, 9 ) .
The MACD and average series are customarily displayed as continuous lines in a plot whose horizontal axis is time oscillating above and below a zero line, whereas the divergence is commonly shown as a bar graph / histogram.
A fast EMA responds more quickly than a slow EMA to recent changes in a stock's price.
By comparing EMAs of different periods, the MACD series can indicate changes in the trend of a stock.
It is claimed that the divergence series can reveal subtle shifts in the stock's trend.
Since the MACD is based on moving averages, it is a lagging indicator. As a future metric of price trends, the MACD is less useful for stocks that are not trending (trading in a range) or are trading with unpredictable price action.
Jurik JMA/DWMA MACDHello friends,
Meet the Jurik JMA/DWMA MACD — an oscillator version of the crossover system originally recommended by Mark Jurik. It combines the Jurik Moving Average (JMA) and the Double Weighted Moving Average (DWMA) to form a smooth yet highly responsive convergence/divergence signal.
🛠 How It Works
Unlike standard EMA-based MACDs, this version uses Jurik's advanced non-lagging smoothing method to eliminate noise without sacrificing responsiveness , resulting in exceptionally clear and timely momentum readings.
I use the best original JMA clone available on TradingView — its behavior closely matches the genuine Jurik algorithm.
As Mark Jurik stated:
“Of all the different combinations of moving average filters to use for a MACD oscillator, we prefer using the JMA–DWMA combination.”
This oscillator measures the distance between JMA and DWMA, revealing when short-term momentum diverges from the longer-term trend. The result is a non-lagging MACD-style signal that highlights shifts in trend strength, early reversals, and exhaustion zones — all with Jurik-level smoothness and precision.
🔥 Key Features
Non-lagging, noise-reduced oscillator response
Peak highlighting
Built-in alerts for bullish and bearish peaks
If you'd like access or have any questions, feel free to reach out to me directly via DM.
👋 Good luck and happy trading!
付费脚本

RSI + MACD Multi-Timeframe StrategyThis strategy combines the Relative Strength Index (RSI) from the daily timeframe with the Moving Average Convergence Divergence (MACD) from the 4-hour timeframe to generate precise long entry and exit signals.
The system uses a multi-timeframe approach to align longer-term trend conditions with shorter-term momentum shifts — allowing traders to catch dips with confirmation and exit before reversals.
🧠 Strategy Logic
✅ Long Entry Condition:
- RSI on the daily (1D) timeframe is oversold (below your defined threshold)
- MACD on the 4H timeframe crosses above the signal line
→ A long trade is opened when these two align
✅ Long Exit Condition:
- RSI on the daily timeframe is overbought
- MACD on the 4H timeframe crosses below the signal line
→ The long trade is closed when these two conditions are met
💡 This strategy currently supports long entries only. Short logic can be added if needed.
📊 Indicator Components
🔹 RSI (Relative Strength Index):
- A momentum oscillator that measures the speed and magnitude of price changes.
- Helps identify overbought (potential sell) and oversold (potential buy) conditions.
- Applied on the 1D timeframe (by default) to reflect broader market trend or exhaustion levels.
🔹 MACD (Moving Average Convergence Divergence):
- A trend-following momentum indicator based on moving averages.
- The MACD Line (fast EMA - slow EMA) crossing above the Signal Line indicates bullish momentum.
- Used here on the 4-hour timeframe (by default) for shorter-term momentum confirmation.
🔹 Multi-Timeframe (MTF) Logic:
- Uses request.security() to pull higher timeframe data (1D for RSI, 4H for MACD).
- Ensures no repainting, as it only uses closed candles from the higher timeframe.
- Aligns longer-term signals with shorter-term entries, reducing false signals.
📈 Plotting Options
The script includes a plot selector input allowing you to toggle between:
- RSI Plot (with overbought/oversold lines)
- MACD Plot (MACD line and signal line)
- This helps visualize signal conditions clearly on your chart.
🛠 Customization
- RSI & MACD settings are fully configurable
- RSI and MACD timeframes can be adjusted independently
⚠️ Disclaimer
This strategy is provided for educational and informational purposes only.
It is not financial advice or a recommendation to buy or sell any asset.
Past performance does not guarantee future results. Always test strategies in a simulated environment before live use, and consult with a licensed financial advisor for investment decisions.

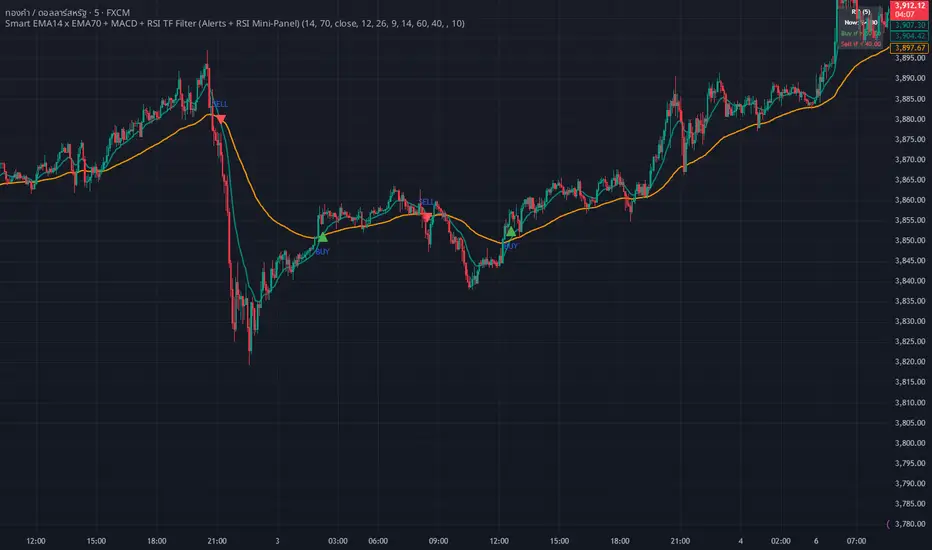
WHANG EMA-MACD🔥 Smart EMA14 x EMA70 + MACD Trend Alert System
Description:
Tired of chasing false signals?
This simple but powerful indicator helps you catch real trend moves — not the noise.
When EMA14 crosses EMA70 with MACD confirmation, and both EMAs point the same way, you’ll get a clean Buy or Sell alert right on your chart.
No messy settings, no guessing — just clear signals in strong trends.
✨ Features:
🔔 Real-time alerts via “Any alert() function call”
🟢 Buy when EMA14 crosses above EMA70 + MACD > 0
🔴 Sell when EMA14 crosses below EMA70 + MACD < 0
📈 Trades only when both EMAs slope in the same direction
⚙️ Customizable inputs for any market or timeframe
How to use:
Add the indicator to your chart
Create an alert → choose Any alert() function call
Relax and wait for your signals — no need to watch every candle!
Perfect for traders who want to follow the trend, avoid sideways traps, and get early alerts when momentum kicks in 🚀
Divergence Indicator Multi [TradingFinder] MACD AO RSI DIV Chart🔵 Introduction
🟣 What is Divergence in Financial Markets?
Divergence in technical analysis happens when the price of a stock moves in a direction opposite to certain indicators. This is a crucial concept in financial markets as it can signal either a trend reversal or a continuation of the current correction in the trend. Understanding divergence helps traders and analysts make more informed decisions.
🟣 Positive Regular Divergence (RD+)
A positive regular divergence occurs at the end of a downtrend, where two price lows form. This divergence appears when the price chart shows a new low, but the indicator does not follow, signaling potential buying opportunities.
Positive divergence indicates increased buying pressure and reduced selling pressure, making it a useful signal for forecasting price increases.
🟣 Negative Regular Divergence (RD-)
A negative regular divergence is seen during an uptrend when two price highs form. The price chart records a new high, but the indicator does not reflect this change, suggesting that a market downturn is likely.
This type of divergence shows strong selling pressure and weaker buying activity, which can help identify selling opportunities.
Both positive and negative divergences are powerful tools for identifying potential trend reversals and key support and resistance levels. For example, when an indicator trends upward while the price moves downward, this creates divergence, warning traders to reconsider their investment strategy.
🟣 Different Types of Divergence in Trading
1. Regular Divergence :
o Positive Regular Divergence (RD+)
o Negative Regular Divergence (RD-)
2. Hidden Divergence :
o Positive Hidden Divergence (HD+)
o Negative Hidden Divergence (HD-)
3.Time Divergence.
Note : This guide focuses specifically on Regular Divergence.
🟣 What is Regular Divergence?
Regular Divergence, often referred to as convergence, occurs when price action and indicators show conflicting patterns, usually signaling the end of a trend. Detecting regular divergence helps traders anticipate potential trend reversals or the formation of reversal patterns.
🔵 How to Use
To optimize the detection of divergence, you can adjust the Fractal Period to specify the length of time for identifying divergence patterns.
Additionally, with the Divergence Detection Method, you can select oscillators like the MACD, RSI, or AO to base divergence detection on.
Divergence in MACD :
MACD divergence occurs when the price chart forms an opposite pattern compared to the MACD line, indicating a potential price reversal.
Divergence in RSI :
In a downtrend, if the price chart forms two consecutive lows with the second lower than the first, but the RSI shows two lows with the second higher, this indicates positive regular divergence, which is a buy signal.
On the other hand, during an uptrend, if the price forms two highs with the second higher than the first, but the RSI shows the second high lower, this points to negative regular divergence, indicating a sell signal.
Divergence in AO (Awesome Oscillator) :
The AO indicator calculates histograms using the difference between 5-period and 34-period simple moving averages. It compares peaks and troughs of these histograms with price movements, detecting divergence and plotting lines and arrows to signal divergence.
🔵 Table
The following table breaks down the main features of the oscillator. It covers four critical categories: Exist, Consecutive, Divergence Quality, and Change Phase Indicator.
Exist : If divergence is detected, a "+" will appear in this row.
Consecutive: Shows the number of consecutive divergences that have formed in a short period.
Divergence Quality : Evaluates the quality of the divergence based on the number of occurrences. One is labeled "Normal," two are "Good," and three or more are considered "Strong."
Change Phase Indicator : If a phase change is detected between two oscillation peaks, this is marked in the table.

BE - OBV MACD█ Overview
BE - OBV MACD - Algo Trading is an indicator developed to analyze volume , MACD and PSAR simultaneously in order to understand how they are co-related to each other. This tool calculates the likelihood of strength for buying or selling within the market direction.
█ Calculations
The algorithm individually computes the likelihood of flow of volumes (OBV, MACD & PSAR). A positive score is assigned for events where the Buyers volume is rising over the candle, MACD on the price is rising and MACD on the OBV is providing positive output and the PSAR is Below the close price thus generating the Buy Signal, and a negative score for the vise versa thus generating the Sell Signal.
Note: Since this indicator is an overlay indicator MACD and OBV is not shown on the chart. One can add them on the chart if you wish to analyze the impact of the same.
█ Settings
Customization of settings is possible for risk management concepts like setting the initial SL level, Trail SL Level, Day Max Level.
Hide or Show plots and Table is possible from the indicator settings.
-----------------
Disclaimer
The information contained in my Scripts/Indicators/Ideas/Algos/Systems does not constitute financial advice or a solicitation to buy or sell any securities of any type. I will not accept liability for any loss or damage, including without limitation any loss of profit, which may arise directly or indirectly from the use of or reliance on such information.
All investments involve risk, and the past performance of a security, industry, sector, market, financial product, trading strategy, back-test, or individual's trading does not guarantee future results or returns. Investors are fully responsible for any investment decisions they make. Such decisions should be based solely on an evaluation of their financial circumstances, investment objectives, risk tolerance, and liquidity needs.
My Scripts/Indicators/Ideas/Algos/Systems are only for educational purposes!
