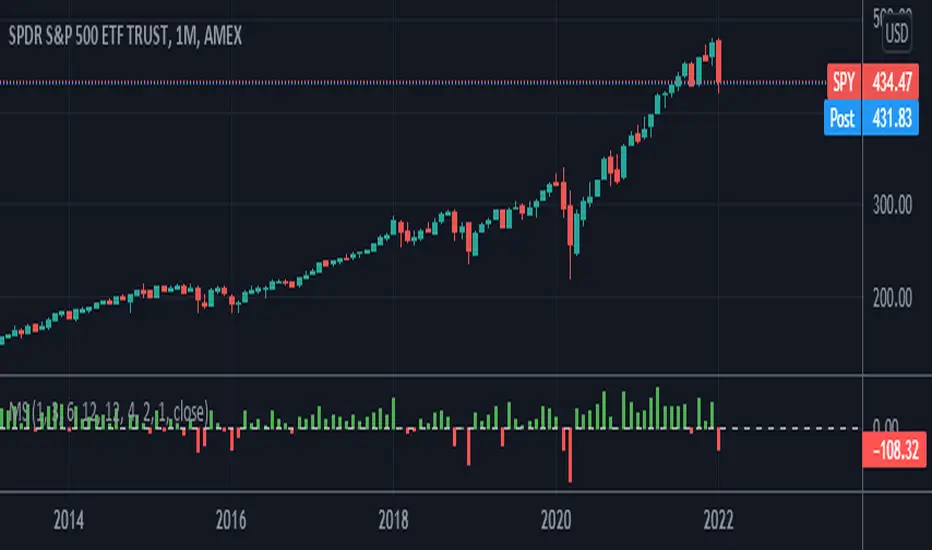
Momentum ScoreMomentum is the tendency of assets that have gone up in price to continue going up in price - and for assets that have gone down in price to continue going down in price. The reasons behind it are not well understood by academics, but momentum is a property that exists across geographies and asset classes.
The Momentum Score is a system that scores companies based on their one year total returns, excluding the last month of returns. In other words, a momentum score for today will be based on the total returns of a stock from 12 months ago today to one month ago today.
Our Momentum Score 13612W has the following composition:
MS 13612W = 12 * Roc(1) + 4 * Roc(3) + 2 * Roc(6) + 1 * Roc(12)
with ROC = (p0/pt) - 1, where pt equals price p with a t-month lag
在脚本中搜索"momentum"
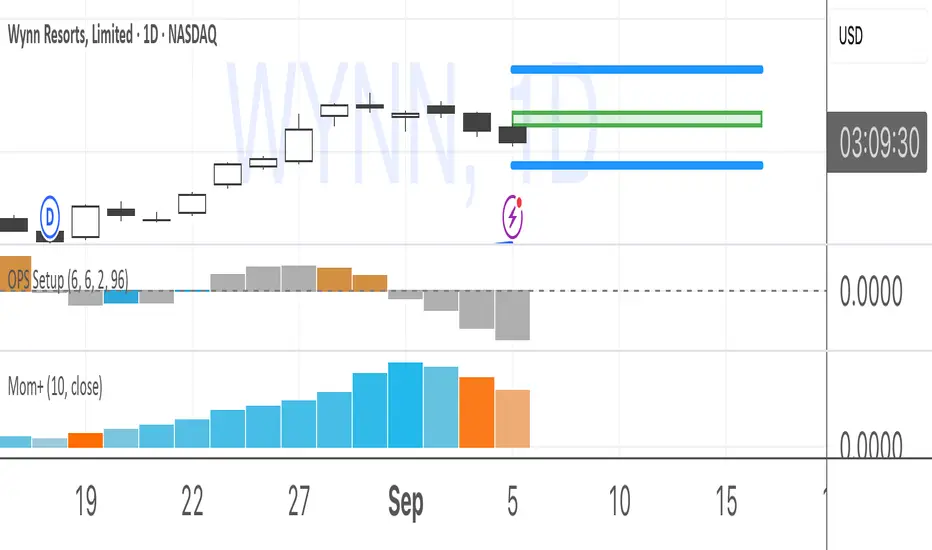
Momentum With Bullish & Bearish LabelMOMENTUM WITH BULLISH AND BEARISH SIGNALS
This is a momentum oscillator that paints red or green depending on whether Momentum is above or below the zero line. It includes a label on the right hand side that will reflect the bullish or bearish direction of the current momentum by changing colors to red or green and text telling you Bullish or Bearish.
***HOW TO USE***
When Momentum is above zero, it is bullish. When Momentum is below zero it is bearish.
A label on the right side will update in real time to tell you if momentum is Bullish or Bearish for faster recognition of the trend.
When momentum is above the zero line(Bullish) but trending downward, a second label will show up in purple to notify you of a change in momentum direction.
When momentum is below the zero line(Bearish) but trending upward, a second label will show up in purple to notify you of a change in momentum direction.
This indicator was built to help you quickly identify the Bullish or Bearish nature of the current Momentum using colors as well as a live color changing label so you can glance at the label and understand it's direction without analyzing the indicator data.
***MARKETS***
This indicator can be used as a signal on all markets, including stocks, crypto, futures and forex.
***TIMEFRAMES***
This momentum indicator can be used on all timeframes.
***TIPS***
Try using numerous indicators of ours on your chart so you can instantly see the bullish or bearish trend of multiple indicators in real time without having to analyze the data. Some of our favorites are our Auto Fibonacci, Directional Movement Index, Volume Profile, Auto Support And Resistance and Money Flow Index in combination with this Momentum Oscillator. They all have real time Bullish and Bearish labels as well so you can immediately understand each indicator's trend.

Momentum Volume Divergence (MVD) EnhancedMomentum Volume Divergence (MVD) Enhanced is a powerful indicator that detects price-momentum divergences and momentum suppression for reversal trading. Optimized for XRP on 1D charts, it features dynamic lookbacks, ATR-adjusted thresholds, and SMA confirmation. Signals include strong divergences (triangles) and suppression warnings (crosses). Includes a detailed user guide—try it out and share your feedback!
Setup: Add to XRP 1D chart with defaults (mom_length_base=8, vol_length_base=10). Signals: Red triangle (sell), Green triangle (buy), Orange cross (bear warning), Yellow cross (bull warning). Confirm with 5-day SMA crossovers. See full guide for details!
Disclaimer: This indicator is for educational purposes only, not financial advice. Trading involves risk—use at your discretion.
Momentum Volume Divergence (MVD) Enhanced Indicator User Guide
Version: Pine Script v6
Designed for: TradingView
Recommended Use: XRP on 1-day (1D) chart
Date: March 18, 2025
Author: Herschel with assistance from Grok 3 (xAI)
Overview
The Momentum Volume Divergence (MVD) Enhanced indicator is a powerful tool for identifying price-momentum divergences and momentum suppression patterns on XRP’s 1-day (1D) chart. Plotted below the price chart, it provides clear visual signals to help traders spot potential reversals and trend shifts.
Purpose
Detect divergences between price and momentum for buy/sell opportunities.
Highlight momentum suppression as warnings of fading trends.
Offer actionable trading signals with intuitive markers.
Indicator Components
Main Plot
Volume-Weighted Momentum (vw_mom): Blue line showing momentum adjusted by volume.
Above 0 = bullish momentum.
Below 0 = bearish momentum.
Zero Line: Gray dashed line at 0, separating bullish/bearish zones.
Key Signals
Strong Bearish Divergence:
Marker: Red triangle at the top.
Meaning: Price makes a higher high, but momentum weakens, confirmed by a drop below the 5-day SMA.
Action: Potential sell/short signal.
Strong Bullish Divergence:
Marker: Green triangle at the bottom.
Meaning: Price makes a lower low, but momentum strengthens, confirmed by a rise above the 5-day SMA.
Action: Potential buy/long signal.
Bearish Suppression:
Marker: Orange cross at the top + red background.
Meaning: Strong bullish momentum with low volume in a volume downtrend, suggesting fading strength.
Action: Warning to avoid longs or exit early.
Bullish Suppression:
Marker: Yellow cross at the bottom + green background.
Meaning: Strong bearish momentum with low volume in a volume uptrend, suggesting fading weakness.
Action: Warning to avoid shorts or exit early.
Debug Plots (Optional)
Volume Ratio: Gray line (volume vs. its MA) vs. yellow line (threshold).
Momentum Threshold: Purple lines (positive/negative momentum cutoffs).
Smoothed Momentum: Orange line (raw momentum).
Confirmation SMA: Purple line (price trend confirmation).
Labels
Text labels (e.g., "Bear Div," "Bull Supp") mark detected patterns.
How to Use the Indicator
Step-by-Step Trading Process
1. Monitor the Chart
Load your XRP 1D chart with the indicator applied.
Observe the blue vw_mom line and signal markers.
2. Spot a Signal
Primary Signals: Look for red triangles (strong_bear) or green triangles (strong_bull).
Warnings: Note orange crosses (suppression_bear) or yellow crosses (suppression_bull).
3. Confirm the Signal
For Strong Bullish Divergence (Buy):
Green triangle appears.
Price closes above the 5-day SMA (purple line) and a recent swing high.
Optional: Volume ratio (gray line) exceeds the threshold (yellow line).
For Strong Bearish Divergence (Sell):
Red triangle appears.
Price closes below the 5-day SMA and a recent swing low.
Optional: Volume ratio (gray line) falls below the threshold (yellow line).
4. Enter the Trade
Long:
Buy at the close of the signal bar.
Stop loss: Below the recent swing low or 2 × ATR(14) below entry.
Short:
Sell/short at the close of the signal bar.
Stop loss: Above the recent swing high or 2 × ATR(14) above entry.
5. Manage the Trade
Take Profit:
Aim for a 2:1 or 3:1 risk-reward ratio (e.g., risk $0.05, target $0.10-$0.15).
Or exit when an opposite suppression signal appears (e.g., orange cross for longs).
Trailing Stop:
Move stop to breakeven after a 1:1 RR move.
Trail using the 5-day SMA or 2 × ATR(14).
Early Exit:
Exit if a suppression signal appears against your position (e.g., suppression_bull while short).
6. Filter Out Noise
Avoid trades if a suppression signal precedes a divergence within 2-3 days.
Optional: Add a 50-day SMA on the price chart:
Longs only if price > 50-SMA.
Shorts only if price < 50-SMA.
Example Trades (XRP 1D)
Bullish Trade
Signal: Green triangle (strong_bull) at $0.55.
Confirmation: Price closes above 5-SMA and $0.57 high.
Entry: Buy at $0.58.
Stop Loss: $0.53 (recent low).
Take Profit: $0.63 (2:1 RR) or exit on suppression_bear.
Outcome: Price hits $0.64, exit at $0.63 for profit.
Bearish Trade
Signal: Red triangle (strong_bear) at $0.70.
Confirmation: Price closes below 5-SMA and $0.68 low.
Entry: Short at $0.67.
Stop Loss: $0.71 (recent high).
Take Profit: $0.62 (2:1 RR) or exit on suppression_bull.
Outcome: Price drops to $0.61, exit at $0.62 for profit.
Tips for Success
Combine with Price Levels:
Use support/resistance zones (e.g., weekly pivots) to confirm entries.
Monitor Volume:
Rising volume (gray line above yellow) strengthens signals.
Adjust Sensitivity:
Too many signals? Increase div_strength_threshold to 0.7.
Too few signals? Decrease to 0.3.
Backtest:
Review 20-30 past signals on XRP 1D to assess performance.
Avoid Choppy Markets:
Skip signals during low volatility (tight price ranges).
Troubleshooting
No Signals:
Lower div_strength_threshold to 0.3 or mom_threshold_base to 0.2.
Check if XRP’s volatility is unusually low.
False Signals:
Increase sma_confirm_length to 7 or add a 50-SMA filter.
Indicator Not Loading:
Ensure the script compiles without errors.
Customization (Optional)
Change Colors: Edit color.* values (e.g., color.red to color.purple).
Add Alerts: Use TradingView’s alert menu for "Strong Bearish Divergence Confirmed," etc.
Test Other Assets: Experiment with BTC or ETH, adjusting inputs as needed.
Disclaimer
This indicator is for educational purposes only and not financial advice. Trading involves risk, and past performance does not guarantee future results. Use at your own discretion.
Setup: Use on XRP 1D with defaults (mom_length_base=8, vol_length_base=10). Signals: Red triangle (sell), Green triangle (buy), Orange cross (bear warning), Yellow cross (bull warning). Confirm with 5-day SMA cross. Stop: 2x ATR(14). Profit: 2:1 RR or suppression exit. Full guide available separately!

Momentum 2.0 [AstrideUnicorn]Momentum 2.0 is a normalized Momentum oscillator with a moving base-level. The oscillator value is normalized by its standard deviation, similar to the z-score technique. Instead of the zero level, the indicator uses the base-level calculated as the inverted long-term average value of the oscillator. Similar to the zero-level crossing signal used for the Momentum oscillator, our oscillator calculates the base level crossing signal.
The moving base-level helps to reduce the number of false signals. In an uptrend the base-level is below zero, in a downtrend it is above it. This allows us to take into account the trend stability effect. In this case, to form a reversal signal, the oscillator must cross a lower value in an uptrend and a higher value in a downtrend.
HOW TO USE
When the oscillator crosses above the base-level, it gives a bullish signal, when below it gives a bearish signal. The signals are displayed as green and red labels, respectively.
The color of the histogram shows the current direction of the price momentum. Green indicates an upward move and red indicates a downward move. The blue line represents the base-level.
SETTINGS
Oscillator Period - determines the period of the Momentum oscillator
Base Level Period - determines the period used for long-term averaging when calculating the base-level and normalizing the oscillator

Momentum+This script provides a colored histogram of recent price action with the price derivative method for finding momentum.
Momentum of Relative strength to Index Leaf_West styleMomentum of Relative Strength to index as used by Leaf_West. This is to be used with the companion Relative Strength to Index indicator Leaf_West Style. Make sure you use the same index for comparison. If you follow his methods be aware of the different moving averages for the different time periods. From Leaf_West: "on my weekly and monthly R/S charts, I include a 13 EMA of the R/S (brown dash line) and an 8 SMA of the 13 EMA (pink solid line). The indicator on the bottom of the weekly/monthly charts is an 8 period momentum indicator of the R/S line. The red horizontal line is drawn at the zero line.
For daily or 130-minute time periods (or shorter), my R/S charts are slightly different - the moving averages of the R/S line include a 20EMA (brown dash line), a 50 EMA (blue dash line) and an 8 SMA of the20 EMA (pink solid line). The momentum indicator is also slightly different from the weekly/monthly charts – here I use a 12 period calculation (vs 8 SMA period for the weekly/monthly charts)." Leaf's methods do evolve and so watch for any changes to the preferred MAs etc..

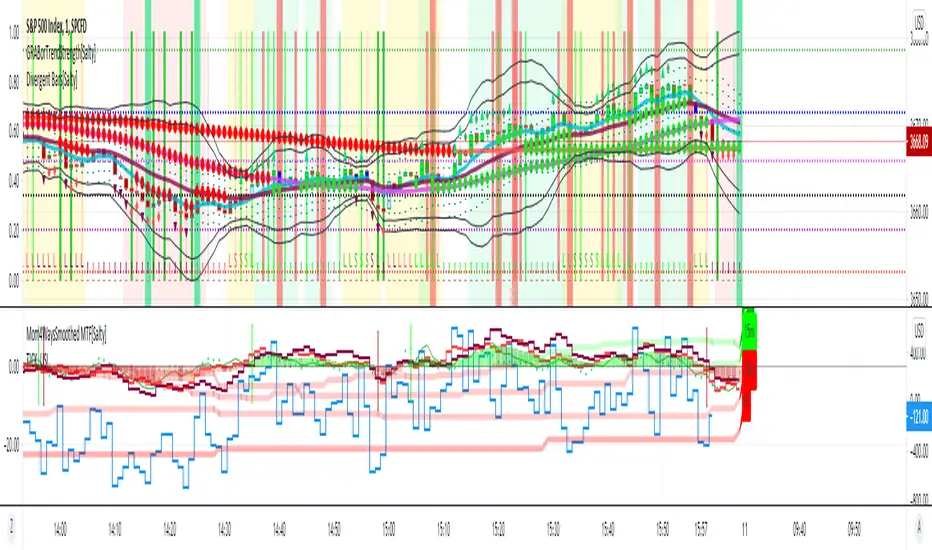
Momentum 4 Ways Smoothed MTF [Salty]This script improves on the existing Momentum 4 Ways Smoothed indicator by showing the smoothed values for Week (labeled W), Day (labeled D), and Hour (labeled H) along with the detailed values for the currently selected time frame. This allows the user to compare the momentum in the current time with other time frames easily. For example, one can see the detailed momentum lines on the 15 minute time frame while also seeing the smoothed value for the Week, Day, and Hour lines to know when the lower value time frame is in sync with the higher time frames.
Momentum 4 Ways [Salty]This script provides the ability to see 4 momentum values at once and a combined average of all 4 values. The user can see how fast momentum values are affecting the slow momentum values when all values are combined. Also, if the combined average value is greater than zero then momentum is considered bullish. Otherwise, values below zero are considered bearish.

Momentum Oscillator - Column PlotThis script is based on the existing Momentum Indicator which shows whether the underlying percentage change in closing price is positive or negative.
This script however uses columns to plot the change and shows this as green for >0 change, and red for <0.

Momentum Scalping & Swing Signals With AlertsThis Momentum indicator shows a green or red ribbon when smoothed momentum is bullish or bearish. It also includes a long moving average for overall trend confirmation. Wait until the ribbon holds above or below the long moving average and take positions in that direction.
To get an easier to read momentum indicator, I smoothed the momentum out and paired it next to a short term RMA. These two together form the ribbon that will show you early reversals and trend direction. The long moving average is used as an overall trend detector and confirmation for longer term trends.
***HOW TO USE***
Scalping: Enter longs when the ribbon turns green and enter shorts when the ribbon turns red. Exit positions when the ribbon turns the opposite color or crosses the long moving average.
Swing Trading: When the ribbon holds above the long moving average or breaks out and retests it, look for long positions and exit when the ribbon turns red or crosses the long moving average. When the ribbon holds below the long moving average or breaks down and retests it, look for short positions and exit when the ribbon turns green or crosses the long moving average.
***DETAILS***
This indicator gives early reversal signals very well and waiting for the momentum ribbon to cross the long moving average helps to get you into positions when the market is ready to really move while filtering out some of the noise.
The ribbon and background will change to green or red depending on whether it is currently bullish or bearish.
There is also a label that changes colors and tells you if momentum is bullish or bearish and also whether the momentum ribbon is above or below the long moving average.
Green or red circles will appear on the indicator when there is a bullish or bearish cross of the momentum ribbon and the long moving average.
It includes alerts that trigger when momentum is turning bullish/bearish or when the momentum ribbon is crossing the long moving average.
***CUSTOMIZATION***
Each piece of this indicator can be customized to suit your preferences including the momentum source, length, smoothing length, short moving average length and long moving average length. You can also turn off the labels, signals and long moving average. All of these settings can be managed within the indicator settings input tab.
***MARKETS***
This indicator can be used as a signal on all markets, including stocks, crypto, futures and forex.
***TIMEFRAMES***
This Momentum Scalping & Swing Signals indicator can be used on all timeframes.
***TIPS***
Try using numerous indicators of ours on your chart so you can instantly see the bullish or bearish trend of multiple indicators in real time without having to analyze the data. Some of our favorites are Trend Friend Scalp & Swing Trade Signals, Volume Spike Scanner, Buy & Sell Pressure Volume Profile, and RSI Scalper in combination with this momentum indicator. They all have real time Bullish and Bearish labels as well so you can immediately understand each indicator's trend.

Momentum Shift Oscillator (MSO) [SharpStrat]Momentum Shift Oscillator (MSO)
The Momentum Shift Oscillator (MSO) is a custom-built oscillator that combines the best parts of RSI, ROC, and MACD into one clean, powerful indicator. Its goal is to identify when momentum shifts are happening in the market, filtering out noise that a single momentum tool might miss.
Why MSO?
Most traders rely on just one momentum indicator like RSI, MACD, or ROC. Each has strengths, but also weaknesses:
RSI → great for overbought/oversold, but often lags in strong trends.
ROC (Rate of Change) → captures price velocity, but can be too noisy.
MACD Histogram → shows trend strength shifts, but reacts slowly at times.
By blending all three (with adjustable weights), MSO gives a balanced view of momentum. It captures trend strength, velocity, and exhaustion in one oscillator.
How MSO Works
Inputs:
RSI, ROC, and MACD Histogram are calculated with user-defined lengths.
Each is normalized (so they share the same scale of -100 to +100).
You can set weights for RSI, ROC, and MACD to emphasize different components.
The components are blended into a single oscillator value.
Smoothing (SMA, EMA, or WMA) is applied.
MSO plots as a smooth line, color-coded by slope (green rising, red falling).
Overbought and oversold levels are plotted (default: +60 / -60).
A zero line helps identify bullish vs bearish momentum shifts.
How to trade with MSO
Zero line crossovers → crossing above zero suggests bullish momentum; crossing below zero suggests bearish momentum.
Overbought and oversold zones → values above +60 may indicate exhaustion in bullish moves; values below -60 may signal exhaustion in bearish moves.
Slope of the line → a rising line shows strengthening momentum, while a falling line signals fading momentum.
Divergences → if price makes new highs or lows but MSO does not, it can point to a possible reversal.
Why MSO is Unique
Combines trend + momentum + velocity into one view.
Filters noise better than standalone RSI/MACD.
Adapts to both trend-following and mean-reversion styles.
Can be used across any timeframe for confirmation.

Momentum Oscillator, Divergences & Signals [TrendAlpha]The "Momentum, Real Time Divergences & Signals " indicator is designed to provide traders with insights into market momentum, identify potential divergences, and generate buy and sell signals. It offers a comprehensive set of features to assist traders in making informed trading decisions.
The indicator starts by calculating the momentum oscillator based on user-defined parameters.
- Traders can adjust the "Length" parameter to customize the sensitivity of the oscillator. The default value is set to 7, but it can be modified according to individual preferences.
- The "Source" parameter allows traders to select the input source for the oscillator calculation, with the default being the closing price of the asset.
- Traders have the option to display divergence lines by switching on the "Show Lines" parameter. This feature helps identify potential divergences between the oscillator and the price.
The oscillator is calculated using a two-step process. First, a smoothing function is applied to the source data using the "sma" (simple moving average) function. Then, the rate of change is computed over the specified length using the "mom" (momentum) function. Positive oscillator values indicate upward momentum, while negative values indicate downward momentum.
The indicator also generates buy and sell signals by identifying bullish and bearish divergences. A bullish divergence occurs when the oscillator is negative and crosses above zero, while a bearish divergence occurs when the oscillator is positive and crosses below zero. The indicator checks for specific conditions to confirm the divergences, such as comparing the current oscillator value with the previous value and validating the corresponding price action.
When a bullish or bearish divergence is detected, the indicator plots circles to highlight these signals on the chart. A green circle indicates a bullish signal, suggesting a potential buying opportunity, while a red circle indicates a bearish signal, suggesting a potential selling opportunity. In addition to circles, the indicator also displays labels to provide further clarity on the signals. A "Buy" label is shown for bullish signals, and a "Sell" label is shown for bearish signals.
To visually represent the divergences, the indicator plots lines connecting the corresponding points on the oscillator. A green line is drawn for bullish divergences, while a red line is drawn for bearish divergences. Traders can easily observe the divergence patterns and their relationships with the price action, aiding them in making trading decisions.
- The indicator also includes alert conditions for both bullish and bearish divergences. Traders can set up alerts to receive notifications when potential divergences occur, allowing them to take timely action.

Momentum TrackerDescription
To screen for momentum movers, one can filter for stocks that have made a noticeable move over a set period. This initial move defines the momentum or swing move. From this list of candidates, we can create a watchlist by selecting those showing a momentum pause, such as a pullback or consolidation, which later could set up for a continuation.
Momentum = Magnitude × Time
This Momentum Tracker indicator serves as a study tool to visualize when stocks historically met these momentum conditions. It marks on the chart where a stock would have appeared on the screener, allowing us to review past momentum patterns and screener requirements. The indicator measures momentum in three different ways:
Normalized Momentum
Identifies when the current price reaches a new high or low compared to a historical window. This is the most standardized measurement and adapts well across markets.
Normalized = Current Price ≥ Maximum Price in Lookback
Normalized = Current Price ≤ Minimum Price in Lookback
Relative Momentum
Measures the percentage difference between a fast and a slow moving average. This method helps capture acceleration, the rate at which momentum is building over time.
Relative = |Fast MA − Slow MA| ÷ Slow MA × 100
Absolute Momentum
Measures how far price has moved from the highest or lowest point within a defined lookback period.
Absolute = (Current Price − Lowest Price) ÷ Lowest Price × 100
Absolute = (Highest Price − Current Price) ÷ Highest Price × 100
Customization
The tool is customizable in terms of lookback period and thresholds to accommodate different trading styles and timeframes, allowing users to set criteria that align with specific hold times and momentum requirements. While the various calculations can be enabled, the tool is best used in isolation of each to visualize different momentum conditions.

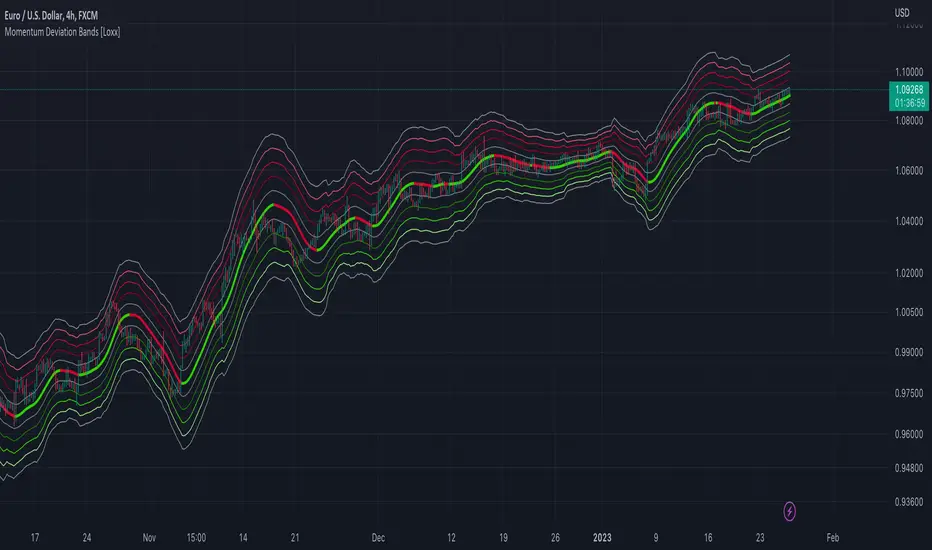
Momentum Deviation Bands [Loxx]Momentum Deviation Bands uses a variation of standard deviation. Instead of using price to calculate standard deviation, this uses momentum. This is another type of volatility that will be used in future indicators. This indicator serves more as an educational tool, but can also be used in trading.
You can read about the included moving averages here:
Included
Bar coloring
Momentum & Squeeze Oscillator [UAlgo]The Momentum & Squeeze Oscillator is a technical analysis tool designed to help traders identify shifts in market momentum and potential squeeze conditions. This oscillator combines multiple timeframes and periods to provide a detailed view of market dynamics. It enhances the decision-making process for both short-term and long-term traders by visualizing momentum with customizable colors and alerts.
🔶 Key Features
Custom Timeframe Selection: Allows users to select a custom timeframe for oscillator calculations, providing flexibility in analyzing different market periods.
Recalculation Option: Enables or disables the recalculation of the indicator, offering more control over real-time data processing.
Squeeze Background Visualization: Highlights potential squeeze conditions with a background color, helping traders quickly spot consolidation periods.
Adjustable Squeeze Sensitivity: Users can modify the sensitivity of the squeeze detection, tailoring the indicator to their specific trading style and market conditions.
Bar Coloring Condition: Option to color the price bars based on momentum conditions, enhancing the visual representation of market trends.
Threshold Bands: Option to fill threshold bands for a clearer visualization of overbought and oversold levels.
Reference Lines: Display reference lines for overbought, oversold, and mid-levels, aiding in quick assessment of momentum extremes.
Multiple Output Modes: Offers different output visualization modes, including:
ALL: Displays all calculated momentum values (fast, medium, slow).
AVG: Shows the average momentum, providing a consolidated view.
STD: Displays the standard deviation of momentum, useful for understanding volatility.
Alerts: Configurable alerts for key momentum events such as crossovers and squeeze conditions, keeping traders informed of important market changes.
🔶 Usage
The Momentum & Squeeze Oscillator can be used for various trading purposes:
Trend Identification: Use the oscillator to determine the direction and strength of market trends. By analyzing the average, fast, medium, and slow momentum lines, traders can gain insights into short-term and long-term market movements.
Squeeze Detection: The indicator highlights periods of low volatility (squeeze conditions) which often precede significant price movements. Traders can use this information to anticipate and prepare for potential breakouts.
Overbought/Oversold Conditions: The oscillator helps identify overbought and oversold conditions, indicating potential reversal points. This is particularly useful for timing entry and exit points in the market.
Momentum Shifts: By monitoring the crossover of momentum lines with key levels (e.g., the 50 level), traders can spot shifts in market momentum, allowing them to adjust their positions accordingly.
🔶 Disclaimer:
Use with Caution: This indicator is provided for educational and informational purposes only and should not be considered as financial advice. Users should exercise caution and perform their own analysis before making trading decisions based on the indicator's signals.
Not Financial Advice: The information provided by this indicator does not constitute financial advice, and the creator (UAlgo) shall not be held responsible for any trading losses incurred as a result of using this indicator.
Backtesting Recommended: Traders are encouraged to backtest the indicator thoroughly on historical data before using it in live trading to assess its performance and suitability for their trading strategies.
Risk Management: Trading involves inherent risks, and users should implement proper risk management strategies, including but not limited to stop-loss orders and position sizing, to mitigate potential losses.
No Guarantees: The accuracy and reliability of the indicator's signals cannot be guaranteed, as they are based on historical price data and past performance may not be indicative of future results.

Momentum Matrix (BTC-COIN)The Momentum Matrix (BTC-COIN) indicator analyzes the momentum relationship between Coinbase stock ( NASDAQ:COIN ) and Bitcoin ( CRYPTOCAP:BTC ). By combining RSI, correlation, and dominance metrics, it identifies bullish and bearish macro trends to align trades with market momentum.
How It Works
Price Inputs: Pulls weekly price data for CRYPTOCAP:BTC and NASDAQ:COIN for macro analysis.
Metrics Calculated:
• RSI Divergence: Measures momentum differences between CRYPTOCAP:BTC and $COIN.
• Price Ratio: Tracks the $COIN/ CRYPTOCAP:BTC relationship relative to its long-term average (SMA).
• Correlation: Analyzes price co-movement between CRYPTOCAP:BTC and $COIN.
• Dominance Impact: Incorporates CRYPTOCAP:BTC dominance for broader crypto trends.
Composite Momentum Score: Combines these metrics into a smoothed macro momentum value.
Thresholds for Trend Detection: Upper and lower thresholds dynamically adapt to market conditions.
Signals and Visualization:
• Buy Signal: Momentum exceeds the upper threshold, indicating bullish trends.
• Sell Signal: Momentum falls below the lower threshold, indicating bearish trends.
• Background Colors: Green (bullish), Red (bearish).
Strengths
Integrates multiple metrics for robust macro analysis.
Dynamic thresholds adapt to market conditions.
Effective for identifying macro momentum shifts.
Limitations
Lag in high volatility due to smoothing.
Less effective in choppy, sideways markets.
Assumes CRYPTOCAP:BTC dominance drives NASDAQ:COIN momentum, which may not always hold true.
Improvements
Multi-Timeframe Analysis: Add daily or monthly data for precision.
Volume Filters: Include volume thresholds for signal validation.
Additional Metrics: Consider MACD or Stochastics for further confirmation.
Complementary Tools
Volume Indicators: OBV or cumulative delta for confirmation.
Trend-Following Systems: Pair with moving averages for timing.
Market Breadth Metrics: Combine with CRYPTOCAP:BTC dominance trends for context.

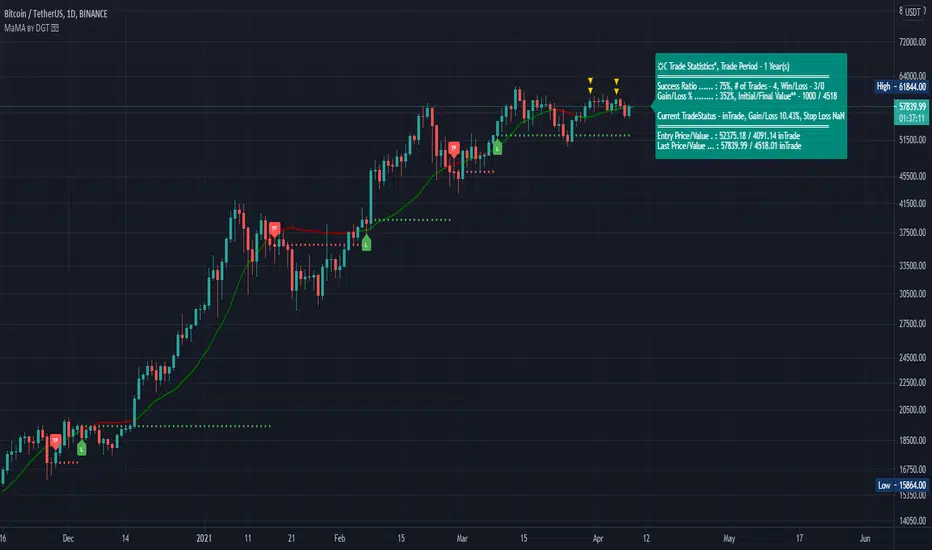
Momentum adjusted Moving Average by DGTA brand new Moving Average , calculated using Momentum, Acceleration and Probability (Psychological Effect).
Momentum adjusted Moving Average(MaMA) is an indicator that measures Price Action by taking into consideration not only Price movements but also its Momentum, Acceleration and Probability. MaMA, provides faster responses comparing to the regular Moving Average
Here is the math of the MaMA idea
Momentum measures change in price over a specified time period
momentum = source – source(length)
where,
source, indicates current bar’s price value
source(length), indicates historical price value of length bars earlier
Lets play with this formula and rewrite it by moving source(length) to other side of the equation
source = source(length) + momentum
to avoid confusion let’s call the source that we aim to predict as adjustedSource
adjustedSource = source(length) + momentum
looks nice the next value of source simply can be calculated by summing of historical value of the source value and value of the momentum. I wish it was so easy, the formula holds true only when the momentum is conserved/constant/steady but momentum move up or down with the price fluctuations (accelerating or decelerating)
Let’s add acceleration effects on our formula, where acceleration is change in momentum for a given length. Then the formula will become as (skipped proof part of acceleration effects, you may google for further details)
adjustedSource = source(length) + momentum + 1/2 * acceleration
here again the formula holds true when the acceleration is constant and once again it is not the case for trading, acceleration also changes with the price fluctuations
Then, how we can benefit from all of this, it has value yet requires additional approaches for better outcome
Let’s simulate behaviour with some predictive approach such as using probability (also known as psychological effect ), where probability is a measure for calculating the chances or the possibilities of the occurrence of a random event. As stated earlier above momentum and acceleration are changing with the price fluctuations, by using the probability approach we can add a predictive skill to determine the likelihood of momentum and acceleration changes (remember it is a predictive approach). With this approach, our equations can be expresses as follows
adjustedSource = source(length) + momentum * probability
adjustedSource = source(length) + ( momentum + 1/2 * acceleration ) * probability , with acceleration effect
Finally, we plot MaMA with the new predicted source adjustedSource, applying acceleration effect is made settable by the used from the dialog box, default value is true.
What to look for:
• Trend Identification
• Support and Resistance
• Price Crossovers
Recommended settings are applied as default settings, if you wish to change the length of the MaMA then you should also adjust length of Momentum (and/or Probability). For example for faster moving average such as 21 period it would be suggested to set momentum length to 13
Alternative usage , set moving average length to 1 and keep rest lengths with default values, it will produce a predictive price line based on momentum and probability. Experience acceleration factor by enabling and disabling it
Conclusion
MaMA provide an added level of confidence to a trading strategy and yet it is important to always be aware that it implements a predictive approach in a chaotic market use with caution just like with any indicator
Trading success is all about following your trading strategy and the indicators should fit within your trading strategy, and not to be traded upon solely
Disclaimer : The script is for informational and educational purposes only. Use of the script does not constitutes professional and/or financial advice. You alone the sole responsibility of evaluating the script output and risks associated with the use of the script. In exchange for using the script, you agree not to hold dgtrd TradingView user liable for any possible claim for damages arising from any decision you make based on use of the script
Momentum 4 Ways Smoothed [Salty]This is an enhance version of Momentum 4 Ways that shows 4 ways to calculate momentum and display each one along with their combined average value.
This study was created to compare 4 different momentum values against their combined average using different display styles to allow the user to experiment with different views of momentum.
- Added the ability to smooth the Average Momentum value. Default Smoothing value is 5.
- Added the ability to use different average calculations. Default is WMA.
- Added the ability to select the number of momentum values to average (1-4). Default is 4.
- Added the ability to use VWAP instead of price as the input.
The Smoothed Average Momentum line is color coded so that it is green when it is moving in the bullish direction and red when it is moving in the bearish direction.

Momentum RibbonThe Momentum Ribbon is a collection of Moving Averages which indicate the severity of pull-backs in a given market.
As the ribbon spreads apart, it indicates more and more significant support/resistance for a trending market. As it is compressed back together, it displays a blue colour to indicate a "cooling" of trend momentum.
Adjustable Moving Average periods and types! You can customize the parameters of your ribbon to your heart's content!

Momentum DivergenceOverview
The Momentum Divergence Oscillator is a valuable tool designed for traders who are familiar with basic charting but want to deepen their market insights. This indicator combines a momentum calculation with divergence detection, presenting the data in an intuitive way with a blue momentum line and colored divergence signals ("Bull" and "Bear"). It’s perfect for refining entry and exit points across various timeframes, especially for scalping or swing trading strategies.
Understanding the Concepts
What is Momentum?
Momentum measures the speed and strength of a price movement by comparing the current closing price to a previous close over a set period. In this indicator, it’s calculated as the difference between the current close and the close from a user-defined number of bars ago (default: 10). A rising momentum line indicates accelerating upward momentum, while a falling line suggests slowing momentum or a potential reversal. This helps you gauge whether a trend is gaining power or losing steam, making it a key indicator for spotting overbought or oversold conditions.
What is a Divergence?
A divergence occurs when the price action and the momentum indicator move in opposite directions, often signaling a potential trend reversal. The Momentum Divergence Oscillator highlights two types:
Bullish Divergence: When the price forms a lower low (indicating weakness), but the momentum shows a higher low (suggesting underlying strength). This can foreshadow an upward reversal.
Bearish Divergence: When the price reaches a higher high (showing strength), but the momentum records a lower high (indicating fading momentum). This may hint at an impending downward turn.
How the Indicator Works
The indicator plots a momentum line in a separate pane below your chart, giving you a clear view of price momentum over time. It also scans for divergences using adjustable lookback periods (default: 5 bars left and right) and a range window (default: 5-60 bars) to ensure relevance. When a divergence is detected, it’s visually highlighted, and you can customize the sensitivity through input settings like the momentum length and pivot lookback. Alerts are included to notify you of new divergence signals in real-time, saving you from constant monitoring.
How to Apply It
Identifying Opportunities: Use bullish divergences ("Bull") as a cue to consider long positions, especially when confirmed by support levels or a moving average crossover. Bearish divergences ("Bear") can signal short opportunities, particularly near resistance zones.
Combining with Other Tools: Pair this oscillator with indicators like the Relative Strength Index (RSI) or volume analysis to filter out false signals and increase confidence in your trades. For example, a bullish divergence with rising volume can be a stronger buy signal.
Timeframe Flexibility: Test it on shorter timeframes (e.g., 5-minute charts) for quick scalping trades or longer ones (e.g., 1-hour or 4-hour charts) for swing trading, adjusting the momentum length to suit the market’s pace.
Alert Setup: Enable the built-in alerts to get notified when a divergence forms, allowing you to react promptly without staring at the screen all day.
Strategy Example
Spot a bullish divergence on a 15-minute chart where the price hits a lower low, but the momentum rises.
Confirm with a break above a 20-period EMA and increasing volume.
Enter a long position with a stop-loss below the recent low and a take-profit near the next resistance level.
Customization Tips
Adjust the "Momentum Length" (default: 10) to make the oscillator more or less sensitive—shorter lengths react faster, while longer ones smooth out noise.
Tweak the "Pivot Lookback" settings to widen or narrow the divergence detection range based on your trading style.
Use the "Range Upper/Lower" inputs to focus on divergences within a specific timeframe that matches your strategy.
Important Considerations
b]This indicator is a technical analysis tool, not a guaranteed trading system. Always pair it with a solid strategy and strict risk management, such as setting stop-losses.
In strong trending markets, divergences can sometimes produce false signals. Consider adding a trend filter (e.g., ADX below 25) to avoid whipsaws.
Experiment with the settings on a demo account or backtest to find what works best for your preferred markets and timeframes.

Momentum Flip Pro - Advanced ZigZag Trading SystemMomentum Flip Pro - Advanced ZigZag Trading System
Complete User Guide
📊 What This Indicator Does
The Momentum Flip Pro is an advanced position-flipping trading system that automatically identifies trend reversals using ZigZag patterns combined with momentum analysis. It's designed for traders who want to always be in the market, flipping between long and short positions at optimal reversal points.
Key Features:
Automatically flips positions at each ZigZag reversal point
Dynamic stop loss placement at exact ZigZag levels
Real-time trading dashboard with performance metrics
Capital tracking and ROI calculation
Three momentum engines to choose from
🎯 How It Works
Entry Signal: When a ZigZag point appears (circle on chart), the indicator:
Exits current position (if any)
Immediately enters opposite position
Places stop loss at the exact ZigZag price
Exit Signal: Positions are closed when the next ZigZag appears, then immediately reversed
Position Management:
Long Entry: ZigZag bottom (momentum turns UP)
Short Entry: ZigZag peak (momentum turns DOWN)
Stop Loss: Always at the ZigZag entry price
Take Profit: Next ZigZag point (automatic position flip)
⚙️ Recommended Settings
For Day Trading (5m-15m timeframes):
Momentum Engine: Quantum
- RSI Length: 9-12
- Quantum Factor: 3.5-4.0
- RSI Smoothing: 3-5
- Threshold: 8-10
For Swing Trading (1H-4H timeframes):
Momentum Engine: MACD
- Fast Length: 12
- Slow Length: 26
- Signal Smoothing: 9
- MA Type: EMA
For Position Trading (Daily):
Momentum Engine: Moving Average
- Average Type: EMA or HMA
- Length: 20-50
📈 How to Use for Trading
Add to Chart:
Add indicator to your chart
Set your starting capital
Choose your preferred momentum engine
Understanding Signals:
Green circles: Strong bullish momentum reversal
Red circles: Strong bearish momentum reversal
Purple circles: Normal momentum reversal
Entry labels: Show exact entry points with tooltips
Trading Rules:
Enter LONG when you see an up arrow + green/purple circle
Enter SHORT when you see a down arrow + red/purple circle
Stop loss is automatically at the ZigZag level
Hold until next ZigZag appears (exit + reverse)
Risk Management:
Risk per trade = Entry Price - Stop Loss
Position size = (Capital * Risk %) / Risk per trade
Recommended risk: 1-2% per trade
💡 Best Practices
Market Conditions:
Works best in trending markets
Excellent for volatile pairs (crypto, forex majors)
Avoid during low volume/consolidation
Timeframe Selection:
Lower timeframes (5m-15m): More signals, higher noise
Higher timeframes (1H+): Fewer signals, higher reliability
Sweet spot: 15m-1H for most traders
Momentum Engine Selection:
Quantum: Best for volatile markets (crypto, indices)
MACD: Best for trending markets (forex, stocks)
Moving Average: Best for smooth trends (commodities)
📊 Dashboard Interpretation
The trading dashboard shows:
Current Capital: Your running balance
Position: Current trade direction
Entry/Stop: Your risk levels
Statistics: Win rate and performance
ROI: Overall return on investment
⚠️ Important Notes
Always Active: This system is always in a position (long or short)
No Neutral: You're either long or short, never flat
Automatic Reversal: Positions flip at each signal
Stop Loss: Fixed at entry ZigZag level (doesn't trail)
🎮 Quick Start Guide
Beginners: Start with default settings on 1H timeframe
Test First: Use paper trading to understand the signals
Small Size: Begin with 1% risk per trade
Track Results: Monitor the dashboard statistics
Adjust: Fine-tune momentum settings based on results
🔧 Customization Tips
Color Signals: Enable to see momentum strength
Dashboard Position: Move to preferred screen location
Visual Settings: Adjust colors for your theme
Alerts: Set up for automated notifications
This indicator is ideal for traders who prefer an always-in-market approach with clear entry/exit rules and automated position management. The key to success is choosing the right momentum engine for your market and maintaining disciplined risk management.

Momentum + Volume Percentile
This advanced momentum indicator combines smoothed momentum analysis with percentile-based volume filtering to identify high-quality trading opportunities backed by significant market participation.
How It Works:
The indicator calculates momentum (rate of change) over a customizable period and applies multiple smoothing techniques to reduce noise. It then filters price action by highlighting only periods where volume exceeds a specified percentile threshold.
The algorithm:
Calculates raw momentum based on price changes over the specified period
Applies customizable smoothing (SMA, EMA, WMA, or HMA) to the momentum values
Computes a moving average of the smoothed momentum as a trend reference
Analyzes volume over a lookback period to establish percentile rankings
Highlights candles where volume exceeds the percentile threshold with color-coded backgrounds
Distinguishes between bullish (green) and bearish (red) high-volume events

Momentum Candle ProjectionThis indicator projects future price momentum by calculating a directional vector from recent price movements. It uses a custom implementation of the atan2 function to create a vector average of the last N candles and visualizes this projection as a synthetic future candle.
🔍 What It Does:
✅ Tracks recent momentum using geometric vectors from price change.
✅ Projects a synthetic "momentum candle" one bar ahead, showing anticipated direction and magnitude.
✅ Optionally plots a secondary "future candle" based on a smoothed estimate of projected price vs. real current close.
⚙️ Settings:
Vector Lookback (bars): Controls how many bars are used to calculate the momentum vector.
Projection Length Multiplier: Adjusts how far forward the vector is projected based on its strength.
🟢 How To Use:
Use the lime/red projection candle to anticipate short-term directional bias.
Use the orange/maroon future candle to compare projected continuation vs. current closing price.
Spot early reversals, continuation zones, and momentum decay in real-time.
