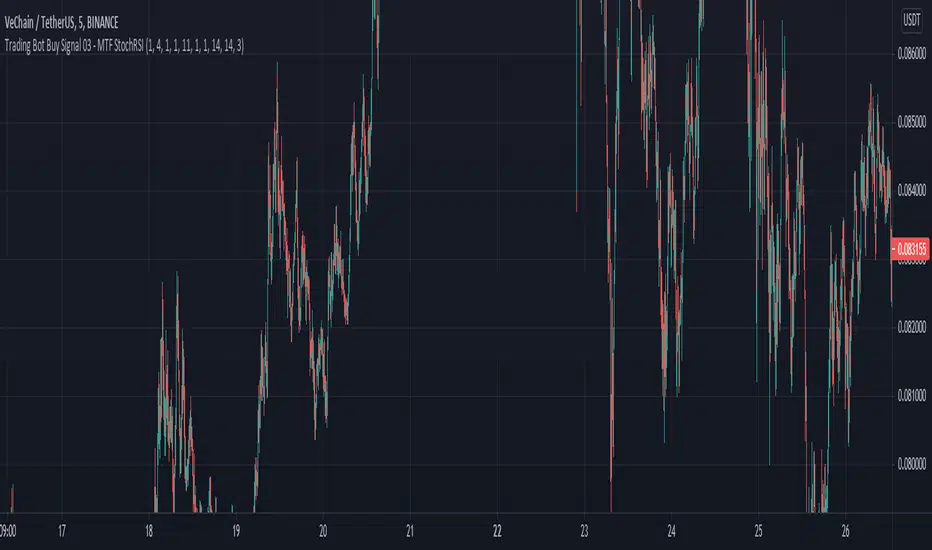
Trading Bot Buy Signal 03 - MTF StochRSIWelcome to our third Tradingview buy signal indicator.
We develop signals which have been specially developed for crypto trading bots. We publish new indicators at regular intervals.
This indicator is based on our "Trading Bot Buy Signal 03 Strategy - MTF StochRSI" strategy, so that you can apply and test this strategy to your charts/pairs.
The basic idea of this script is to use the stochastic RSI indicator in multiple Timeframes. When all selected timeframes show an oversold and in 5 Min Timeframe is an crossover, it triggers a solid buy signal. This strategy is relatively robust against false breakouts, even if these can of course never be avoided. These signals occur relatively rare, but you can set an alarm up on different pairs simultaneously. The strategy needs to be set up in 5 min chart cause of an additional crossover buy condition. It wasnt tested in Forex etc. but feel free to test it.
We recommend to base your sell strategy on trailing stop-loss and not indicator based. A traling stop-loss arming at 1% and trailing stop-loss percentage at 0.3% works well. Our goal was it to reduce the average coin holding time to a minimum. We recommend this procedure cause we believe in the power of long term uptrending crypto, compounding and dont want to sell at a loss in a false breakout. But you can handel it like you prefere.
This indicator using different timeframes so it is sending a repainting warning. Cause it calculates values in a different timeframe. But thats normal and it wont recalculate results.
Feel free to adjust the parameters to your preferences:
- Adjust the values of Stoch - K and Length of RSI and Main Stoch to change the sensitivity of the indicator
- Turn on different timeframes or leave default timeframes
- Adjust the oversold Limit of the StochRSI indicator to change results
We sell this indicator so it is invite only. But of cause you can test it before buying. Also you can freely test the strategy before. Simply check out our profil and look for "Trading Bot Buy Signal 03 Strategy - MTF StochRSI".
If there are questions, write them into the comments or contact us directly over the direct message. Happy Trading!
在脚本中搜索"mtf"
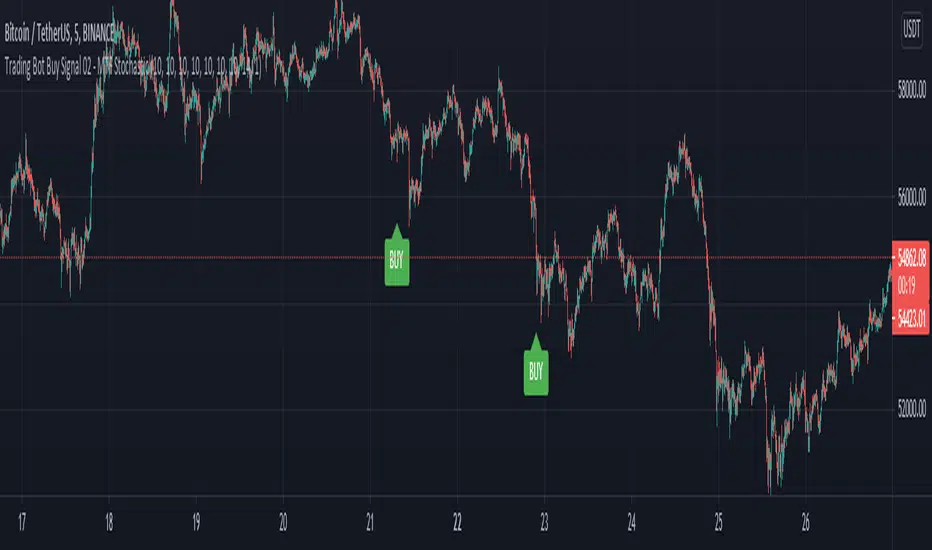
Trading Bot Buy Signal 02 - MTF StochasticWelcome to our second Tradingview buy signal indicator.
We develop signals which have been specially developed for crypto trading bots. We publish new indicators at regular intervals.
This indicator is based on our "Trading Bot Buy Signal 02 Strategy - MTF Stochastic" strategy, so that you can apply and test this strategy to your charts/pairs.
The basic idea of this script is to use the stochastic indicator in multiple Timeframes. When all selected timeframes show an oversold it triggers a solid buy signal. This strategy is relatively robust against false breakouts, even if these can of course never be avoided. These signals occur relatively rare, but you can set an alarm up on different pairs simultaneously. The strategy works best in 5 min chart and in crypto pairs. It wasnt tested in Forex etc. but feel free to test it.
We recommend to base your sell strategy on trailing stop-loss and not indicator based. A traling stop-loss arming at 1% and trailing stop-loss percentage at 0.3% works well. Our goal was it to reduce the average coin holding time to a minimum. We recommend this procedure cause we believe in the power of long term uptrending crypto, compounding and dont want to sell at a loss in a false breakout. But you can handel it like you prefere.
This indicator using different timeframes so it is sending a repainting warning. Cause it calculates values in a different timeframe. But thats normal and it wont recalculate results.
Feel free to adjust the parameters to your preferences:
- Adjust the values of Stoch - K and Stoch - D to change the sensitivity of the indicator
- Turn on different timeframes or leave default timeframes
- Adjust the threshold value of the stoch indicator to change results
We sell this indicator so it is invite only. But of cause you can test it before buying. Also you can freely test the strategy before. Simply check out our profil and look for "Trading Bot Buy Signal 02 Strategy - MTF Stochastic".
If there are questions, write them into the comments or contact us directly over the direct message. Happy Trading!
Multi Time Frame Bollinger Bands(Daily/4H/1H)/MTFボリンジャーバンドJapanese below. / 日本語説明は下記
-----Republishing after issues resolved.---------
Summary
This indicator shows 3 multi time frame Bollinger bands (MTF BB) from different time frames which is daily, 4 hour and 1 hour to lower time frames with 3 bands(+-1-3ς).
Example: If you set daily BB, it will be shown on daily, 4hour, 1hour, 30M, 15M, 5M and 1M charts. It will not appear on weekly and monthly charts as it is not necessary to see it on higher time frames.
Purpose
This indicator has been developed to show higher timeframe’s BB as they are expected to work as support and resistance .
How is it different from other BB indicators?
Problems with other conventional BB indicators are;
-If you set higher timeframe BB(MTF BB), it will also be shown on further higher time frames.
i.e. If you set 4hour chart BB on 1 hour or lower time frame charts, it will also appear on daily and weekly chart, which is not necessary.
-One indicator displays one BB only which impacts the number of indicators that you can set(depending on your account plan)
-One indicator displays one band only. If you need 1-3ς, you need to add the same BB indicator.
To tackle these problems, this indicator has incorporated functions below.
-Control timeframes where BB is displayed to eliminate unnecessary information on higher time frames.
-One indicator contains 3 BB with 3 bands(minus 1-3ς & plus 1-3ς) which contributes to save the number of indicators that you can set.
These are the value added on this indicator.
Spec
-This indicator shows daily BB, 4 hour BB and 1 hour BB.
To be clear, daily BB means that BB created based on daily chart , which can be shown on lower timeframes.
-Each BB displays 3 bands(minus 1-3ς & plus 1-3ς) and middle line
-Display of each band can be parameterized to show and not to show
e.g. Showing only plus/minus 2 and 3ς etc.
-The middle line adopts SMA ( simple moving average ) only and you can set period of SMA .
-Each BB will be shown as follows based on timeframes that you select.
Daily BB: Shown on daily, 4hour, 1 hour, 30M, 15M, 5M and 1M chart
(Weekly and Monthly chart does not show BB)
4hour BB: Shown on 4hour, 1 hour, 30M, 15M, 5M and 1M chart
(Daily, Weekly and Monthly chart does not show BB)
1hour BB: Shown on 1 hour, 30M, 15M, 5M and 1M chart
(4hour, Daily, Weekly and Monthly chart does not show BB)
-Each BB can be enabled and disabled by ticking checkbox.
e.g. On 1 hour chart, you can disable 4 hour BB and show daily BB only etc.
Please see the sample chart below.
Sample chart with the indicator
Daily chart
4hour chart showing daily BB and 4H BB
1hour chart showing daily BB, 4H BB and 1H BB
5Mchart showing daily BB, 4H BB and 1H BB
Journey to use indicator
This indicator is paid indicator and invited-only indicator.
Please contact me via private chat or follow links in my signature so that we can initiate the process to access the indicator
--------------------------------------------------------------------------------------------------
日足、4時間足、1時間足の3つのボリンジャーバンド(プラスマイナス1-3シグマのバンド)を下位足含めて表示するマルチタイムフレームボリンジャーバンドのインジケーターです。
インジケーターの目的
上位足のボリンジャーバンドを下位足に表示することで、レジサポの判断に使うことを想定しています。
他のボリンジャーバンドインジケーターとの違い
他のボリンジャーバンドインジケーターでは、よく以下の問題に直面します。
・上位足のボリンジャーバンドを表示しようとすると、さらに上位足でもそのバンドが表示されチャートがみにくくなる。
例: 4時間足のボリンジャーバンドを下位足で表示可能な様に設定すると、日足や週足でも表示され、チャートがノイズだらけに・・・
・一つのインジケーターでは一つのボリンジャーバンドのみ表示。異なる時間軸のボリンジャーバンドを表示しようとするとその数だけインジケーターを追加する必要あり。
・バンドが一つしか設定できず、1-3シグマまで表示しようとするとインジケーターを追加する必要がある。
これらの問題に対して、このインジケーターでは、
・ボリンジャーバンドを表示する時間軸を制御することで上位足側で不必要な情報を表示させない。これによりチャートをスッキリ見やすくすることができる。
・一つのインジケーターで3つの異なる時間軸のボリンジャーバンドを表示し、かつそれぞれでプラスマイナス1-3のバンドを表示することでインジケーター数を節約。
という機能を加えることでこれらの問題を解決しています。
これがこのインジケーターが提供する付加価値だと考えています。
仕様
機能概要
・このインジケーターでは日足、4時間足、1時間足の3つの時間軸のボリンジャーバンドを表示します。
・それぞれのボリンジャーバンドはプラスマイナス1-3シグマまでのバンドと基準線を表示します。
・各バンドは表示・非表示の切り替えが可能です。(例: プラスマイナス2、3シグマのみ表示など)
・各ボリンジャーバンドの基準線(ミドルライン)はSMA(単純移動平均線)です。移動平均線の期間は自由に設定できます。
・各ボリンジャーバンドは表示しているチャートの時間軸に応じて以下の様に表示されます。
日足のボリンジャーバンド : 日足, 4時間足、1時間足、30分足、15分足、5分足、1分足チャートにのみ表示(週足以上では非表示の仕様です。)
4時間足のボリンジャーバンド : 4時間足、1時間足、30分足、15分足、5分足、1分足チャートにのみ表示(日足以上では非表示の仕様です。)
1時間足のボリンジャーバンド : 1時間足、30分足、15分足、5分足、1分足チャートにのみ表示(4時間足以上では非表示の仕様です。)
・各ボリンジャーバンドは表示・非表示のフラグをON/OFFにすることで表示を制御することができます。
例えば1時間足のチャートでは日足のボリンジャーバンドのみを表示し、4時間足のボリンジャーバンドを表示させない、など。
サンプルチャート
日足
日足では日足ボリンジャーバンドしか表示されない設定ですので、4時間足や1時間足の設定が邪魔になりません。
ここが他のボリンジャーバンドインジケーターと違う点です。
4時間足
4時間足に日足と4時間足のボリンジャーバンドを表示した状態です。不要な場面では両方もしくはいずれか一方を非表示にすることができます。
1時間足
1時間足に日足と4時間足と1時間足のボリンジャーバンドを表示した状態です。
5分足
5分足に全てのボリンジャーバンドを表示したチャートです。
短期トレードで上位足ボリンジャーバンドによる反発を狙う時などに活用できるのではないでしょうか。
インジケーターの使用について
当インジケーターは招待制インジケーター(有料)となっています。
使用を希望される方はプライベートチャットや下記リンクのDMでご連絡ください。
このページのコメント欄はインジケーターそのものに対するコメントやアップデートの記載のためのものとなっております。Tradingviewのハウスルールを守るためにもコメント欄からの連絡はご遠慮ください。
[NLX-L2] Oscillator Divergences MTF- Oscillator Divergences -
This indicator give you signals on various oscillator divergences (Regular/Hidden Bull/Bear) you can choose from:
CCI
Donchian
Fisher Transform
MACD
MFI
Momentum
OBV
QQE
RSI
RSX
TSI
- How to Use -
1. Add a Trend Indicator like Trend Index MTF to your chart
2. Add this Oscillator Divergences Indicator to your Chart and select the Trend Index MTF with Type L1 in the Settings as Signal Source
3. Add the Backtest Module to your Chart and select the Signal with Type L2 as Source
The Hurst Exponent Signal Filter can be used as well to filter some of the noise (release coming soon)!
- Alerts for Automated Trading -
See my signature below. Contact me for the Alert module.

Weis Wave No Security MTFearly i put example for source MTF with no security
you can find it here with all detail about it
this is just example that i try to use this code for weis volume invented by Lazy bear
you can play with different option of this MTF model
I use the TF1 of TF3 to increase time by minute
and i keep the other res as the same as the candle time
ytou can try different combination
this is just for folks to see how to implent it
you can play with timer in code sometime it change the out come
in future i hope we find better solution for security until then we cannot stoip dreaming:)
I want yo thank Duyc and quansium for their code for this implentation in tyhe weis volume model

Fibonacci MTFi just made Fibonacci which you can change MTF
Defalt is Daily but you can choose other time, the Fibonacci for the previous time period will be displayed.
I hope that it will be help someoen :)
MTF付のフィボナッチを作ってみました。
ご意見等あればコメントください

ICHIMOKU MTF PROICHIMOKU KINKO HYO MTF PRO by Rohan
In the late 1930s, Goichi Hosoda, a Japanese journalist, known as Ichimoku Sanjin (“what a man in the mountain sees” in translation) created Ichimoku Kinko Hyo.
If we are to translate Ichimoku Kinko Hyo, we will get “a glance at an equilibrium chart”
It has 5 Components:
1. Kijun Sen (brown line): (Highest High + Lowest Low) / 2 over the past 26 periods.
2. Tenkan Sen (blue line): Tenkan-Sen (Conversion Line) = (Highest High + Lowest Low) / 2 over the past 9 periods.
3. Chikou Span (purple line): Present trading days closing price plotted 26 periods behind.
4. Senkou SpanA (green line): (Tenkan-Sen + Kijun-Sen) / 2, plotted 26 periods in the future.
5. Senkou SpanB (red line): (Highest High + Lowest Low) / 2 over the past 52 periods, but plotted 26 periods in the future
Why The Ichimoku Matters?
Ichimoku is an ideal visual representation of key data, based on the historical data of moving averages.
Ichimoku can be used in all time frames for any tradeable asset. Ichimoku can be used in both rising and falling markets
Trading Methods by the ICHIMOKU MTF PRO Indicator:
1. TK Crossover Candle Indicator
2. TK Crossover Lines
3. Chikou Line Display
4. Multiple Timeframes Ichimoku Support/Resistance Lines
5. Kijun Flat Line Display
How traders can ask you for access to your script:
Interested traders to send you a private message on TV to gain access
Terms and Conditions:
1. The Author/User is not responsible for anything or trades taken etc
2. Indicator is for educational purpose only

Wave Trend MTF웨이브트렌드의 멀티타임프레임 지표입니다.
더 큰 프레임에서의 움직임을 확인하여 낮은 프레임에서 대응이 가능해 집니다.
낮은 프레임에서 상하향 방향을 찾기 어려운 분들께서는 MTF기능으로 상위프레임의 움직임은 어떠한지 미리 파악하실 수 있습니다.
단순한 지표이므로 하나만 보는것이 아니라, 다른 지표들도 같이 참고하심이 좋습니다.
이 지표의 사용을 원하신다면 메세지나 댓글을 남겨주세요~!
Wave Trend is a multi-time frame indicator.
By checking the movement in a larger frame, you can respond in a lower frame.
For those who are unable to find the up-down direction in the low frame, the MTF function allows you to know in advance how the upper frame moves.
Since it is a simple indicator, it is good to refer to other indicators as well.
If you want to use this indicator, please leave a message or comment~!

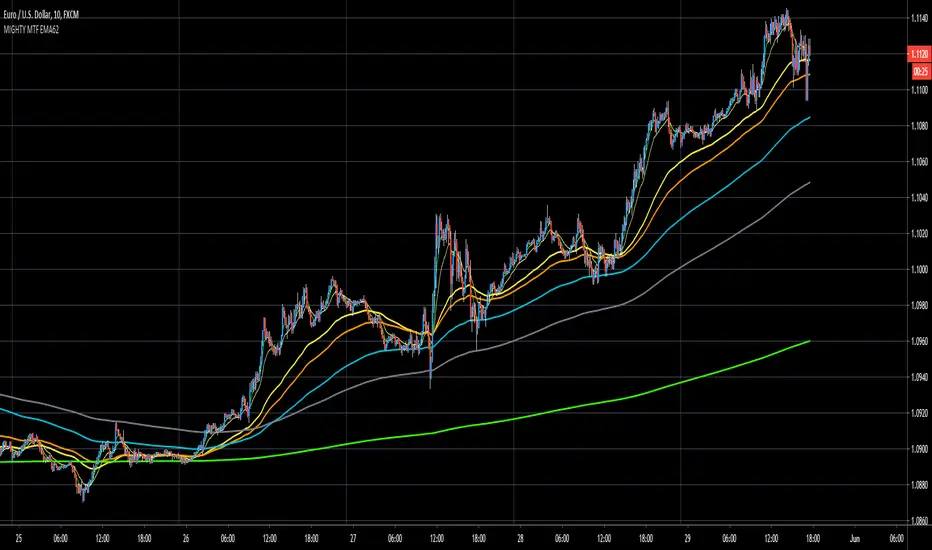
MIGHTY MTF EMA62EMA62 comes from Rob Booker trend trading system.
I do now own this, nor do I claim or charge money for this system.
More information about this system can be found on: www.robbooker.com
What I did:
1. hard coded all multi timeframe ema62.
2. using colorcoding for each timeframe:
EMA62 MTF (minutes)
1M = white
5M = purple
10M = yellow
15M = orange
30M = aqua
1H = gray
4H = green
8H = yellow
Daily = red
Note:
I've only tested this on Forex, I dont have experience with stocks-crypto.
Note:
This system is used to gauge Daily trend, intraday trend.
Strongly recommend to use it with other confirmation like support/resistance lines, trendlines, pitchforks, momentum oscillators.
Note:
Strongly recommend to read PDF if you want to trade this as stand alone.
Note:
Strongly recommend to use MTF analysis for better entries and understanding of higher timeframe trends.
Note:
When multiple ema62 are on top of eachother then we have no trend, suggesting consolidating market.
This occurs often at major support/resistance lines, Wedges, momentum oscillators OB/OS.
When multiple ema62 are opening up (upwards/downwards) then there's a suggestion of a trending market
TradeChartist MTF RSI Spotter™TradeChartist MTF RSI Spotter is an elegant Multi Timeframe RSI tool that helps spot price trends using visually engaging and appealing RSI plots and backgrounds compared to the basic RSI plot. Also the Bull and the Bear background fills + HTF RSI based background fills are highly useful for traders who like to visually understand areas of entry and exit based on RSI .
What does ™TradeChartist MTF RSI Spotter do?
Plots RSI with visually spottable colors for Bull and Bear zones (Green and Red) with optional background fill.
Plots RMA based on User specified length.
Plots user preferred HTF RSI on same chart as chart TF - HTF resolution from indicator settings drop-down must be used.
Fills Bull and Bear zone colors based on HTF based RSI movement.
Spots Regular RSI Bullish and Bearish Divergences.
Plots RSI color candles on main chart based on Upper and Lower RSI band.
Plots RSI based on RSI smoothing (1 for Regular RSI without smoothing) and Heikin Ashi RSI if opted from indicator settings.
This indicator works like a dream when used with other indicators for confirmation of Trends.
Note 1: Divergences don't work to trader's expectations all the time. It is a great indicator but has to be used with caution and entries must be confirmed using another indicator like Volume , Trend, fundamentals, market sentiment etc. They can't be used on their own to decide entry and exit.
Note 2: Bull and Bear RMA with chart TF RSI should be used for confirmation and not as a standalone indicator for entry and exit.
Example charts
Premium Scripts - Trial access and Information
Trial access offered on all Premium scripts.
PM me directly to request trial access to the scripts or for more information.

Ichimoku MTFIchimoku MTF
This is two time frame indicator: Live and second as a default multi time frame for 1h
MTF Affected:
Kumo
Tenkan Sen
Kijun Sen
Chikou Span
Good Luck

[fikira] MTF MA/EMA'sHere is my take on MA/EMA's and MTF, based on the most excellent work of
"PineCoders" (MTF Selection Framework functions)!
The big advantage is that on 1 image you can easily see where
price is compared to different MA/EMA's (each of different Time Frames).
This gives a lot of Support and Resistance area's!
Includes:
- MA/EMA 20
- MA/EMA 50
- MA/EMA 100
- MA/EMA 200
The present Time Frame MA/EMA has a coloured circle at the side.
Each can be altered in length (the length is visible at the side and changed with the settings)
Each has an extra 4 different Time Frames (multiple settings possible)
Crossover and crossunder MA/EMA 50 with 100 (Silver Cross) and 200 (Golden Cross) is included.
The present Time Frame Cross has a "o" above the Cross
Time Frame 1 Cross has a "1" above the Cross
Time Frame 1 Cross has a "2" above the Cross
Time Frame 1 Cross has a "3" above the Cross
Time Frame 1 Cross has a "4" above the Cross

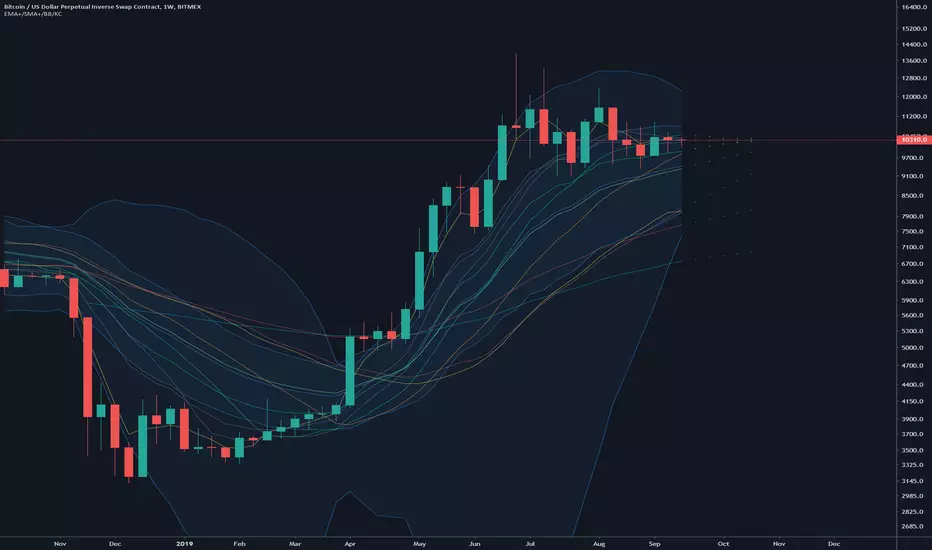
[fikira] Bollinger Bands + Higher Time FramesHere is my take on BB and MTF, based on the most excellent work of
"PineCoders" (MTF Selection Framework functions)!
The big advantage is that on 1 image you can easily see where
price is compared to 5 or less BB Bands (each of different Time Frames).
This gives a lot of Support and Resistance area's!
Includes:
- 1 Bollinger Bands (can be enabled/disabled - "Bollinger Bands"
- 4 Bollinger Bands (each can be enabled/disabled - "HTF Selection 1-4")
Each BB has its colour (can be changed)
- Labels (Timeframe and price) can be enabled/disabled
- Labels position and size can be changed
...

[SignalFI] H0dl2100K HA Trailer [V1]Welcome! It's my pleasure to bring a fully customized indicator based on @h0dl2100K's HA candle trading system. Through concerted efforts to bring automated trading systems from some of the best technical traders around, SignalFI provides the following features that were approved by @h0dl2100K:
Background
This system is based on the popular HA candle system and using several key levels and indicators of price action that can help identify entry, exit, and trailing stop levels for trading any asset (crypto, stocks, etc). The system is built to be used with HA candles, and provides the following key abilities:
1) HA Candle Doji Detector - HA candles are notorious for their ability to identify trend direction and changes in momentum. One of the easiest ways to identify these trend changes is when HA candles print "Doji candles" or candles that have long wicks on either side of the candle body. This signifies indecision in the market, and after a sustained up or down trend, usually marks a reversal in momentum. The Doji Detector will print label tags identifying potential bull or bear doji's which can be used as entry and exit signals or for identifying confluence with other indicators.
2) MTF Trail Lines - Using previous close levels for higher time frame candles is a cornerstone of trading fundamentals. Levels from the daily timeframe are respected on lower timeframes and can provide key levels to watch for entry or exit conditions to be "just right." The Trail lines are enabled by default and provide static levels on the chart in accordance with the following timeframes (4H, 12H, 1D, 3D, 1W). Both HIGH and LOW values for each timeframe are provided on the chart for easy of determining trailing stop levels or Take Profit levels depending on your trading system and confluence with other indicators.
3) EMA 50/200 - We've also included the notorious EMA trend lines that govern market sentiment from both short- and long-term investors (50 EMA, 200 EMA). These lines change color based on the price being above or below these levels and the levels can be fine-tuned within the settings to your EMA levels of choice.
4) MACD Crosses - We've also included signal tags where default MACD crosses occur to ensure that the trend direction is always presented on one graph. MACD crosses represent a significant sentiment score for trading all assets, and taken with the EMA trend, the HA candle trend, and the MTF Trail Levels can give a very consistent view of where price may be heading.
5) Alerts – It wouldn’t be a system unless we provided alerts to use for ease of notification of the data coming out of the script. For that reason, we have built-in alerts for both the MACD crosses and the Doji Detector. In addition, each Trail level be selected and alerted on to receive updates of when these key levels are crossed above or crossed below.
The H0dl2100K system is the result of years of market analysis and is mean to be a tool for guiding trading decisions in unison with or independently of other indicators. It works remarkably well with IchiEMA, AO and RSI PRIME as they all provide confluence to trading decisions, especially when using HA candles.
SignalFI was created to help traders and investors to effectively analyze the market based on the Golden Mean Ratio (Fibonacci numbers), plan a trade and ultimately execute it. To help inform and educate market decisions we developed a set of Trading Indicators which are available on TradingView.
SignalFI indicators are just that, indicators. Our indicators are generally configured to use completely historical data (negating repaint), and we advise all alerts created with SignalFI indicators to be fired upon "close" of the current candle. Our indicators can provide valuable context and visualization support when performing market analysis and executing buy and sell decisions. However. we are not financial experts, and all information presented on this site or our other media outlets are for educational purposes only.

RSI + EMA+ MTF Stop-LossThis is a simple RSI with multiple MTF (No security) to help with direction short and long-term.
The rsi for the current chart has a noise reduction, while the rest are based on ma's.
I have supplied an extra flexible mtf rsi ma for potential adjustable/long-term stop-loss or direction identification.
Enjoy

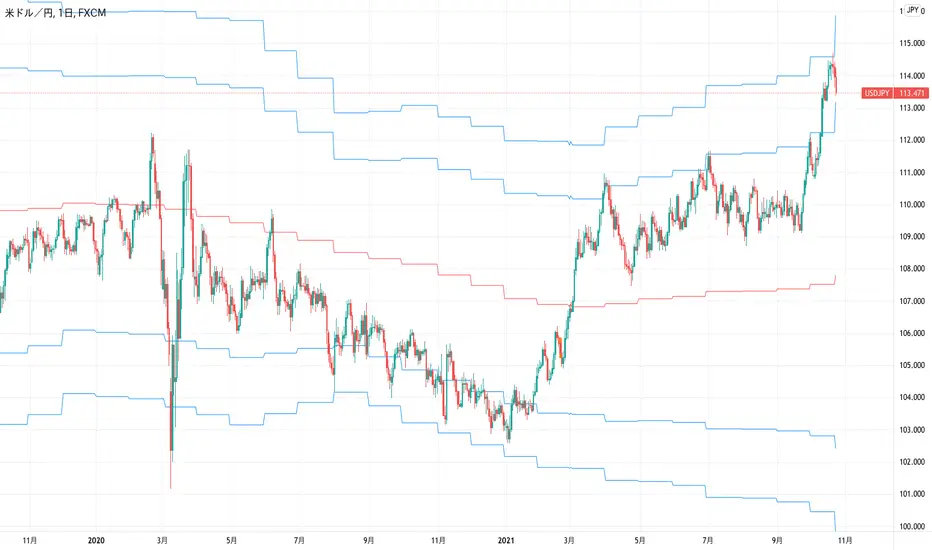
Bollinger MTFSo this is a Bollinger resistance and support map, I just convert it to v4 and add info for current upper and lower levels
The length is 60 (instead of regular 20) and we make it to be MTF
Ok , so how this system work
we choose TF and I normaly use 3x or 4X of the MTF (you can choose your own)
then we need to decide if we want to long or short
if we go long then the buy point will be the lower value and TP will be TP in green -
If we go short then our entry value will be upper and TP (take profit) will be in red
so one can put few tweeks and make this system to be more automatic , but I just show this as a easy concept for trade system
the main issue in such system is properly to decide when to go short or when to go long
that why you need to add other indicators in order to make this call and make this system effective

EMA/SMA Forecast MTF with BB and KC5 x EMA with future forecast values (5 periods)
4 x SMA with future forecast values (5 periods)
2 x MTF EMA
2 x MTF SMA
Bollinger Bands
Keltner Channels
Enjoy!
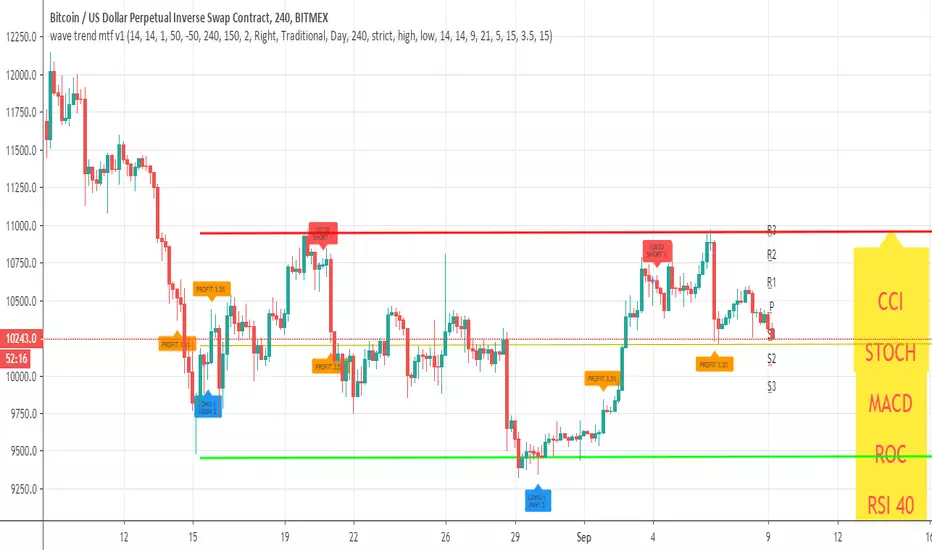
wave trend mtf v1This Lazy Bear wave trend in MTF version with take profit and stop loss rebuy
you can change the MTF using the security call
and many nice option to see insid3e
so you can play with it, modify it or make it better
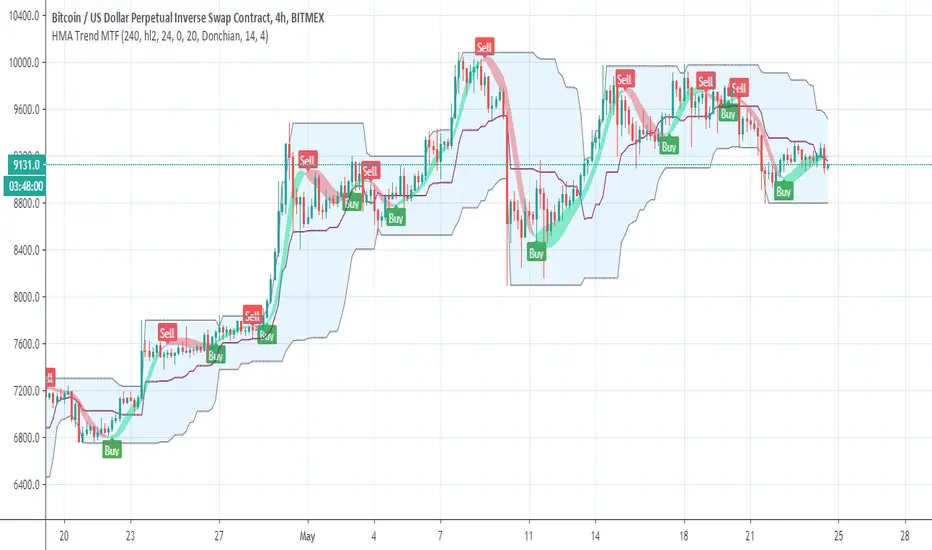
Hull Trend MTFhull trend taken from
So add MTF function and alert for the buy and sell (in the MTF shift set to 0 , if repaint then set shift to 1)
the blue line is linear regression trend
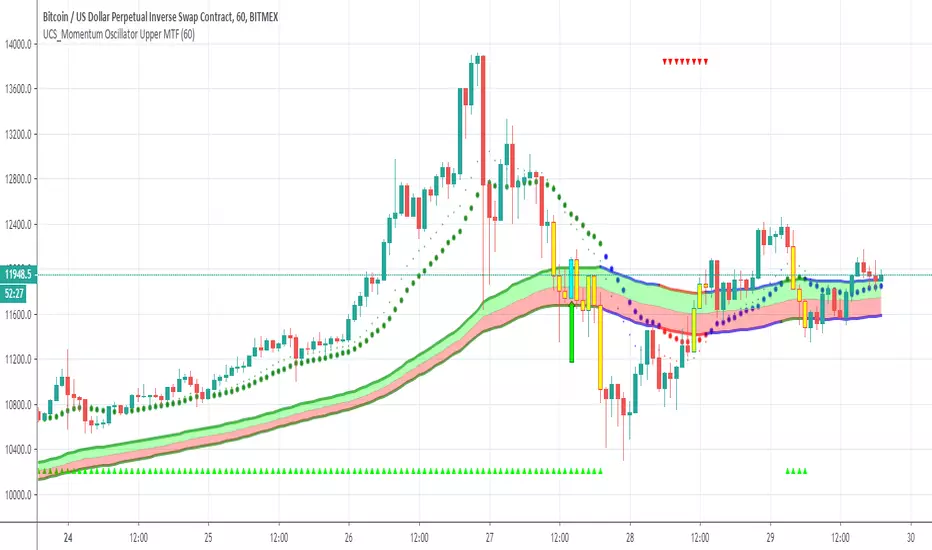
UCS_Momentum Oscillator Upper MTFby request of a freind I just made him this famous oscilator of chris mody in MTF format
so it a sling shot and MTF
HullDEMA MTFThis indicator based on non repaint HULL 720 min and dema MTF
i suugest to keep the Dema MTF on the time frame of your graph
using the HULL 720 min we can see how the signal of DEMA and the crossing of the hull 720 either by DEMA or by the candels
this enable us to detect trends more easy

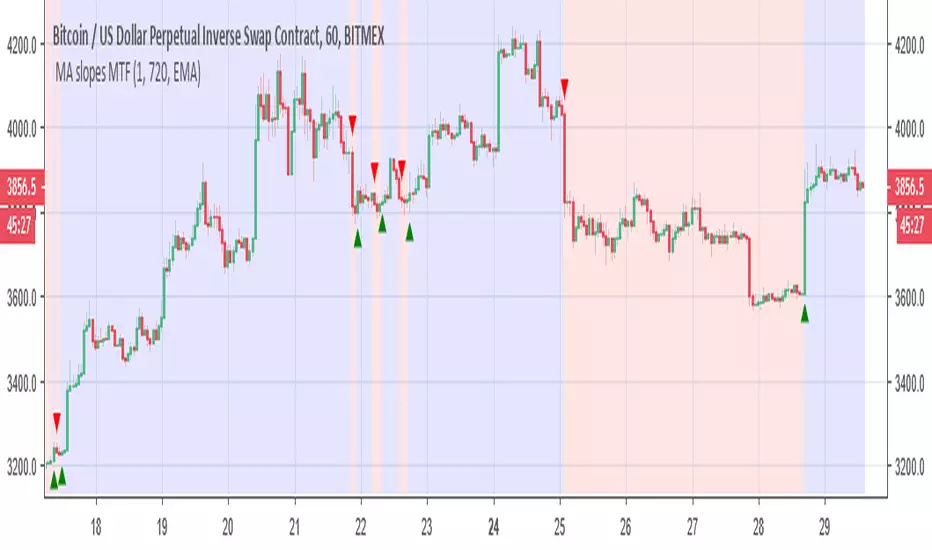
MA slopes MTF this is the original script. its nice as I love slopes of different MA
add MTF +colors of bullish and bearish
add alerts and signals
This can be a very good base indicator if one want to add extra things to it to make it better
or can used as a good filter
here on 15 min 1000min MTF
VPT and Heiken Ashi Candles MTFThe volume price trend indicator is used to determine the balance between a security’s demand and supply. The percentage change in the share price trend shows the relative supply or demand of a particular security, while volume indicates the force behind the trend. The VPT indicator is similar to the on-balance volume (OBV) indicator in that it measures cumulative volume and provides traders with information about a security’s money flow
So we put the VPT and add HA candles with non repainting MTF , the crossing up or down of the VPT over candles create the signals
since VPT tend to overshoot you can smooth it with Leni..(just give the smoothing of the length this stupid name:) )
alerts inside
just example of play with MTF and the smooth of VPT