[PW]D/W/M/Y pivots with S/R levelsI could not find a pivots script that was entirely to my liking on TV so I re-worked this from the ' Shifted Pivots V1' script by RicardoSantos.
You can choose which timeframe pivots you would like to display from day, week, month, and year.
You can also choose how many levels of S/R you would like to show.
在脚本中搜索"pivot"

GRG/RGR Signal, MA, Ranges and PivotsThis indicator is a combination of several indicators.
It is a combination of two of my indicators which I solely use for trading
1. EMA 10-20-50-200, Pivots and Previous Day/Week/Month range
2. 3/4-Bar GRG / RGR Pattern (Conditional 4th Candle)
You can use them individually if you already have some of them or just use this one. Belive me when I say, this is all you need, along with market structure knowlege and even if you don’t have that, this indicator has been doing wonders for me. This is all I use. I do not use anything else.
**Note - Do checkout the indicators individually as I have added valuable information in the comment section.
It contains the following,
1. 10 EMA/SMA - configurable
2. 20 EMA/SMA - configurable
3. 50 EMA/SMA - configurable
4. 200 EMA/SMA - configurable
5. Previous Day's Range - configurable
6. Previous Week's Range - configurable
7. Previous Month's Range - configurable
8. Pivots - configurable
9. Buy Sell Signal - configurable
The Moving Averages
It is a very important combination and using it correctly with price action will strengthen your entries and exits.
The ema's or sma's added are the most powerful ones and they do definitely act as support and resistance.
The Daily/Weekly/Monthly Ranges
The Daily/Weekly/Monthly ranges are extremely important for any trader and should be used for targets and reversals.
Pivots
Pivots can provide support and resistance level. R5 and S5 can be used to check for over stretched conditions. You can customise them however you like. It is a full pivot indicator.
It is defaulted to show R5 and S5 only to reduce noise in the chart but it can be customised.
The 3/4 RGR or GRG Signal Generator
Combined with a 3/4 RGR or GRG setup can be all a trader needs.
You don't need complex strategies and SMC concepts to trade. Simple EMAs, ranges and RGR/GRG setup is the most winning combination.
This indicator can be used to identify the Green-Red-Green or Red-Green-Red pattern.
It is a price action indicator where a price action which identifies the defeat of buyers and sellers.
If the buyers comprehensively defeat the sellers then the price moves up and if the sellers defeat the buyers then the price moves down.
In my trading experience this is what defines the price movement.
It is a 3 or 4 candle pattern, beyond that i.e, 5 or more candles could mean a very sideways market and unnecessary signal generation.
How does it work?
Upside/Green signal
1. Say candle 1 is Green, which means buyers stepped in, then candle 2 is Red or a Doji, that means sellers brought the price down. Then if candle 3 is forming to be Green and breaks the closing of the 1st candle and opening of the 2nd candle, then a green arrow will appear and that is the place where you want to take your trade.
2. Here the buyers defeated the sellers.
3. Sometimes candle 3 falls short but candle 4 breaks candle 1's closing and candle 2's opening price. We can enter on candle 4.
4. Important - We need to enter the trade as soon as the price moves above the candle 1 and 2's body and should not wait for the 3rd or 4th candle to close. Ignore wicks.
5. But for a more optimised entry I have added an option to use candle’s highs and lows instead of open and close. This reduces lot of noise and provides us with more precise entry. This setting is turned on by default.
6. I have restricted it to 4 candles and that is all that is needed. More than that is a longer sideways market.
7. I call it the +-+ or GRG pattern or Green-Red-Green or Buyer-Seller-Buyer or Seller defeated or just Buyer pattern.
8. Stop loss can be candle 2's mid for safe traders (that includes me) or candle 2's body low for risky traders.
9. Back testing suggests that body low will be useless and result in more points in loss because for the bigger move this point will not be touched, so why not get out faster.
Downside/Red signal
1. Say candle 1 is Red, which means sellers stepped in, then candle 2 is Green or a Doji, that means buyers took the price up. Then if candle 3 is forming to be Red and breaks the closing of the 1st candle and opening of the 2nd candle then a Red arrow will appear and that is the place where you want to take your trade.
2. Sometimes candle 3 falls short but candle 4 breaks candle 1's closing and candle 2's opening price. We can enter on candle 4.
3. We need to enter the trade as soon as the price moves below the candle 1 and 2's body and should not wait for the 3rd or 4th candle to close.
4. But for a more optimised entry I have added an option to use candle’s highs and lows instead of open and close. This reduces lot of noise and provides us with more precise entry. This setting is turned on by default.
5. I have restricted it to 4 candles and that is all that is needed. More than that is a longer sideways market.
6. I call it the -+- or RGR pattern or Red-Green-Red or Seller-Buyer-Seller or Buyer defeated or just Seller pattern.
7. Stop loss can be candle 2's mid for safe traders ( that includes me) or candle 2's body high for risky traders.
8. Back testing suggests that body high will be useless and result in more points in loss because for the bigger move this point will not be touched, so why not get out faster.
Combining Indicators and Signal
Combining these indicators with GRG/RGR signal can be very powerful and can provide big moves.
1. MA crossover and Signal - This is very powerful and provides a very big move. Trades can be held for longer. If after taking the trade we notice that the MA crossover has happened then trades can be held for higher targets.
2. Pivots and Signal - Pivots and add a support or resistance point. Take profits on these points. R5/S5 are over streched conditions so we can start looking for reversal signals and ignore other signals
3. Intraday Range - first 1, 5, 15 min of the day - Sideways days is when price will stay in these ranges. You can take profits at these ranges or if the range is broken and we get a signal, then it can mean that the direction will be sustained.
4. Previous Day/Week/Month Ranges - These can be used as Take Profit points if the price is moving towards them after getting the signal. If the range is broken and we get a signal then it can be a strong signal. They can also be used as reversal points if a strong signal is generated.
Important Settings
1. Include 4th Candle Confirmation - You can enable or disable the 4th candle signal to avoid the noise, but at times I have noticed that the 4th candle gives a very strong signal or I can say that the strong signal falls on the 4th candle. This is mostly a coincidence.
2. Bars to check (default 10) - You can also configure how many previous bars should the signal be generated for. 10 to 30 is good enough. To backtest increase it to 2000 or 5000 for example.
3. Use Candle High/Low for confirmation instead of Candle Open/Close - More optimized entry and noise reduction. This option is now defaulted to false.
4. Show Green-Red-Green (bull) signals - Show only bull entries. Useful when I have a predefined view i.e, I know market is going to go up today.
5. Show Red-Green-Red (bear) signals - Show only bear entries. Useful when I have a predefined view i.e, I know market is going to go down today.
6. 3rd candle should be a Strong candle before considering 4th candle - This will enforce additional logic in 4 candle setup that the 3rd candle is the candle in our direction of breakout. This means something like GRGG is mandatory, which is still the default behaviour. If disabled, the 3rd candle can be any candle and 4th candle will act as our breakout candle. This behaviour has led to breakouts and breakdowns as times, hence I added this as a separate feature. Vice-versa for a RGGR.
For a 4 candle setup till now we were expecting GRGG or RGRR but we can let the system ignore the 3rd candle completely if needed.
This will result in additional signals.
7. Three intraday ranges added for index and stock traders - 1 min, 5 min and 15 min ranges will be displayed. These are disabled by default except 15 min. These are very important ranges and in sideways days the price will usually move within the 15 min. A breakout of this range and a positive signal can be a very powerful setup.
Safe traders can avoid taking a trade in this range as it can lead to fakeouts.
The line style, width, color and opacity are configurable.
Pointers/Golden Rules
1. If after taking the trade, the next candle moves in your direction and closes strong bullish or bearish, then move SL to break even and after that you can trail it.
2. If a upside trade hits SL and immediately a down side trade signal is generated on the next candle then take it. Vice versa is true.
3. Trades need to be taken on previous 2 candle's body high or low combined and not the wicks.
4. The most losses a trader takes is on a sideways day and because in our strategy the stop loss is so small that even on a sideways day we'll get out with a little profit or worst break even.
5. Hold trades for longer targets and don't panic.
6. If last 3-4 days have been sideways then there is a good probability that today will be trending so we can hold our trade for longer targets. Inverse is true when the market has been trending for 2-3 days then volatility followed by sideways is coming (DOW theory). Target to hold the trade for whole day and not exit till the day closes.
7. In general avoid trading in the middle of the day for index and stocks. Divide the day into 3 parts and avoid the middle.
8. Use Support/Resistance, 10, 20, 50, 200 EMA/SMA, Gaps, Whole/Round numbers(very imp) for identifying targets.
9. Trail your SL.
10. For indexes I would use 5 min and 15 min timeframe and at times 10 mins.
11. For commodities and crypto we can use higher timeframe as well. Look for signals during volatile time durations and avoid trading the whole day. Signal usually gives good targets on those times.
12. If a GRG or RGR pattern appears on a daily timeframe then this is our time to go big.
13. Minimum Risk to Reward should be 1:2 and for longer targets can be 1:4 to 1:10.
14. Trade with small lot size. Money management will happen automatically.
15. With small lot size and correct Risk-Reward we can be very profitable. Don't trade with big lot size.
16. Stay in the market for longer and collect points not money.
17. Very imp - Watch market and learn to generate a market view.
18. Very imp - Only 3 type of candles are needed in trading -
Strong Bullish (Big Green candle), Strong Bearish (Big Red candle),
Hammer (it is Strong Bullish), Inverse Hammer (it is Strong Bearish)
and Doji (indecision or confusion).
If on daily timeframe I see Strong Bullish candle previous day then I am biased to the upside the next day, if I see Strong Bearish candle the previous day then I am biased to the downside the next day, if I see Doji on the previous day then I am cautious the next day, if there are back to back Dojis forming in daily or weekly then I am preparing for big move so time to go big once I get the signal.
19. Most Important Candlestick pattern - Bullish and Bearish Engulfing
20. The only Chart patterns I need -
a) Falling Wedge/Channel Bullish Pattern Uptrend or Bull Flag - Buying - Forming over a couple days for intraday and forming over a couple of weeks for swing
b) Falling Wedge/Channel Bullish Pattern Downtrend or Falling Channel - Buying
c) Rising Wedge Bearish Pattern Uptrend or Rising Channel - Selling
d) Rising Wedge Bearish Pattern Downtrend or Bear flag - Selling
e) Head and Shoulder - Over a longer period not for intraday. In 15 min takes few days and for swing 1hr or 4h or daily can take few days
f) M and W pattern - Reversal Patterns - They form within the above 4 patterns, usually resulting in the break of trend line
21. How Gaps work -
a) Small Gap up in Uptrend - Market can fill the gap and reverse. The perception is that people are buying. If previous day candle was Strong Bullish then market view is up.
b) Big Gap up in Uptrend - Not news driven - Profit booking will come but may not fill the entire gap
c) Big Gap up in Uptrend - News driven, war related, tax, interest rate - Market can keep going up without stopping.
c) Flat opening in Uptrend - Big chance of market going up. If previous day candle was Strong Bullish then view is upwards, if it was Doji then still upwards.
d) Gap down in Uptrend - Market is surprised. After going down initially it can go up
e) Small Gap down in Downtrend - Market can fill the gap and keep moving down. If previous day candle was Strong Bearish then view is still down.
f) Flat opening in Downtrend - View is down, short today.
g) Big Gap down in Downtrend - Profit booking and foolish buying will come but market view is still down.
h) Gap down with News - Volatility, sideways then down.
i) Gap Up in Downtrend - Can move up - Price can move up during 2/3rd of the day and End of the day revert and close in red.
22. Go big on bearish days for option traders. Puts are better bought and Calls are better sold.
23. Cluster of green signals can lead to bigger move on the upside and vice versa for red signals.
24. Most of this is what I learned from successful traders (from the top 2%) only the indicator is mine.

Hourly Strong Pivot Rays with ClustersHourly pivots with areas of confluence clusters. Works best with strong stocks and indexes.

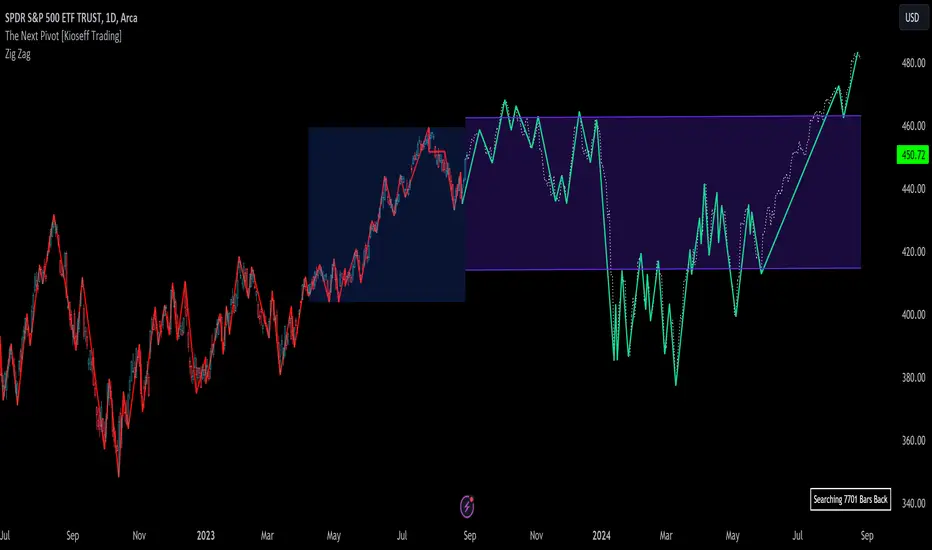
The Next Pivot [Kioseff Trading]Hello!
This script "The Next Pivot" uses various similarity measures to compare historical price sequences to the current price sequence!
Features
Find the most similar price sequence up to 100 bars from the current bar
Forecast price path up to 250 bars
Forecast ZigZag up to 250 bars
Spearmen
Pearson
Absolute Difference
Cosine Similarity
Mean Squared Error
Kendall
Forecasted linear regression channel
The image above shows/explains some of the indicator's capabilities!
The image above highlights the projected zig zag (pivots) pattern!
Colors are customizable (:
Additionally, you can plot a forecasted LinReg channel.
Should load times permit it, the script can search all bar history for a correlating sequence. This won't always be possible, contingent on the forecast length, correlation length, and the number of bars on the chart.
Reasonable Assessment
The script uses various similarity measures to find the "most similar" price sequence to what's currently happening. Once found, the subsequent price move (to the most similar sequence) is recorded and projected forward.
So,
1: Script finds most similar price sequence
2: Script takes what happened after and projects forward
While this may be useful, the projection is simply the reaction to a possible one-off "similarity" to what's currently happening. Random fluctuations are likely and, if occurring, similarities between the current price sequence and the "most similar" sequence are plausibly coincidental.
That said, if you have any ideas on cool features to add please let me know!
Thank you (:
[Camarilla Pivots] Signal Clean Up Analysis with Backtest (TSO)Camarilla Pivots NEW GEN Indicator!
This is a full-cycle trading system indicator, which uses Camarilla Pivots for generating signals using a custom developed algorithm, TP (Take Profit) and SL (Stop Loss) levels. There are 3 SOURCES for signals (each can be used separately or in combination or all 3 can be used at the same time, each signal SOURCE is using Camarilla Pivots levels to open optimal trade direction) with chained (NOTE: There are many potential profitable setups available, by combining clean up features availabe in the indicator settings!) signal cleanup and analysis approach with scheduling and alerting capabilities. Works best with shorter timeframes: 1M, 5M, 15M, 1H.
NOTE: Every calculation is done on a confirmed closed candle bar state, so the indicator will never repaint!
NOTE: At position open - there will be calculated Take-Profit and Stop-Loss targets, however each target is considered hit, when candle bar closes breaking that target, so Take-Profit and Stop-Loss when hit will slightly differ then what you see at position open!
===========================================================================
Explanation of all the Features | Configuration Guide | Indicator Settings | Signal Cleanup Analysis
---------------------------------------------------------------------------
>>> Customizable Backtesting for a specific date range, results via TradingView strategy, which includes “Deep Backtesting” for largest amounts of data on trading results.
>>> Trading Schedule with customizable trading daily time range, automatic closing/alert trades before Power Hour or right before market closes or leave it open until next day.
>>> 3 Trading Systems.
>>> Multiple Signal SOURCEs for opening trades, either SOURCE can be used or both at the same time!
>>> Static/Dynamic Stop-Loss setups (HIGHLIGHT: Stop-Loss will be moved to Entry after TP1 is taken, which minimizes risk).
>>> Single or Multiple profit targets (up to 5).
>>> Take-Profit customizable offset feature (set your Take-Profit targets slightly before everyone is expecting it!).
>>> Candle bar signal analysis (matching candle color, skip opposite structured and/or doji candle uncertain signals).
>>> Additional analysis of VWAP/EMA/ATR/EWO (Elliot Wave Oscillator)/Divergence MACD+RSI/Volume signal confirmation (clean up your chart with indicator showing only the best potential signals!).
>>> Advanced Alerts setup, which can be potentially setup with a trading bot over TradingView Webhook (NOTE: This will require advanced programming knowledge).
===========================================================================
Labels, plots, colors explanations:
---------------------------------------------------------------------------
>>>>> LONG open: green "house" looking arrow below candle bar.
>>>>> SHORT open: red "house" looking arrow above candle bar.
>>>>> LONG/SHORT take-profit target: green/red circles (multi-profit > TP2/3/4/5 smaller circles).
>>>>> LONG/SHORT stop-loss target: green/red + crosses.
>>>>> LONG/SHORT take-profit hits: green/red diamonds.
>>>>> LONG/SHORT stop-loss hits: green/red X-crosses.
>>>>> LONG/SHORT EOD (End of Day | Intraday style) close (profitable trade): green/red squares.
>>>>> LONG/SHORT EOD (End of Day | Intraday style) close (loss trade): green/red PLUS(+)-crosses.
===========================================================================
Date Range and Trading Schedule Settings
---------------------------------------------------------------------------
>>>>> Date Range: Select your start and/or end dates (uncheck “End” for indicator to show results up to the very moment and to use for LIVE trading) for backtesting results, if not using backtesting – uncheck “Start”/“End” to turn it off.
>>>>> Use TradingView “Strategy Tester” to see backtesting results
NOTE: If Strategy Tester does not show any results with Date Ranged fully unchecked, there may be an issue where a script opens a trade, but there is not enough TradingView power to set the Take-Profit and Stop-Loss and somehow an open trade gets stuck and never closes, so there are “no trades present”. In such case you will need to manually check “Start”/“End” dates or use “Depp Backtesting” feature!
>>>>> Trading Schedule: This is where you can setup Intraday Session or any custom session schedule you wish. Turn it ON. Select trading hours. Select EOD (End of Day) setting (NOTE: If it will be OFF, the indicator will assume you are holding your position open until next day!). Please note the EOD trade closure times with the 2 different Intraday close settings when turned on:
At Market Close:
1/3/5min > will close at 15:55pm ET
15min > will close at 15:45pm ET
30min > will close at 15:30pm ET
45min > will close at 15:45pm ET
60min > will close at 15:00pm ET
Before Power Hour:
1/3/5min > will close at 15:00pm ET
15min > will close at 15:00pm ET
30min > will close at 15:00pm ET
45min > will close at 15:00pm ET
60min > will close at 15:00pm ET
>>> Trading Systems: 1) "Open Until Closed by TP or SL": the signal will only open a trade if no trades are currently open/trunning, a trade can only be closed by Take Profit, Stop Loss or End of Day close (if turned on) | 2) "Open Until Closed by TP or SL + OCA": Same as 1), but if there is an opposite signal to the trade which is currently open > it will immediately be closed with new trade open or End of Day close (if turned on) | 3) "OCA (no TP or SL)": There are is Take Profit or Stop Loss, only an opposite signal will close current trade and open an opposite one or End of Day close (if turned on).
>>> Position Open sources:
>>>>> Position Open - SOURCE1 | LONG: S3, SL: S4, TP1: R3, TP2: R4, TP3: R5, TP4/5: Smart Formula | SHORT: R3, SL: R4, TP1: S3, TP2: S4, TP3: S5, TP4/5: Smart Formula
>>>>> Position Open - SOURCE2 | LONG: R4, SL: R3, TP1: R5, TP2/3/4/5: Smart Formula | SHORT: S4, SL: S3, TP1: S5, TP2/3/4/5: Smart Formula
>>>>> Position Open - SOURCE3 | LONG: R5, SL: R4, TP1/2/3/4/5: Smart Formula | SHORT: S5, SL: S4, TP1/2/3/4/5: Smart Formula
>>> Turn On/Off: Current Position SL + Opposite Position Open Signal on the same closing candle bar (If current trade hits Stop-Loss and at that same closing candle bar there is a signal for an opposite direction trade > indicator will close current position as Stop-Loss and immediately open an opposite position). NOTE: With this option turned on, there will be more trades, but not necessarily better results, since after Stop-Loss is hit, it may make sense to wait a little before opening an opposite trade, even if it matches the condition at the same time when Stop-Loss is hit, but sometimes it shows great results, so this setting/feature is included.
>>> Turn On/Off: Turn On/Off: Current Position REGULAR SL | Only the SL + Opposite Position Open will trigger if turned on, IF NOT - THERE WILL BE NO STOP-LOSS AT ALL!!! NOTE: It is very dangerous to trade without Stop-Loss!
>>>>> Signal Candle Bar consuming Take-Profits - position/trade signal candle bar is big enought to "consume"/close ahead the first TP setting > the signal can either be skipped, or all Take-Profit areas pushed ahead using smart formula)
>>>>> MULTIPROFIT | TP (Take-Profit) System: Once the trade is open, all Take-Profit target(s) are immediately calculated and set for the trade > once the target(s) is hit > trade will be partially closed (if candle bar closes beyond several Take-Profit targets > trade will be reduced accordingly to the amount of how many Take-Profit targets were hit)
>>>>> MULTIPROFIT | SL (Stop-Loss) System: 1) Static – Once the trade is open, Stop-Loss is calculated and set for the remaining of the trade ||| 2) Dynamic – At trade open, Stop-Loss is calculated and set the same way, however once 1st Take-Profit is taken > Stop-Loss is moved to Entry, reducing the risk.
>>>>> # of TPs (number of take profit targets): Just like it is named, this is where you select the number of Take-Profit targets for your trading system (NOTE: If "OCA (no TP or SL)" Trading System is selected, this setting won’t do anything, since there are no TP or SLs for that system).
>>>>> TP(s) offset: This is a special feature for all Take-Profit targets, where you can turn on a customizable offset, so that if the price is almost hitting the Take-Profit target, but never actually touches it > you will capture it. This is good to use with HHLL (Highest High Lowest Low), which is pretty much a Support/Resistance as often the price will nearly touch these strong areas and turn around…
===========================================================================
Signal Analysis and Cleanup Settings
---------------------------------------------------------------------------
>>>>> Candle Analysis | Candle Color signal confirmation: If closed candle bar color does not match the signal direction > no trade will be open.
>>>>> Candle Analysis | Skip opposite candle signals: If closed candle bar color will match the signal direction, but candle structure will be opposite (for example: bearish green hammer, long high stick on top of a small green square) > no trade will be open.
>>>>> Candle Analysis | Skip doji candle signals: If closed candle bar will be the uncertain doji > no trade will be open.
>>>>> Divergence/Oscillator Analysis | EWO (Elliot Wave Oscillator) signal confirmation: LONG will only be open if at signal, EWO is green or will be at bullish slope (you can select which setting you desire), SHORT if EWO is red or will be at bearish slope.
>>>>> Divergence/Oscillator Analysis | VWAP signal confirmation: LONG will only be open if at signal, the price will be above VWAP, SHORT if below.
>>>>> Divergence/Oscillator Analysis | Moving Average signal confirmation: LONG will only be open if at signal, the price will be above selected Moving Average, SHORT if below.
>>>>> Divergence/Oscillator Analysis | ATR signal confirmation: LONG will only be open if at signal, the price will be above ATR, SHORT if below.
>>>>> Divergence/Oscillator Analysis | RSI + MACD signal confirmation: LONG will only be open if at signal, RSI + MACD will be bullish, SHORT if RSI + MACD will be bearish.
>>>>> Volume signal confirmation: LONG/SHORT will only be opened with strong Volume matching the signal direction, by default, strong Volume percentage is set to 150% and weak to 50%, but you can change it as you desire.
===========================================================================
||||||||||||||||||||||||||||||||||| *** ||||||||||||||||||||||||||||||||||| *** |||||||||||||||||||||||||||||||||||
||||||||||||||||||||||||||||||||||| *** ||||||||||||||||||||||||||||||||||| *** |||||||||||||||||||||||||||||||||||
TP System - VERY IMPORTANT INFO!
-------------------------------------------------------------------------------------------------------------------
"TP PERCENTAGE" - amount by which current trade/position needs to be reduced/partially closed/sold.
-------------------------------------------------------------------------------------------------------------------
TP System: Dynamic
"TP PERCENTAGE" - will always be the same amount (trade/position size divided by the # of take-profit(TP) targets) and percentage to be closed will always be of the ORIGINAL trade/position.
-------------------------------------------------------------------------------------------------------------------
TP System: Static
"TP PERCENTAGE" - will always be the same amount IF take-profit(TP) targets are hit 1-by-1 (TP1 > TP2 > TP3 > TP4 > TP5), otherwise it will vary and unless it is a 1st take-profit(TP1), the REMAINING trade/position size will always be smaller than original and therefore the percentage to be closed will always be of the REMAINING trade/position and NOT the original one!
-------------------------------------------------------------------------------------------------------------------
"TP PERCENTAGE" CheatSheet (these are the only percentages you may see)
-----------------------------------------------------------------------
TP PERCENTAGE---Close/Sell Amount-------------Example (trade size: 50 stocks)
20%-------------trade size * 0.2--------------50 * 0.2 = 10 stocks
25%-------------trade size * 0.25-------------50 * 0.25 = 12.5(~13) stocks
34%-------------trade size * 0.34-------------50 * 0.34 = 17 stocks
40%-------------trade size * 0.4--------------50 * 0.4 = 20 stocks
50%-------------trade size * 0.5--------------50 * 0.5 = 25 stocks
60%-------------trade size * 0.6--------------50 * 0.6 = 30 stocks
66%-------------trade size * 0.66-------------50 * 0.66 = 33 stocks
75%-------------trade size * 0.75-------------50 * 0.75 = 37.5(~38) stocks
80%-------------trade size * 0.8--------------50 * 0.8 = 40 stocks
100%------------trade size--------------------50 = 50 stocks
-----------------------------------------------------------------------
If for any reason a portion of the current/remaining trade closed at such occurrence was slightly wrong, it is not an issue. Such occurrences are rare and with slight difference in partial TP closed is not significant to overall performance of our algorithms.
||||||||||||||||||||||||||||||||||| *** ||||||||||||||||||||||||||||||||||| *** |||||||||||||||||||||||||||||||||||
||||||||||||||||||||||||||||||||||| *** ||||||||||||||||||||||||||||||||||| *** |||||||||||||||||||||||||||||||||||
Alert Settings (you don’t have to touch this section unless you will be using TradingView alerts through a Webhook to use with trading bot)
---------------------------------------------------------------------------
Here is how a LONG OPEN alert looks like.
NOTE: Each label , , etc. is customizable, you can change the text of it within indicator Input settings.
ALERT >>>>>>>>>>>>>>>>>>>>>>>>>>>>>>>>>>>>>>>>>>>>>>>
COIN: BTCUSD
TIMEFRAME: 15M
LONG: OPEN
ENTRY: 20000
TP1: 20500
TP2: 21000
TP3: 21500
TP4: 22500
TP5: 23500
SL: 19000
Leverage: 0
---------------------------------------------------------------------------
Here is how a TP1 alert will look with 5 TPs breakdown of the trade.
NOTE1: Next to TP1 taken it will show at which price it was triggered.
NOTE2: Next to "TP Percentage" it shows how much of the CURRENT/ACTIVE/REMAINING trade needs to be closed.
NOTE2: If TP2/3/4/5 comes before TP1 - the alert will tell you exactly how many percent of the trade needs to be closed!
ALERT >>>>>>>>>>>>>>>>>>>>>>>>>>>>>>>>>>>>>>>>>>>>>>>
COIN: BTCUSD
TIMEFRAME: 15M
LONG: TP1
TP1: 20500
TP Percentage: 20%
---------------------------------------------------------------------------
Here is how an alert will look for LONG - STOP-LOSS.
ALERT >>>>>>>>>>>>>>>>>>>>>>>>>>>>>>>>>>>>>>>>>>>>>>>
COIN: BTCUSD
TIMEFRAME: 15M
ENTRY: 20000
LONG: SL
SL: 19000
---------------------------------------------------------------------------
Here is how an alert will look for LONG - EOD (End of Day) In Profit close.
ALERT >>>>>>>>>>>>>>>>>>>>>>>>>>>>>>>>>>>>>>>>>>>>>>>
COIN: BTCUSD
TIMEFRAME: 15M
LONG: EOD-Close (profit)
ENTRY: 20000
EOD-Close: 21900
===========================================================================
Adding Alerts in TradngView
---------------------------------------------------------------------------
-Add indicator to chart and make sure it is configured (check back-testing results)
-Right-click anywhere on the TradingView chart
-Click on Add alert
-Condition: Select this indicator by it’s name
-Alert name: Whatever you want
-Hit “Create”
-Note: If you change ANY Settings within the indicator – you must DELETE the current alert and create a new one per steps above, otherwise it will continue triggering alerts per old Settings!
===========================================================================
If you have any questions or issues with the indicator, please message me directly via TradingView.
---------------------------------------------------------------------------
Good Luck! (NOTE: Trading is very risky, past performance is not necessarily indicative of future results, so please trade responsibly!)
---------------------------------------------------------------------------
NOTE: There seems to be a strange glitch when strategy is running live, it will show "double-take" take-profits labels on the chart. This is not affecting the script logic and backtesting results, if you will remove/re-add the script afterwards, it will no longer show the duplicate orders... this must be some sort of a glitch as every alert was thoroughly tested to make sure everything is working!

Super PivotsThis is Super Pivots !!
This indicator can do the following:
Display Pivots for all time frames on the chart.
Display Pivots for shorter time frames (such as 1-hour timeframe).
Display Pivots for the market.

Relative Strength Index w/ STARC Bands and PivotsThis is an old script that I use with some useful RSI strategies from "Technical Analysis for the Trading Professional" 2nd edition by Constance Brown.
The base RSI comes with the option for custom length, and has some pre-configured ranges for looking at exits and entrances. The idea is to be bullish when bounces happen in the red zone during an already bullish trend or when the indicator enters green without a rejection. Be bearish if the indicator falls through the red zone or fails to enter green during an already bearish trend.
I have added the formulas used for creating STARC bands (just think fancier volatility bands) with adjustable tolerances. The idea is to look out for when the RSI touches one of the bands and reverses. This is usually indicative of a strong reversal (though the timing will be up to the trader). Best use this on shorter time frames during a volatile time of a stock's price action.
Although a little messy, there is a small segment of the script which includes pivot points. I like to use these because they make indicating local highs/lows for finding divergences easier.
Finally, I have added a couple of customizable EMAS for the RSI itself. Useful when combined with the other features!

HTF Candles & PivotsThis indicator displays HTF candles and pivot points.
The candles are displayed in a box and you can select Open-Close, High-Low or both.
You can show all of the past, or just "today only" or "previous day only".
You can also shift one previous candle to the current one.
The pivot point is the normal one.
There is an option to display CPR (Central pivot range).
Example: Shift previous to current

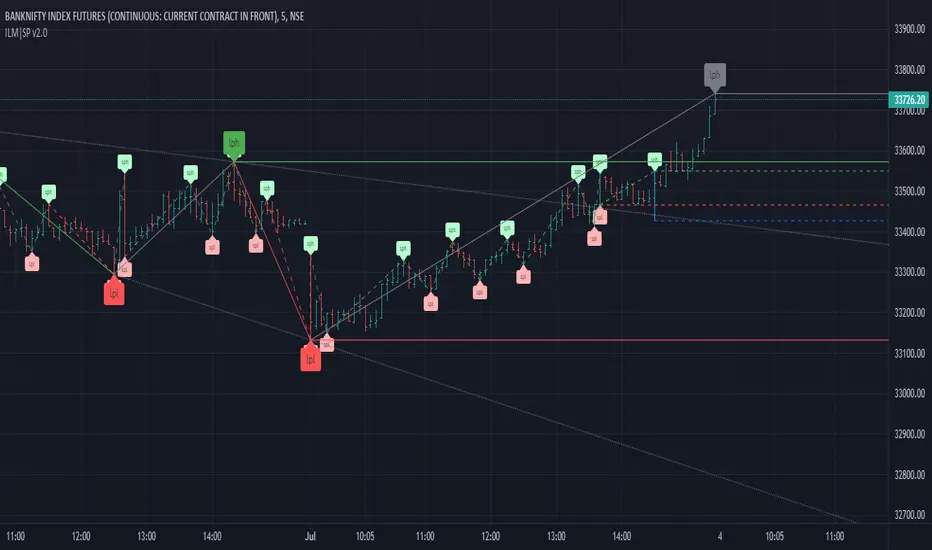
ILM | Structural Pivots v1This script will mark the structural pivots based on some rules.
Solid green/red lines are for major trend to mark LPH (Large Pivot High) and LPL (Large Pivot Low).
Dotted green/red lines are for minor trend SPH (Small Pivot High) and SPL (Small Pivot Low). SPH and SPL are not marked as labels to reduce congestion on the chart.
Gray lines are to identify temporary large pivots before they get promoted to LPH / LPL
Blue lines are to identify temporary small pivots before they get promoted to SPH / SPL
Couple of common trading strategies
- Go Long above LPH
- Go Short below LPL
- Go Long above SPH after LPH
- Go Short below SPL after LPL
Mean Reversion
- Go Long above SPH after LPL
- Go Short below SPL after LPH
This is the initial version and I am making it as public beta to iron out any issues. I might make this script private in future - FYI
Combo Backtest 123 Reversal & Floor Pivot Points This is combo strategies for get a cumulative signal.
First strategy
This System was created from the Book "How I Tripled My Money In The
Futures Market" by Ulf Jensen, Page 183. This is reverse type of strategies.
The strategy buys at market, if close price is higher than the previous close
during 2 days and the meaning of 9-days Stochastic Slow Oscillator is lower than 50.
The strategy sells at market, if close price is lower than the previous close price
during 2 days and the meaning of 9-days Stochastic Fast Oscillator is higher than 50.
Second strategy
The name ‘Floor-Trader Pivot,’ came from the fact that Pivot points can
be calculated quickly, on the fly using price data from the previous day
as an input. Although time-frames of less than a day can be used, Pivots are
commonly plotted on the Daily Chart; using price data from the previous day’s
trading activity.
WARNING:
- For purpose educate only
- This script to change bars colors.

Combo Strategy 123 Reversal & Floor Pivot Points This is combo strategies for get a cumulative signal.
First strategy
This System was created from the Book "How I Tripled My Money In The
Futures Market" by Ulf Jensen, Page 183. This is reverse type of strategies.
The strategy buys at market, if close price is higher than the previous close
during 2 days and the meaning of 9-days Stochastic Slow Oscillator is lower than 50.
The strategy sells at market, if close price is lower than the previous close price
during 2 days and the meaning of 9-days Stochastic Fast Oscillator is higher than 50.
Second strategy
The name ‘Floor-Trader Pivot,’ came from the fact that Pivot points can
be calculated quickly, on the fly using price data from the previous day
as an input. Although time-frames of less than a day can be used, Pivots are
commonly plotted on the Daily Chart; using price data from the previous day’s
trading activity.
WARNING:
- For purpose educate only
- This script to change bars colors.

Daily and Fibo Pivots© ForexPipCheats
This indicator is coded to run on Trading View which was originally created by traderathome (TAH), qFish, and all other respective contributors for the mt4 version.
Daily Support & Resistance Pivots
You can select to display the support and resistance pivot lines (SR) using either the Daily or Fibonacci formulas.
The Fibonacci displays five levels.
Normally, the Daily displays only three levels but is extended to include five levels.
Due to the short TF it displays, the indicator would only appear on TF 1H and below.

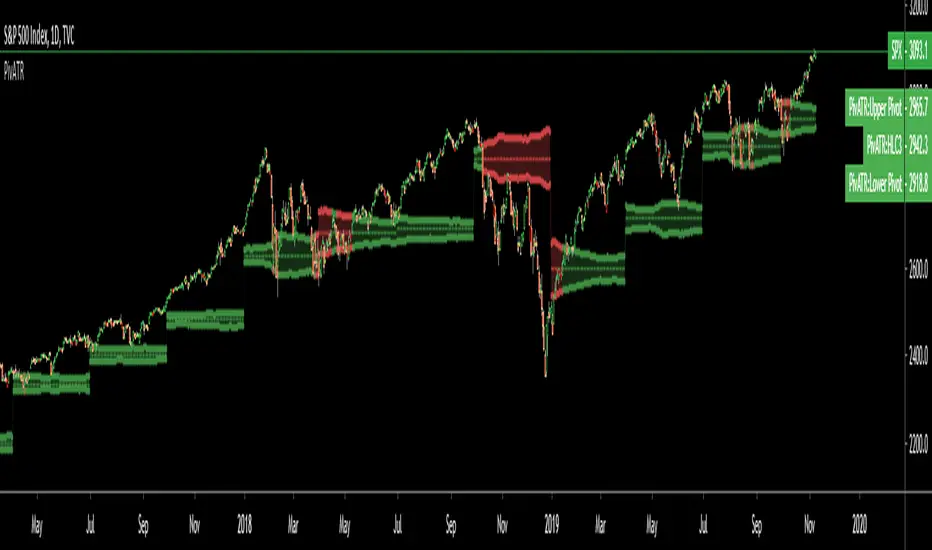
Adaptive Pivot (HLC3)SUMMARY:
Standard Pivot (HLC3) with ATR leeway added to make it adaptive to market volatility.
DESCRIPTION:
Adaptive Pivot is an indicator utilizing the simplicity of HLC3 Pivots as a turning point (and sometimes a trend indicator) while addressing it's fixed and inflexible nature.
Because the indicator is just a single line in the chart, the price may go near it but never touch it. Or it can go pass through it and never retest it again. In an attempt to lessen these from occurring, we can combine pivots with average true range (ATR). This is the specific formula I applied in this indicator:
>Upper Pivot = HLC3 + ATR
>Lower Pivot = HLC3 - ATR
This creates a kind of a range or cloud around the Pivot, making it possibly a more accurate indicator for market turning points.
ADJUSTABLE PARAMETERS:
The usual ATR parameters are included in this indicator:
>ATR_Length = input(14, title="ATR Length", minval=1)
>ATR_Smoothing = input(title="ATR Smoothing", defval="RMA", options="RMA", "SMA", "EMA", "WMA")
Added to the usual ones is this:
>ATR_Multiplier = input(1, title="ATR Multiplier", minval=0.1)
which modifies the extent of the ATR (similar to Chandelier Exit) as it is added/subtracted from the pivot values.
Pivot’s timeframe is also adjustable:
>Pivot_Timeframe = input("3M", title='Pivot Resolution')
Note: I did not lock the type to input.resolution to allow for more possible timeframes.
OTHER PARAMETERS
Indicator color will change to green when the open is above the HLC3 Pivot and change to red when the reverse is true.
Divergences (Pivots)I created the divergence indicator using pivot points.
Leftbars and Rightbars of Pivots are the same here and taken together as "Div Period", default set as 2 (= "Short" period).
The second period ("Long") multiplies this by 2, if a period of 2 is set, the "Long" period will be 4.
The third period ("Long2") multiplies the "Long" by 2, in this case the "Long2" period would be 8.
In these periods the high and lows of "source" (default = "close", can be changed though) and "RSI" are captured and compared.
The default "RSI length" of "14" can be changed as well.
"Short", "Long" and "Long2" periods can be made visible together or separately (Settings > Inputs).
I recommend to use a "Period" of "1" when using "W" charts, "1 or 2" on "D" charts, and "2 or 3" (maybe higher) when using lower timeframes.
Bullish divergences are "Green", Bearish divergences are "Red", Hidden divergences (Bullish and Bearish) are "White".
"Short" > "▲▼" (Bullish = Up, Bearish = Down)
"Long" > "∆∇" (Bullish = Up, Bearish = Down)
"Long2" > "⇧⇩" (Bullish = Up, Bearish = Down)
The "Values" of "HH"(Higher High), "LL" (Lower Low"), "HL"(Higher Low) & "LH"(Lower High) can be made visible (Settings > Inputs).
Thank you!
Murreys Math Lines Box OR Ratio PivotsI'm publishing my second script, though nothing extraordinary, I believe there is user group for Murry Math indies and the only "proper one" (According to my usage) I found was of RicardoSantos, here is the link :
He developed that script in 2014 and it is in need of update to Pine V4 and I'm doing the needful as its user.
All the updates from my end are listed below:
1. Updated to Pine V4
2. Automatic octave selection
3. In auto mode one can switch octave
4. This script is color coded with intention of use on dark theme, one can change the colors to use it on white background with simple few clicks as pinelines have been used
Other thing I want to add is that usage of this is not very clear to many users, so I'll do little explaining here;
Lets start with what is Octave? Octave is basically distance between square of two whole numbers, this is hard-fast method to calculate, Murry has made it far more complicated to use practically. In mathematical formula terms it could be something like this for script trading at 11890 (CMP)
Step 1: Square Root of CMP i.e Square Root of 11890 = 109.041 = Rounded to 109
Step 2: You can either take one whole number higher or lower than 109, which is 108 or 110. We will take 108
Step 3: Square of 108 = 11664 and Square of 109 = 11881
Step 4: Octave => Distance between (Lowlevel) 11664 and (Higherlevel) 11881
I've automated it so you don't need to calculate, but there is also manual entry possible if you want to calculate octaves yourself, there are different ways to calculate and some like to just take High and Low's of the day or week or month, whatever you like. When I used it I did it strictly this way, so automation is based on it. This is very subjective matter so don't ask to change the calculation of this, if I started doing that every second person would ask me to modify it to different calculation..and thats...just not possible to do.
This is output for calculation we just did above
This is octave shift option (Which basically shifts to next whole number square in above calculation)
Normal nomenclature on octaves and important color codes
+2/8: Extreme overbought = Blue Color and solid line
+1/8: OverBought
8/8: Hardest line to rise above (overbought) = White Color and solid line
7/8: Fast reverse line (weak)
6/8: Pivot reverse line = Yellow Color and solid line
5/8: Upper trading range
----------------------------------------
4/8: Major reversal line = Green Color and solid line
----------------------------------------
3/8: Lower trading range
2/8: Pivot reverse line = Blue Color and solid line
1/8: Fast reverse line (weak)
0/8: Hardest line to fall below (oversold) = White Color and solid line
-1/8: Oversold
-2/8: Extreme Oversold = Yellow Color and solid line
Other lines that I've not mentioned color codes for are minor and are usually plotted in dotted format.
Resources on complete technique to trade and importance of levels (highly recommended to read carefully before trading), if you don't know how to get this for free don't worry you can just google Murrey math and you will find it somewhere, its just that it would be in little scattered manner.
www.scribd.com
Enjoy!


Momentum Strength Buy Sell Pivot StudyUses a combination of different pivot calculations to determine when an equity has peaked or bottomed out and provides visual Buy and Sell indicators as well as the capability to set alerts for buy and sell actions.
@TheGeeBee - Credit where used
Notes:
// Use 1,2,3,5 minute time frames
// EMA Cross line and offset allows user to alter the sell characteristics where the candle low is above the EMA line and indicates a possible pre-pivot reversal
// Adjust Min and Max pivots based on risk profile
// Use Bars, Candles or Heikin-Ashi
// Multiple Green Bars = BTFD
// Multiple Red bars = If you didn't already get out, do it now!

zigzag PivotsThis is based on two model : the first is the zigzag model of Ricardo Santos
the second is a pivot system for high and low to find resistance made by jaggedsoft
I try to show the connection between them and to form a cross of when the zigzag model crossing the pivot model
this is seen in show sig
best approach is to find the low based on the pivot system and try to make your buy around that spot . when there is high resistance either exit or buy when the asset cross it above . in case of short do the opposite

NimhFX Multi TF PivotsNimhfx Multi TF Pivots
Written by NickThomas
----------------------------------
Multiple Timeframe EMA based pivot points
The Indicator was developed to keep track of EMA based levels across multiple timeframes, without the need for switching back and forth and marking out levels.
You are allowed to use '3 Sets' of objects - each can be configured to display the Pivot based on the input variables you set.
Example (Setup as default settings)
Visibility Inputs
Show Pivot Set # Titles - Displays the Text Labels above the pivot points - ON/OFF
Show Pivot Set # Levels - Displays the Levels set by the configuration - ON/OFF
Pivot Set #1
Pivot Set #1 Timeframe - 60 - Additional Timeframes can be configured using the standards setout in Pinescript (1, 5, 8, 15, 30, 45, 60, 120, 240, D, W, M)
Pivot Set #1 - EMA #1 Period - 100 (100 Period EMA)
Pivot Set #1 - EMA #2 Period - 200 (200 Period EMA)
Pivot Set #1 - EMA #3 Period - 500 (500 Period EMA)
This configuration will draw pivot points at the following locations:
60 Minute Timeframe 100 Period EMA
60 Minute Timeframe 200 Period EMA
60 Minute Timeframe 500 Period EMA
The Indicator can work across whichever timeframe and whichever EMA period you desire for your setup.
Pivot Set #2 and Pivot Set #3 are additional instances of Pivot Set #1 for use with different settings but operates in the same manner.


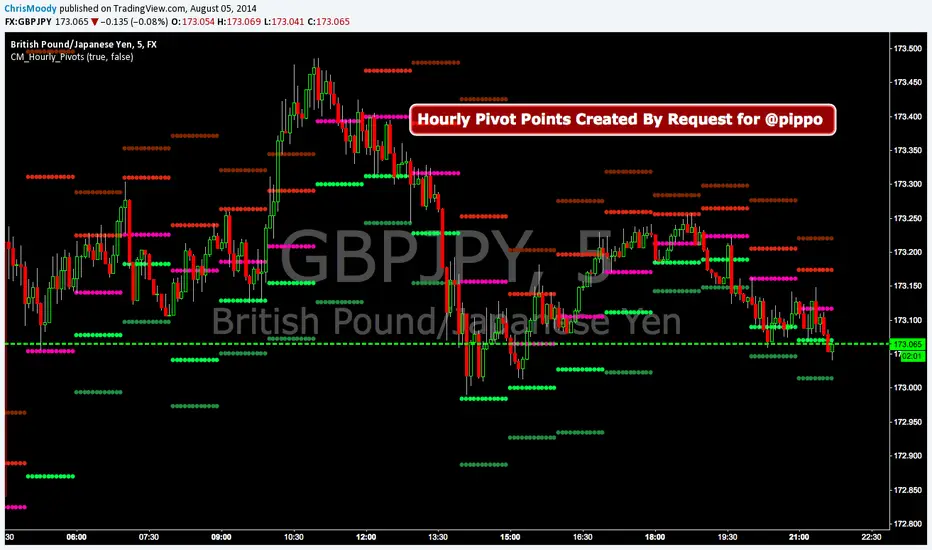
CM_Hourly PivotsSimple Code for Hourly Pivot Points Requested by user pippo
Inputs Tab:
Turn On/Off Pivots
Turn On/Off R3/S3
IMS 4H Structural Framework (MA / Pivot / MTF Levels)IMS 4H Structural Framework (MA / Pivot / MTF Levels)
✅ SHORT, COMPLIANT DESCRIPTION (Invite-Only Safe)
Description:
This tool visualizes a 4H Institutional Market Structure (IMS) framework by combining three workflow components into a single structural map—MA-based bias shifts, pivot-derived 4H trendlines, and multi-timeframe (1H/45m) structural levels.
It does not generate signals or performance claims.
The framework is designed purely for visual, discretionary analysis of structural flow, risk context, and higher-timeframe alignment.
Core Components:
• 4H Bias Shift (MA): Highlights directional bias transitions.
• 4H Trendlines (Pivot-Based): Shows structural slopes and reaction zones.
• MTF Levels (1H & 45m): Adds micro-structure inside the 4H box for refinement.
• Caution Zones: Marks potential reaction areas near support/resistance or trendlines.
• Dashboard: Displays bias context and educational guidance only.
Intended Use:
For traders who analyze 4H structural flow and wish to visualize bias, context, and multi-timeframe alignment—not for automation or signals.
________________________________________
✅ SHORT, SAFE DISCLAIMER (Invite-Only Approved)
Disclaimer:
This tool is for educational and informational purposes only.
It does not provide trading signals, financial advice, or performance guarantees.
All decisions remain solely with the user.
