Internal Pivot Pattern [LuxAlgo]The Internal Pivot Pattern indicator is a novel method allowing traders to detect pivots without excessive delay on the chart timeframe, by using the lower timeframe data from a candle.
It features custom colors for candles and zigzag lines to help identify trends. A dashboard showing the accuracy of the pattern is also included.
🔶 USAGE
We define a pivot as the occurrence where the middle candle over a specific interval (for example, the most recent 21 bars) is the highest (pivot high) or the lowest (pivot low). This method commonly allows for identifying swing highs/lows on a trader's chart; however, this pattern can only be identified after a specific number of bars has been formed, rendering this pattern useless for real-time detection of swing highs/lows.
This indicator uses a different approach, removing the need to wait for candles to form on the user chart; instead, we check the lower timeframe data of the current candle and evaluate for the presence of a pivot given the internal data, effectively providing pivot confirmation at the candle close.
An internal pivot low pattern is indicative of a potential uptrend, while an internal pivot high is indicative of a potential downtrend.
Candles are colored based on the last internal pivot detected, with blue candle colors indicating that the most recent internal pivot is a pivot low, indicating an uptrend, while an orange candle color indicates that the most recent internal pivot is a pivot high, indicating a downtrend.
🔹 Timeframes
The timeframe setting allows controlling the amount of lower timeframe data to consider for the internal pivot detection. This setting must be lower than the user's chart timeframe.
Using a timeframe significantly lower than the user chart timeframe will evaluate a larger amount of data for the pivot detection, making it less frequent, while using a timeframe closer to the chart timeframe can make the internal pivot detection more frequent, and more prone to false positives.
🔹 Accuracy Dashboard
The Accuracy Dashboard allows evaluating how accurate the detected patterns are as a percentage, with a pattern being judged accurate if subsequent patterns are detected higher or lower than a previous one.
For example, an internal pivot low is judged accurate if the following internal pivot is higher than it, indicating that higher highs have been made.
This dashboard can be useful to determine the timeframe setting to maximize the respective internal pivot accuracy.
🔶 SETTINGS
Timeframe: Timeframe for detecting internal swings
Accuracy Dashboard: Enable or disable the Accuracy Dashboard.
🔹 Style
Internal Pivot High: Color of the dot displayed upon the detection of an internal pivot high
Internal Pivot Low: Color of the dot displayed upon the detection of an internal pivot low
Zig-Zag: Color of the zig-zag segments connecting each internal pivot
Candles: Enable candle coloring, with control over the color of the candles highlighting the detected trend
在脚本中搜索"pivot"

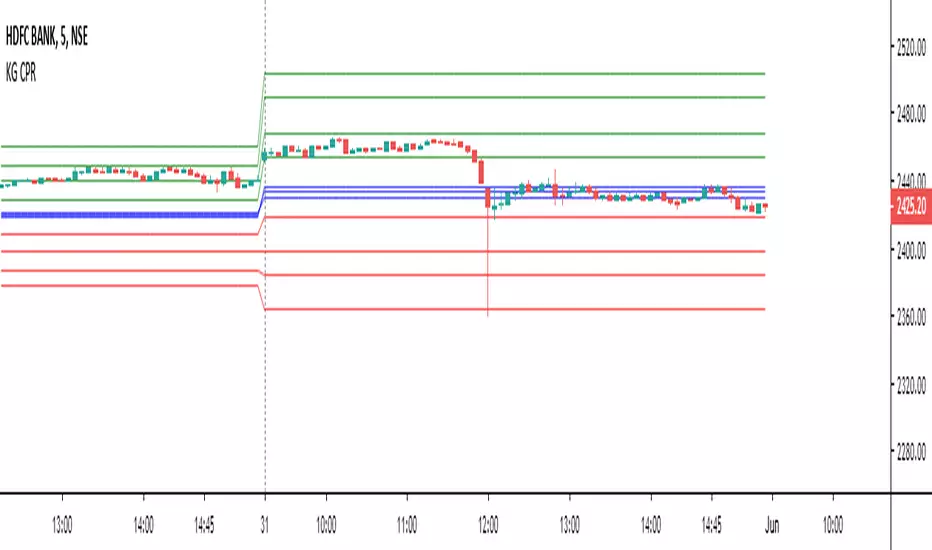
Central Pivot Range (CPR)Central Pivot Range (CPR) Indicator
The Central Pivot Range (CPR) indicator is designed to help traders identify key levels of support and resistance based on pivot points calculated from the previous day's price action. The CPR levels act as critical areas of price convergence and potential reversal, which can help in anticipating future price movements. This version of the CPR indicator includes customizable features to enhance your trading strategy.
Key Features:
Custom Timeframe Support: The indicator allows you to select a custom timeframe for calculating the CPR levels. By default, it uses the daily timeframe ('D'), but you can adjust it to any other timeframe of your choosing. The indicator calculates the CPR and support/resistance levels based on the data from the selected timeframe.
Central Pivot (CP), Below Central Pivot (BC), and Top Central Pivot (TC):
Pivot (CP): The central pivot point is calculated as the average of the high, low, and close prices of the selected timeframe.
Below Central Pivot (BC): This is the midpoint between the high and low prices of the selected timeframe.
Top Central Pivot (TC): This is calculated based on the central pivot and below central pivot, providing a range between support and resistance levels.
Support and Resistance Levels (S1, S2, S3, R1, R2, R3):
Support Levels (S1, S2, S3): These are calculated based on the central pivot, providing potential areas where price may find support and reverse.
Resistance Levels (R1, R2, R3): These are calculated similarly but indicate potential resistance zones where price may face challenges to move higher.
Dynamic Plotting Based on User Input:
The indicator allows you to choose which levels to display on the chart, including the Central Pivot (CP), Support Levels (S1, S2, S3), and Resistance Levels (R1, R2, R3), all of which can be toggled on or off via checkboxes.
CP is displayed in white, BC and TC in blue, Support levels (S1, S2, S3) in green, and Resistance levels (R1, R2, R3) in red.
Daywise Calculations:
The CPR and levels are based on the previous day’s price action, providing historical support and resistance levels that can be useful for intraday analysis.
The request.security function is used to fetch the pivot data from the custom timeframe, ensuring the levels are calculated based on the last completed period (previous day) without repainting.
Customization Options:
CPR Plot: Toggle the visibility of the central pivot range (CPR) lines.
Support Levels (S1, S2, S3): Choose to show or hide the support levels.
Resistance Levels (R1, R2, R3): Choose to show or hide the resistance levels.
Custom Timeframe: Set a custom timeframe for calculating the CPR, allowing for more flexible and tailored analysis.

[TTI] Gilmo's Pocket Pivots and Buyable Gap UpsHISTORY AND CREDITS–––––––––––––––––––––––––––––––––––––––––––––––––––––––
The credit for this goes to Gilmo - Gil Morales. Who I have learned the methodology from. If you are looking to understand more, just read his books where he covers many aspects of his IBD inspired trading. Hes a disciple of Bill Oneil.
WHAT IT DOES––––––––––––––––––––––––––––––––––––––––––––––––––––––––––––––
The indicator has 2 major signals. Showing the PocketPivots and Showing Buyable Gap Ups.
Both are bullish signals for a long play.
⬜️. Pocket Pivots are indicated by white arrow up, and show a combination of setups, but the main criteria is a day where the up volume is higher than any down volume for the last 10 days.
🟩 Green Buyable Gap Up - shows the places where certain technical criteria are met for a Gap and Go scenario. The criteria requires a big enough gap compared to yesterdays close, strong close and enough volume to make the signal trigger. There is high probability that once these 3 requirements are met, the ticker can experience a gap and go type of situation.
🟦 Blue Buyable Gap Up (early) - show the same as green but remove the criteria for volume. This allows us to jump onboard on the same day of the gap, since generally the volume condition can be evaluated only near the end of the day. In essence the Blue signal is preceeding the Green.
HOW TO USE IT–––––––––––––––––––––––––––––––––––––––––––––––––––––––––––––
Both are bullish signal for a long setup.
I have found that the Pocket Pivot is a very reliable signal, even in a downmarket like the 2022. I look for a proper base and then the pocket pivot has been a reliable trigger for change in the supply and dynamic balance.
The Buyable Gap Up, I also look to grab after a base formation. I especially look to play buyable gap ups in the beginning of a trend reversal. This means that Gap up after a long uptrend (3+ bases) is more likely to fail than those early in the trend.
My suggestion is to add this tool to your toolbox of evaluation as a time entry signal.

Market PivotsMarket pivots take previous high, low, close to calculate pivot range.
* within yellow pivot range, expecting choppy. not a good location to entry a trade
* above yellow pivot range, expecting bullish.
* below yellow pivot range, expecting bearish.

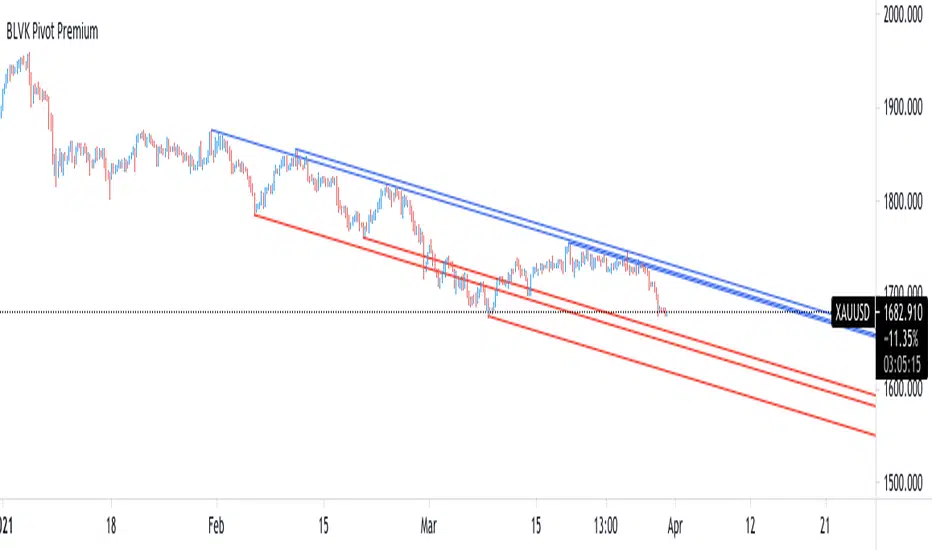
BLVK Pivot PremiumDisplays lines connecting past pivot high/low points with each line having the slope of a linear regression . This slope can also be controlled by the user with the 'Slope' setting. Each line can be used as a support or resistance by the user.
Settings
Length : Pivot length. Use higher values for having lines connected to more significant pivots points.
Lookback : Number of lines connecting a pivot high/low to display, with a total of lines equal to Lookback*2
Slope : Allows the user to multiply the linear regression slope by a number within -1 and 1
Limitations
The script has currently several real time behavior limitations. Lines are displayed retrospectively and will not update with the arrival of new bars. Readjusting the indicator to newer pivots will require the user to either hide/unhide the indicator or change its settings.
High Length or Lookback values might not return any lines if the location of a pivot point is outside the defined buffer size of the indicator (set as 5000 bars).
How To Use
The indicator can be used to get supports and resistances and is more so closer to a drawing tool due to its limitations. The lines not updating with the arrival of new bars have the advantage of providing fixed supports/resistances.
The Slope setting allows the user to control the angle and direction of the lines. Using a Slope of 1 will return lines with the same slope as the one of a linear regression fit from the farthest pivot point displayed by the indicator to the most recent bar.
Conclusion
We hope you like this indicator (drawing tool) and find it useful for drawing your support & resistances in a unique way!
Pocket PivotPockets Pivot were introduced by Gil Morales and Chris Katcher in the book "Trading like an O'Neil Disciple",
Pocket Pivot day occurs when the Volume has been higher than any down day 10 days prior and with a positive close.
Here is shown 5 days Pocket Pivots and 10 Days Pocket Pivots

Expanded Floor Pivot Points UPDATEDThis Central Pivot Range is based on Pivot Boss book from Frank Ochao. All Resistance/Support/CPR width has been reduced for clear view
HMA Pivot Buy/Sell (only) + AlertsThis Pine Script is a lightweight indicator that plots only HMA-based pivot Buy/Sell signals and provides alert conditions for them.
What it does
Calculates a Hull Moving Average (HMA) using either:
a dynamic length based on the chart timeframe, or
a custom user-defined length.
Detects HMA pivot points (local turning points):
Buy signal when the HMA forms a local minimum (trend turns up).
Sell signal when the HMA forms a local maximum (trend turns down).
Optionally plots the HMA line and prints only the Buy/Sell markers on the chart (no extra arrows/emoji/labels from other systems).
Adds TradingView alerts for Buy, Sell, and combined Buy/Sell events.
Signal logic
Buy (HMA Pivot Low) triggers when:
HMA > HMA and HMA < HMA
Meaning: the HMA was falling, formed a bottom, and has started rising.
Sell (HMA Pivot High) triggers when:
HMA < HMA and HMA > HMA
Meaning: the HMA was rising, formed a top, and has started falling.
Inputs
Source: price source used to compute HMA (default: close).
Use Custom HMA Length: enables manual override.
Custom HMA Length: manual HMA period (default: 55).
Alerts: only on bar close:
If enabled, alerts fire only after the bar closes (confirmed signals).
If disabled, alerts can fire intrabar (faster but less stable).
Draw signal on pivot bar (offset -1):
If enabled, markers are drawn on the pivot bar (one bar back) using offset = -1.
If disabled, markers are drawn on the confirmation bar (no offset).
Show HMA line: toggles display of the HMA line.
Alerts available
BUY (HMA Pivot) — triggers on Buy signal.
SELL (HMA Pivot) — triggers on Sell signal.
BUY/SELL (HMA Pivot) — triggers on either Buy or Sell.
Each alert message includes ticker, timeframe, and close price via placeholders:
{{ticker}}, {{interval}}, {{close}}.

Options Pivot Smile## Options Pivot Smile
**Options Pivot Smile** is a visual market-structure indicator that transforms classic daily pivot levels into a smooth, bell-shaped “smile curve.” It is designed to help traders understand price equilibrium, directional bias, and volatility expansion using historically anchored support and resistance zones.
The script is optimized for discretionary analysis, options structure mapping, and futures market context.
---
### Core Concept
This indicator calculates **previous-day Pivot, S1, S2, R1, and R2** levels and projects them backward across configurable historical widths. These anchor points are then connected using a **Catmull–Rom spline**, producing a smooth bell-shaped curve that represents market balance and skew.
The result is a **visual distribution of price pressure**, rather than static horizontal levels.
---
### Key Features
#### 1. Daily Pivot-Based Levels
* Uses **previous daily High, Low, Close**
* Calculates:
* Pivot (P)
* Support: S1, S2
* Resistance: R1, R2
* Optional **pivot shift** for futures or synthetic instruments
* Optional **spread rounding** for options strike alignment
---
#### 2. Historical Anchor Projection
Each level is placed at a different historical distance:
* **R2 / S2** → farthest back
* **R1 / S1** → medium range
* **Pivot** → nearest anchor
This spacing creates the structural foundation for the bell curve.
---
#### 3. Smile / Bell Curve Visualization
* Smooth curve generated using **Catmull–Rom spline interpolation**
* Adjustable smoothness (number of curve segments)
* Customizable color and line width
* Represents equilibrium, skew, and volatility structure
---
#### 4. Structural Aids
Optional visual components include:
* Horizontal projection lines to the current bar
* Dotted straight connecting lines between anchor points
* Anchor dots at each pivot level
* Adaptive-width level boxes scaled by ATR
---
#### 5. Professional Styling Controls
* Line style: Solid / Dotted / Dashed
* Adjustable strike line width
* Independent colors for:
* S2, S1
* Pivot
* R1, R2
* Box opacity, borders, and label text colors
---
### Use Cases
* Market balance and mean-reversion analysis
* Options strike clustering and distribution framing
* Futures pivot bias visualization
* Contextual support/resistance mapping
* Intraday and swing structure reference
---
### Notes & Limitations
* This is a **visual analytical tool**, not a trading strategy
* Does not generate buy/sell signals
* Best used in conjunction with price action, volume, or volatility tools
* Requires sufficient historical bars to render the full structure
---
### Recommended Timeframes
* Intraday (5m–30m) for structure context
* H1–H4 for swing equilibrium
* Works on all symbols with daily data availability
---
**Options Pivot Smile** converts traditional pivot math into an intuitive visual distribution, helping traders see market structure as a curve rather than isolated lines.

Trade Pivot ProEnglish (required first):
Trade Pivot Pro is a comprehensive indicator that combines advanced Pivot Point calculations, Moving Averages (SMA & EMA), ATR-based volatility bands, time cycle logic, and customizable alerts.
Key Features
Pivot Points: Multiple calculation methods (Traditional, Fibonacci, Woodie, Classic, DM, Camarilla).
Flexible Time Cycles: Automatic pivot anchoring based on chart timeframe, plus manual options (Daily, Weekly, Monthly, Quarterly, Yearly, Bi-yearly, Tri-yearly, Quinquennial, Decennial).
Moving Averages: Four configurable SMA/EMA lines (21, 50, 100, 200 periods) with slope detection.
ATR Bands: Dynamic upper and lower bands plotted around price to visualize volatility.
Alerts:
MA slope changes (Up/Down).
Pivot + 200 SMA trend confirmation.
ATR volatility threshold (High/Low).
Combined Pivot + SMA + ATR strong trend alerts.
Time Cycles
Chart Timeframe Pivot Timeframe
10s 15 minutes
1m 1 hour
5m 4 hours
15m 1 day
1h 1 week
4h 1 week
1D 1 month
1W 3 months
1M 1 year
This indicator helps traders identify trend direction, volatility conditions, time cycles, and key support/resistance levels in one unified tool. It is suitable for intraday and higher timeframes, with options to use daily-based or intraday pivot values.
Note: This script is free of advertisements and intended purely for educational and trading analysis purposes.

Double MOST with Pivot and EMAMOST Long Strategy with Multi-Filter Confirmation (Pivot + VAR Trend Filter)
This strategy combines a custom MOST stop-line structure with a moving average trend filter (EMA / VAR / ZLMA), daily pivot levels, and a 9-period VAR filter to generate clean long-only entries.
It aims to capture early trend continuations while avoiding reversals and false breakouts.
✔ Buy Conditions
A long position is opened only if all of the conditions below occur simultaneously:
MA (ort) > MOST Line (s2)
– Confirms that momentum is on the long side.
Price > Daily Pivot (pvt_gun)
– Ensures the market is trading above the day’s fair-value level.
Price > VAR(9)
– Short-term VAR filter to confirm trend strength and reduce noise.
Only the first bar where all conditions turn true generates a position.
✔ Sell Condition
A long position is closed when:
MOST Line (s2) crosses above MA (ort)
– Indicates a momentum shift against the long position.
✔ Execution Style (MetaStock-like)
Strategy operates long-only
Orders are filled on the next bar open, not on the signal bar
Commission: 0.03% (3 bps / on-binde 3)
Position size: 100% of equity per trade
This makes the behavior comparable to classical MetaStock backtesting logic.
✔ Chart Markers
Only actual trade entries and exits are drawn
No repeated signals or overlapping markers
Clean visual trade history
Purpose
This strategy is ideal for traders who want:
A structured long-only trend model
A multi-layer confirmation filter
Clean execution without repaint
High-quality entries above market structure levels

QuantMotions - Pivot Timeline ProjectionQuantMotions – Pivot Timeline Projections is an advanced time-based forecasting tool that uses a unique Twin Pivot model to project future price-time structures.
It combines classical Gann principles with modern quantitative logic to generate highly precise time projections, dynamic angles, and future support/resistance timelines across multiple timeframes.
Whenever two matching pivots (High ↔ Low) of the same length are detected, the indicator calculates a true calendar-time angle and extends it forward, forming dynamic Gann-style fans that adapt to the market in real time.
Perfect for traders who want to integrate price + time forecasting into their strategy.
Key Features:
✔ Twin Pivot Detection
Automatically identifies valid pivot pairs of equal cycle length and opposite direction.
Once confirmed, the pivot becomes a time anchor for future projections.
✔ True Time-Based Angle Projections
Unlike standard Gann tools that rely on bar-counting, this indicator uses real calendar time (milliseconds) to calculate:
This produces significantly more accurate forecasting lines.
✔ Multi-Timeframe Pivot Cycles
Activate time cycles such as:
30M, 1H, 4H, 12H
1D, 7D, 30D
60D, 90D, 120D, 180D, 270D, 360D
Each cycle uses a dedicated color and projection style for clarity.
✔ Dynamic Support/Resistance Timefans
- Every confirmed pivot generates two future projections:
- The main time-angle projection (Gann-style forward fan)
- A secondary projection based on a fixed ratio (1/8), acting as dynamic future support
Both extend until the structure breaks based on ATR tolerance.
✔ ATR-Based Validation
Projection lines remain valid until price breaks them with a configurable ATR multiplier.
This removes noise and keeps only meaningful structures.
✔ Volume Delta Tracking (Optional)
Tracks up-volume and down-volume along the time cycle to validate directional bias.
Info labels show:
- cycle length
- angle
- delta volume
- delta percentage
Seconds-based volume tracking supported for Premium users.
✔ Smart Info Labels
Displays detailed pivot information only for the highest-timeframe pivot at each bar
→ ensures high usability without chart clutter.
🔷 Why This Indicator Is Special
This tool merges Gann angles, time cycles, and quantitative price action into a single engine.
It does not rely on static angles or simple bar offsets.
Instead, it uses:
- real time
- real slope
- real cycle symmetry
- real price movement
The result is a uniquely accurate forecasting model that is extremely difficult to replicate manually.
🔷 Perfect For
- Intraday traders
- Swing traders
- Index, Crypto, Metals, and FX traders
- Gann and cycle-based analysts
- Structure and trend change detection
- Time/price projection strategies
🔷 Inputs & Customization
- ATR break tolerance
- Multiple cycle activation toggles
- Custom color sets for each timeframe
- Second-based or standard timeframe volume tracking
- Enable/Disable info labels
🔷 Note
Some features (like seconds-based volume tracking) depend on TradingView Premium and additional broker data sources.
Loading times may vary when many long-term cycles are enabled simultaneously.
🔷 Access
This is an Invite-Only Script by QuantMotions.
Access is granted after purchase.
For more information, please visit the official product page or contact us directly.

VWAP Multi Sessions + EMA + TEMA + PivotThis indicator combines several technical tools in one, designed for both intraday and swing traders to provide a complete view of market dynamics.
- VWAP Multi Sessions: calculates and plots five independent VWAPs, each based on a specific time range. This allows you to better identify value zones and price evolution during different phases of the trading day.
- Moving Averages (EMA): three strategic EMAs (55, 144, and 233 periods) are included to track the broader trend and highlight potential crossovers.
- TEMA (Triple Exponential Moving Average): two TEMAs (144 and 233 periods) offer a more responsive alternative to EMAs, reducing lag while filtering out some market noise.
- Daily Levels: the previous day’s open, close, high, and low are plotted as key support and resistance references.
- Pivot Point (P): also included is the classic daily pivot from the previous session, calculated as (High + Low + Close) / 3, which acts as a central level around which price often gravitates.
In summary, this indicator combines:
- intraday value references (session VWAPs),
- trend indicators (EMA and TEMA),
- and daily reference points (OHLC and Pivot).
It is particularly suited for intraday, scalping, and swing trading strategies, helping traders anticipate potential reaction zones in the market more effectively.

EMA/MA Unified with Pivot S/RIndicator Name:
EMA/MA Unified with Pivot S/R (Moving Average + Pivot Support/Resistance System)
————————————
Indicator Purpose:
This indicator combines multi-period EMA/MA moving averages with the Pivot Support/Resistance (Pivot S/R) system to identify market trends, pullback zones, and key support and resistance levels, helping traders more clearly judge market structure and entry and exit points.
————————————
Functional Description:
A. EMA/MA Trend System:
1. Secondary Retracement Lines (EMA60/MA60): Display short-term price fluctuations and pullback levels, helping to determine entry or expansion opportunities.
2. Primary Trend Moving Averages (EMA240/EMA720/EMA1440): Represent short-term, medium-term, and long-term trends, respectively, and are used to determine overall market direction. EMA240 serves as a short-term primary trend reference line, useful for trend confirmation and pullback trading.
B. EMA720 and EMA1440 Crossover Signals:
1. Golden Cross (EMA720 crosses above EMA1440): Confirms a bullish trend.
2. Death Cross (EMA720 crosses below EMA1440): Confirms a bearish trend.
C. Trend Band Fill:
Green bands indicate bullish trend bands, and red bands indicate bearish trend bands, visually displaying the direction and strength of the primary trend.
D. Pivot Point Support and Resistance System:
1. Pivot points are categorized as short-term swing support and resistance, medium-term pullback support and resistance, and long-term trend support and resistance, helping traders identify key support and resistance areas.
2. The system automatically generates corresponding multi-period pivot lines based on the current period and user settings, allowing trading in conjunction with moving average trends.
3. Pivot point display allows for flexible selection, displaying only short-term, medium-term, or long-term key points.
————————————
Using Trend Lines:
A. Trend Trading:
1. Bullish Primary Trend: If the price breaks through the trend line and rises above the EMA240 or EMA/MA60, consider going long. The EMA240 can be used as a short-term trend filter to confirm that the bullish primary trend persists after a pullback.
2. Bearish Primary Trend: If the price breaks through the trend line and falls below the EMA240 or EMA/MA60, consider going short. The EMA240 can also filter out false breakouts and confirm the trend direction.
B. Pullback Trading:
1. Combining short-term pivot points (fluctuations) with trend lines can identify entry points after short-term price pullbacks.
2. Combining medium-term pivot points (retracements) with trend lines and the EMA240 can identify safe positions to add to positions after the trend continues.
C. Key Support and Resistance:
1. The intersection of pivot lines and trend lines represents potential support/resistance reversal points, suitable for use as take-profit or stop-loss references.
2. When a trend line breaks through a pivot line, it can be used as a trend confirmation or breakout trading signal.
3. The EMA 240 can be used as an additional filter to enhance the effectiveness of support and resistance levels.
————————————
Suggestions for Use:
1. Suitable for use in conjunction with trend line and price pattern analysis. Prioritize trend following when the trend is clear, combining pivot points and the EMA 240 for trading.
2. Switch between different moving averages and pivot point systems to capture trends and pullbacks at different levels.
3. The EMA 240, as a short-term trend reference line, can filter out false breakouts and optimize entry and exit points.
——————————————————————————————————————————————————————————
指标名称:
EMA/MA 融合枢轴支撑/阻力系统(移动平均线 + 枢轴支撑/阻力系统)
————————————
指标用途:
该指标将多周期 EMA/MA 移动平均线与枢轴支撑/阻力系统(枢轴支撑/阻力系统)相结合,以识别市场趋势、回调区域以及关键支撑位和阻力位,帮助交易者更清晰地判断市场结构以及入场和出场点。
————————————
功能描述:
A. EMA/MA 趋势系统:
1. 次要回撤线 (EMA60/MA60):显示短期价格波动和回调水平,帮助确定入场或扩展机会。
2. 主要趋势移动平均线 (EMA240/EMA720/EMA1440):分别代表短期、中期和长期趋势,用于判断整体市场方向。 EMA240 作为短期主要趋势参考线,可用于趋势确认和回调交易。
B. EMA720 和 EMA1440 交叉信号:
1. 黄金交叉(EMA720 上穿 EMA1440):确认看涨趋势。
2. 死亡交叉(EMA720 下穿 EMA1440):确认看跌趋势。
C. 趋势带填充:
绿色带表示看涨趋势带,红色带表示看跌趋势带,直观地显示主要趋势的方向和强度。
D. 枢轴点支撑位和阻力位系统:
1. 枢轴点分为短期波动支撑位和阻力位、中期回调支撑位和阻力位以及长期趋势支撑位和阻力位,帮助交易者识别关键支撑位和阻力位。
2. 系统会根据当前周期和用户设置自动生成相应的多周期枢轴线,以便结合移动平均线趋势进行交易。
3. 枢轴点显示允许灵活选择,仅显示短期、中期或长期关键点。
————————————
使用趋势线:
A. 趋势交易:
1. 看涨主要趋势:如果价格突破趋势线并升至 EMA240 或 EMA/MA60 上方,则考虑做多。EMA240 可用作短期趋势过滤器,以确认看涨主要趋势在回调后是否持续。
2. 看跌主要趋势:如果价格突破趋势线并跌破 EMA240 或 EMA/MA60,则考虑做空。EMA240 还可以过滤掉假突破并确认趋势方向。
B. 回调交易:
1. 将短期枢轴点(波动)与趋势线相结合,可以识别短期价格回调后的入场点。
2. 将中期枢轴点(回撤点)与趋势线和 EMA240 指标相结合,可以识别趋势持续后可安全加仓的仓位。
C. 关键支撑位和阻力位:
1. 枢轴点和趋势线的交点代表潜在的支撑/阻力反转点,适合用作止盈或止损的参考。
2. 当趋势线突破枢轴点时,可以作为趋势确认或突破的交易信号。
3. EMA 240 指标可作为额外的过滤器,增强支撑位和阻力位的有效性。
————————————
使用建议:
1. 适合与趋势线和价格形态分析结合使用。在趋势清晰时优先进行趋势跟踪,结合枢轴点和 EMA 240 指标进行交易。
2. 在不同的移动平均线和枢轴点系统之间切换,以捕捉不同水平的趋势和回调。
3、EMA 240作为短期趋势参考线,可以滤除假突破,优化进出点。

Auto-Calculated Pivot Line/Zone (Based on Time Range)Automatically Calculated Pivot Line/Zone
Harness the power of precision with this Custom Time Range Average Line indicator—designed to pinpoint key equilibrium and pivot levels within consolidation zones after a breakout. Select any start and end time to capture the critical price action shaping the market structure between swings, and calculate the true average price using your choice of open, close, high, low, or midpoint.
Once the defined period concludes, the indicator freezes the average and extends it forward as a clear horizontal ray, acting as a powerful reference for fair value and market balance. This dynamic line shines brightest within consolidation phases, helping traders identify pivot points and equilibrium zones that often serve as magnets for price after a breakout.
Customize the line width to suit your style—use a thinner line width input for a precise single average line, or increase the width to visually represent a broader range or zone. Fully adjustable line color and thickness options ensure this tool integrates seamlessly into any chart setup.
Elevate your trading edge by visualizing the hidden balance points between market swings—turning consolidation chaos into clear, strategic opportunities!

Bull Bear Pivot by RawstocksThe "Bull Bear Pivot" indicator is a custom Pine Script (v5) tool designed for TradingView to assist traders in identifying key price levels and pivot points on intraday charts (up to 1-hour timeframes). It combines time-based open price markers, pivot high/low detection, and candlestick visualization to provide a comprehensive view of potential support, resistance, and trend reversal levels. Below is a detailed description of the indicator’s functionality, features, and intended use.
Indicator Overview:
The "Bull Bear Pivot" indicator is tailored for intraday trading, focusing on specific times of the day to mark significant price levels (open prices) and detect pivot points. It plots horizontal lines at the open prices of user-defined sessions, identifies pivot highs and lows on the current chart timeframe, and overlays custom candlesticks to highlight price action. The indicator is designed to work on timeframes of 1 hour or less (e.g., 1-minute, 3-minute, 5-minute, 15-minute, 30-minute, 60-minute) and includes a warning mechanism for invalid timeframes.
Key Features:
Time-Based Open Price Markers:
The indicator allows users to define up to five time-based sessions (e.g., 4:00 AM, 8:30 AM, 9:30 AM, 10:00 AM, and a custom time) to capture the open price at the start of each session.
For each session, it plots a horizontal line at the 1-minute open price, extending from the session start to the market close at 4:00 PM EST.
Each line is accompanied by a label positioned 5 bars to the right of the market close (4:00 PM EST), with the text right-aligned and vertically centered on the line.
Users can enable/disable each marker, customize the session time, label text, line color, and text color via the indicator’s settings.
Pivot Highs and Lows:
The indicator calculates pivot highs and lows on the current chart timeframe using the ta.pivothigh and ta.pivotlow functions.
Pivot highs are marked with green triangles above the bars, and pivot lows are marked with red triangles below the bars.
The pivot period (lookback/lookforward) is user-configurable, allowing flexibility in detecting short-term or longer-term reversals.
Custom Candlesticks:
The indicator overlays custom candlesticks on the chart, colored green for bullish candles (close > open) and red for bearish candles (close < open).
This feature helps visualize price action alongside the open price markers and pivot points.
Timeframe Restriction:
The indicator is designed to work on timeframes of 1 hour or less. If the chart timeframe exceeds 1 hour (e.g., 4-hour, daily), a warning label ("Timeframe > 1H\nIndicator Disabled") is displayed, and no elements are plotted.
Customizable Appearance:
Users can customize the appearance of the open price marker lines, including the line style (solid, dashed, dotted) and line width.
Labels for the open price markers have no background (transparent) and use customizable text colors.

Pivot Length Percentiles Oscillator# Pivot Length Percentiles Oscillator: Technical Mechanics Explained
## Introduction
The Pivot Length Percentiles Oscillator is a statistical approach to identifying potential market reversals by analyzing the distribution of price movements relative to pivot points. This publication explains the technical mechanics behind the indicator.
## Core Mechanics
### 1. Pivot Point Detection
The indicator begins by identifying significant pivot highs and lows using a user-defined lookback period:
- `lft`: Number of bars to the left of potential pivot point
- `rht`: Number of bars to the right of potential pivot point
These parameters determine how "significant" a pivot needs to be to qualify for analysis.
### 2. Distance Measurement & Historical Database
For each new pivot point identified, the indicator:
- Calculates the absolute price distance from the previous pivot of the same type
- Records the number of candles between consecutive pivots
- Stores these measurements in dynamic arrays that build a historical database
### 3. Statistical Distribution Analysis
Rather than using fixed values, the oscillator analyzes the complete distribution of historical pivot distances and calculates key percentile values:
- `lw` (Low Percentile): Lower boundary for statistical significance
- `md` (Mid Percentile): Median statistical boundary
- `hi` (High Percentile): Upper boundary for statistical extremes
### 4. Oscillator Construction
Two primary oscillator lines are calculated:
- Green line (`osc1`): Measures current price's fall below recent highs with `low - ta.highest(high, lft)`
- Red line (`osc2`): Measures current price's rise above recent lows with `high - ta.lowest(low, lft)`
### 5. Threshold Generation
The percentile values from the historical distribution create dynamic threshold lines:
- For downside movements: Scaled versions of the low percentile (`lw_distance_low`) and high percentile (`hi_distance_low`)
- For upside movements: Scaled versions of the low percentile (`lw_distance_high`) and high percentile (`hi_distance_high`)
### 6. Signal Logic
Entry signals are generated when:
- **Bullish Signal**: The downside oscillator crosses below a statistical threshold while price continues showing downward momentum (close < previous close AND close < previous open)
- **Bearish Signal**: The upside oscillator crosses above a statistical threshold while price continues showing upward momentum (close > previous close AND close > previous open)
### 7. Visualization Options
Users can toggle between:
- Standard view: Shows the oscillator and threshold lines
- Percentile view: Displays the current movement's percentile rank within the historical distribution
## Implementation Notes
- The indicator scales threshold values by 0.9 to create a slight buffer that reduces false signals
- The movement's continuation is confirmed by checking both close-to-close and close-to-open relationships
- Arrays dynamically update throughout the chart's history, making the indicator increasingly accurate as more data is processed
## Mathematical Framework
The core statistical function calculates percentiles using linear interpolation between values when needed:
```
calculate_percentile(array, percentile) =
sortedValue +
fraction * (sortedValue - sortedValue )
```
where `index = (array.size - 1) * percentile / 100`
This mathematical approach ensures the thresholds adapt dynamically to changing market conditions rather than relying on fixed values.

Fibonacci Pivot Points & Previous D,W&M Highs/LowsIndicator Overview
This indicator combines Fibonacci Pivot Points with previous high and low levels for different timeframes (day, week, month). It plots these levels on the chart to provide traders with key support and resistance areas, making it easier to identify potential trading opportunities.
Features
Fibonacci Pivot Points:
The indicator calculates pivot points based on the high, low, and close prices.
Fibonacci levels are used to determine support (S1, S2, S3, S4, S5) and resistance (R1, R2, R3, R4, R5) levels.
Users can customize the Fibonacci levels for both support and resistance.
Previous Highs and Lows:
The indicator plots previous day, week, and month high and low levels.
Each of these lines can be customized in terms of visibility, color, and width.
This helps traders to see key historical levels that might act as support or resistance in the future.
Inputs and Customization:
Fibonacci Time Frame:
Users can select the timeframe for calculating the pivot points (Daily, Weekly, Monthly).
Fibonacci Levels:
Customizable input fields for each Fibonacci level (R1, R2, R3, R4, R5, S1, S2, S3, S4, S5).
Previous High/Low Lines:
Day Lines:
Options to show or hide previous day's high/low lines.
Customizable color and width for these lines.
Week Lines:
Options to show or hide previous week's high/low lines.
Customizable color and width for these lines.
Month Lines:
Options to show or hide previous month's high/low lines.
Customizable color and width for these lines.
Technical Calculations:
Fibonacci Pivot Points:
Calculated as:
pp = (High + Low + Close) / 3
S1 = pp - ((High - Low) * Fibonacci Level)
R1 = pp + ((High - Low) * Fibonacci Level)
Previous High/Low Levels:
Uses request.security to fetch previous high and low values for the selected timeframe.
Plotted using line.new to draw lines across the chart.
Plotting:
The indicator plots Fibonacci Pivot Points and previous high/low lines on the chart, using distinct colors for each level.
Customizable transparency and linewidths make it easier to visually interpret the levels.
This indicator is particularly useful for traders who rely on technical analysis to identify key support and resistance levels, offering a blend of historical data and Fibonacci-based predictions.
Feel free to ask if you have any specific questions or need further adjustments!

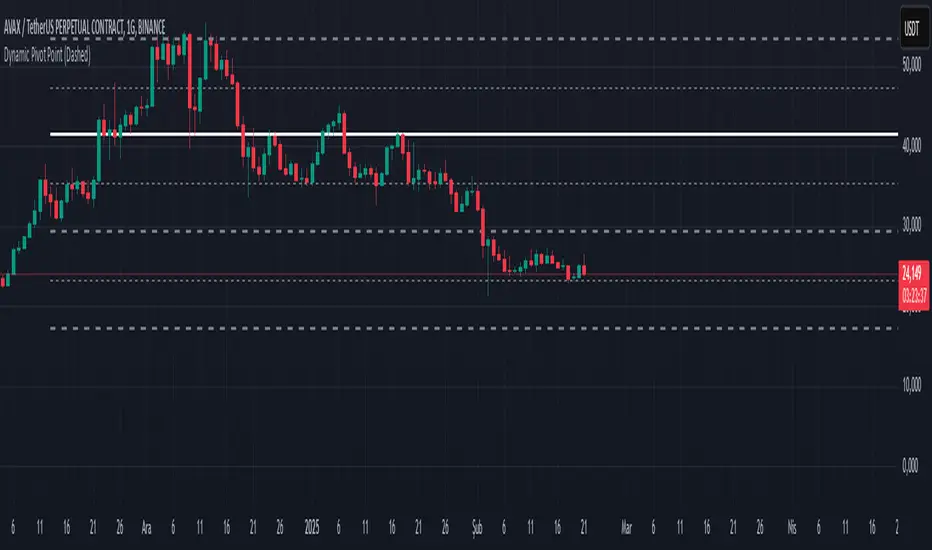
Dynamic Pivot PointsDynamic Pivot Point Indicator
The Dynamic Pivot Point is an indicator used on the TradingView platform that dynamically calculates pivot points and displays them on the chart. This indicator provides automatically adjustable support and resistance levels for different timeframes. By visualizing dynamic levels that match current market conditions, traders can plan their strategies more effectively.
Features
Adapts to Timeframes
The indicator automatically selects the appropriate pivot calculation method based on the user's current timeframe. For example:
For short timeframes such as 1, 3, or 5 minutes, it uses daily (1D) data.
For medium timeframes like 15, 30, or 60 minutes, it uses weekly (1W) data.
For longer timeframes such as 120, 180, or 240 minutes, it uses monthly (1M) data.
For very long timeframes like 360, 480 minutes, daily (D), or weekly (1W), it uses 12-month (12M) data.
Dynamic Pivot Levels
The indicator automatically calculates pivot levels based on the specified high and low values.
Flexible Line Style Options
Users can choose different line styles (Dashed, Dotted, Solid) to improve visual clarity on the chart.
Clean and Clear Visualization
The indicator automatically removes previous lines and displays the latest levels clearly on the chart, preventing clutter and allowing traders to focus more efficiently.
How It Works
Identifying High and Low Levels
The indicator retrieves previous and current high and low levels based on the selected timeframe.
New high and low levels are updated by comparing them with previous levels.
Calculating Pivot Levels
Pivot points are calculated using Fibonacci ratios between high and low levels.
These levels represent dynamic support and resistance zones.
Drawing Lines
The calculated levels are displayed as lines on the chart, each represented with different colors and styles.
Use Cases
Support and Resistance Levels
The indicator dynamically calculates and displays support and resistance levels, serving as reference points for buy and sell decisions.
Trend Analysis
Fibonacci levels help identify trend strength and potential reversal points.
Risk Management
Pivot points assist in setting stop-loss and take-profit levels.
Multi-Timeframe Analysis
Since the indicator adapts to different timeframes, it can be used for both short-term and long-term analysis.
Advantages
✅ Automatic Calculation: No manual calculations are required, as it updates dynamically.
✅ Flexible Timeframe Support: Adapts to different timeframes.
✅ Visual Clarity: Line styles and colors make it easy to distinguish levels on the chart.
✅ Fibonacci Integration: Adds depth to technical analysis.
Conclusion
The Dynamic Pivot Point indicator is a useful tool for both beginners and experienced traders. By dynamically calculating pivot points and Fibonacci levels, it simplifies market analysis and aids in strategy development. With its flexible structure and clear visualization, it can be effectively used across all timeframes.
6 dakika önce
Sürüm Notları
This indicator is written for Support Resistance Traders
HTF EMA Pivot PointsHTF EMA Pivot Points - TradingView Indicator
📌 Overview
The HTF EMA Pivot Points indicator displays Exponential Moving Averages (EMAs) from higher timeframes (HTF) on your current chart. These EMAs act as dynamic support and resistance levels, helping traders identify key areas where price is likely to react.
⚡ Key Features
✅ Plots EMAs from multiple timeframes (1H, 4H, Daily)
✅ Works on any chart (1M, 5M, 15M, etc.)
✅ Acts as pivot points for price action, helping with trade entries & exits
✅ Customizable EMA lengths for flexibility
✅ Ideal for scalping, 0DTE options trading, and swing trading
🛠 How It Works
The script calculates EMAs from 1H, 4H, and Daily charts and overlays them on your current timeframe. These levels often act as support and resistance zones, where price tends to bounce or reject.
🎯 How to Use It for Trading
📍 Bullish Setup (Buy Calls)
• Price bounces off a higher timeframe EMA (e.g., 4H or Daily EMA)
• Confirmation with RSI or Fair Value Gaps (FVGs)
📍 Bearish Setup (Buy Puts)
• Price rejects from a higher timeframe EMA
• Confirmation with other indicators (RSI, MACD, Order Flow)
🚀 Why Use This Indicator?
• Filters out noise from lower timeframe EMAs
• Confirms trend direction using key moving averages
• Helps avoid false breakouts by identifying strong institutional levels
This is a must-have tool for traders who rely on higher timeframe confluence for scalping, options trading, or swing trading. 📈🔥

KJS-- Gost Pivot MAKJS Ghost Pivot Moving Average
This indicator calculates a "Ghost Pivot" by estimating where the monthly pivot level would be if the current candle's close represented the end of the month. The calculation uses:
• The current month's high and low from regular trading hours (RTH).
• The current candle's close, which includes both premarket and after-hours data.
It also smooths the ghost pivot using a customizable simple moving average (SMA).
Features:
• Plots the current month's high (blue) and low (yellow) based on RTH data.
• Calculates and plots a dynamic pivot (purple line) as the average of the monthly high, low, and current close (HLC3).
• Includes a customizable SMA length for smoother pivot tracking (default: 3).
This indicator helps traders anticipate potential monthly pivot levels in real-time while visualizing key support and resistance areas.
ATR Range Pivot LinesDescription:
This Pine Script calculates and plots pivot lines based on ATR (Average True Range) value and closing price. It uses the previous trading day's ATR value to set static pivot levels for the current trading day. These pivot lines help traders identify potential support and resistance levels based on historical volatility. The script includes two main pivot lines—ATR High and ATR Low —and two midpoint lines between them for additional context. Labels are added to show the exact pivot values, with options to customize label positions.
Intended Use:
The script is designed to help traders forecast potential price ranges for the current trading day based on the previous day’s volatility. By adding and subtracting the previous day's ATR from the prior close, the script identifies key levels where price action may encounter support or resistance. It is useful for setting realistic price targets or entry/exit points. Since the ATR-based pivot lines are static for the entire day, they provide a reliable range for intraday trading strategies.
Disclosure:
This script was generated using AI. It is recommended to review and test the script thoroughly before applying it in live trading scenarios.
