Renko scalp (buy/sell) indicatorThis script is based on some variations of Rocket (from Until1Mil group) scalping strategies.
It uses Renko to determine buy/sell areas.
More details can be found on my steemit page (same user as here).
在脚本中搜索"scalp"


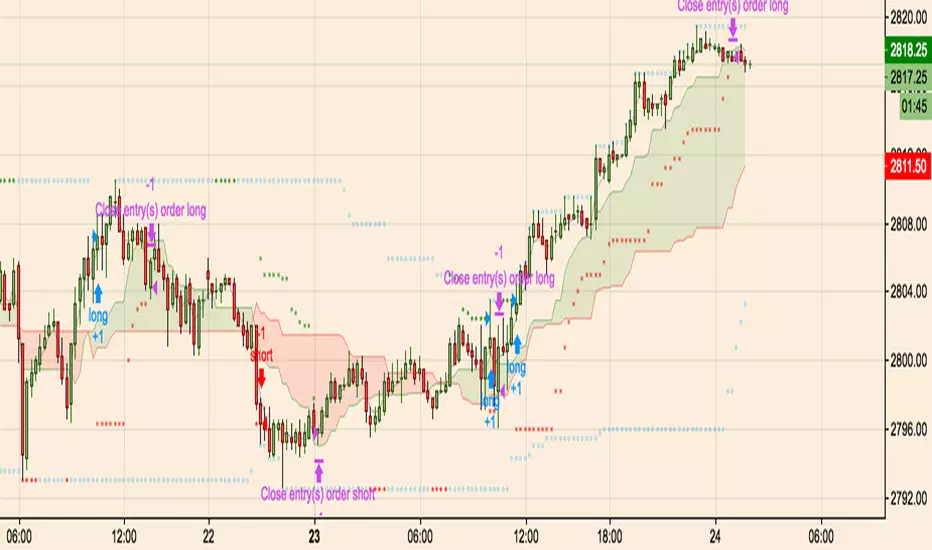
Breakout Scalperfirst draft of a breakout scalper which uses a fast and slow window
sets up some entry stops and then a trailing exit stop. performs a manual close when going sideways.
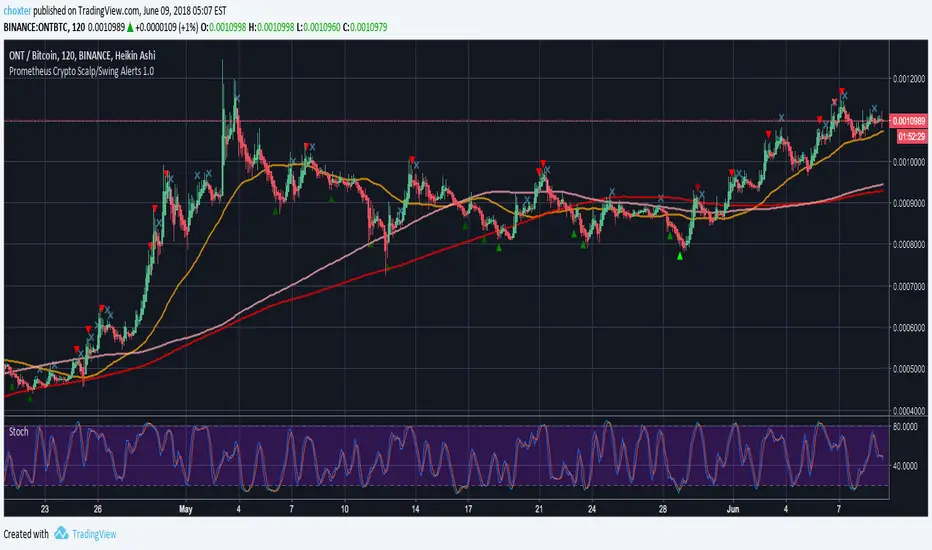
Prometheus Crypto Scalp/Swing Alerts 1.0Prometheus Crypto Scalp/Swing Alerts was built for scalp/swing crypto traders but you probably got that figured out by yourself. It offers high quality entries and exits which can be manually adjusted to suit your trading style. It performs great on any timeframe but scalp traders will love it for it’s ability to offer many entry points followed by quick exits, giving you opportunity to earn a few % within a few hours.
It has built in BUY/SELL alerts that can be connected to Autoview for automated trading.
How it works?
No drama, no complicated numbers - you only need to set the Alert strength indicator value (5-50) and according to that you will get the kind of alerts you like most. Choosing higher quality alerts will result in smaller quantity of those while picking out just the best entry and exit points and removing less interesting ones. You can always experiment and see what suits your trading style best.
Did we get your attention? If you wish to buy our script, shoot us a PM.
Lazy Monies Bitcoin Scalper PublicIf you are a Mod seeing this as a duplicate script please take down my other one instead of this one. This is the same script as "Lazy Monies Bitcoin Scalper" on my account, however this is set to protected instead of invite only which I set the last one by mistake.
An edit of my previous script "1h gold lazy monies" so that it can be applied to 5m bitcoin charts. Unfortunately the time scale that it can be back tested for is quite short so it only manages to test 40 trades, so I would be a little cautious trading using this under very different market conditions. The fact that Bitcoin is largely traded emotionally by stoners and flat earthers from their mothers basement makes it easier to be a parasite off those tiny swings. Average trade length is about 9 hours but that is because trades that have the ability to catch larger moves stay open longer, most trades are designed for shorter time frames. It is able to make profit through up and down trends. DO NOT trade this strategy through CFDs because the spread will eat up all your profit.

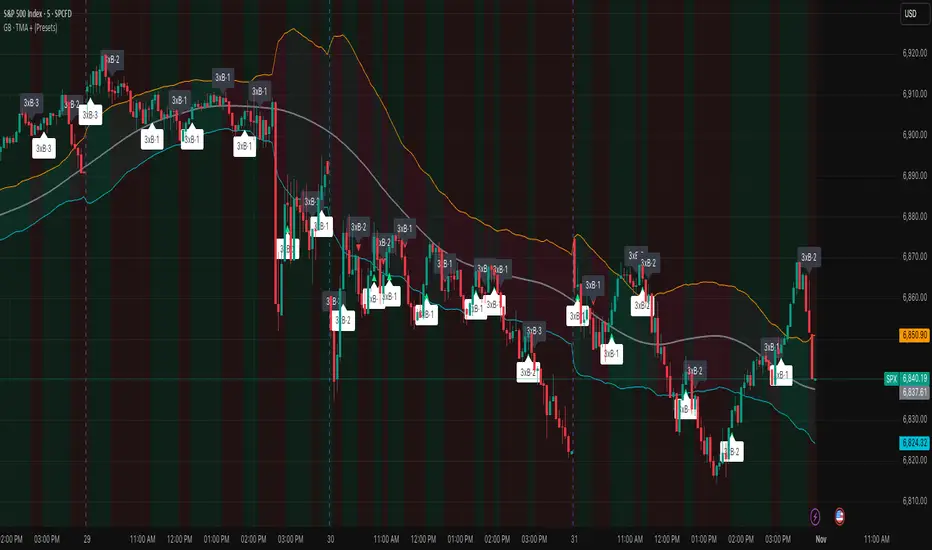
Grizzly Brahman · PRO SCALPERGrizzly Brahman TMAX 4 is a fourth-generation Trend-Momentum-Adaptive Crossover system built to identify true intraday direction and volatility alignment before price acceleration begins.
It combines adaptive moving-average bands, momentum filtration, and trend-fill logic to produce crystal-clear long/short zones directly on the chart.
Preset Modes
“Aggressive / Balanced / Disciplined” presets optimize responsiveness for scalping, intra-day, or swing conditions.
Session Shading & ORB Levels
Optional overlays for Opening Range Breakout, Pre-Market High/Low, and Previous Day High/Low to frame liquidity targets.
Heikin Ashi Compatibility
Optimized to read momentum flow cleanly on Heikin Ashi charts for false-breakout filtering.
Momentum Bands
Adaptive outer bands act as over-extension or “take-profit” zones — similar to ATR channels but smoothed for consistency.
How to Use
Identify Trend Zone — watch for color fill change and TMA alignment.
Enter on Marker Confirmation — green triangle = long momentum confirm, red triangle = short.
Manage Risk around outer TMA/ATR band touches or when color intensity fades.
Combine with GB Set-Up & Confirmation (lower pane) for dual-signal entry validation.
Sideways Scalper Peak and BottomUnderstanding the Indicator
This indicator is designed to identify potential peaks (tops) and bottoms (bottoms) within a market, which can be particularly useful in a sideways or range-bound market where price oscillates between support and resistance levels without a clear trend. Here's how it works:
RSI (Relative Strength Index): Measures the speed and change of price movements to identify overbought (above 70) and oversold (below 30) conditions. In a sideways market, RSI can help signal when the price might be due for a reversal within its range.
Moving Averages (MAs): The Fast MA and Slow MA provide a sense of the short-term and longer-term average price movements. In a sideways market, these can help confirm if the price is at the upper or lower extremes of its range.
Volume Spike: Looks for significant increases in trading volume, which might indicate a stronger move or a potential reversal point when combined with other conditions.
Divergence: RSI divergence occurs when the price makes a new high or low, but the RSI does not, suggesting momentum is weakening, which can be a precursor to a reversal.
How to Use in a Sideways Market
Identify the Range: First, visually identify the upper resistance and lower support levels of the sideways market on your chart. This indicator can help you spot these levels more precisely by signaling potential peaks and bottoms.
Peak Signal :
When to Look: When the price approaches the upper part of the range.
Conditions: The indicator will give a 'Peak' signal when:
RSI is over 70, indicating overbought conditions.
There's bearish divergence (price makes a higher high, but RSI doesn't).
Volume spikes, suggesting strong selling interest.
Price is above both Fast MA and Slow MA, indicating it's at a potentially high point in the range.
Action: This signal suggests that the price might be at or near the top of its range and could reverse downwards. A trader might consider selling or shorting here, expecting the price to move towards the lower part of the range.
Bottom Signal:
When to Look: When the price approaches the lower part of the range.
Conditions: The indicator will give a 'Bottom' signal when:
RSI is below 30, indicating oversold conditions.
There's bullish divergence (price makes a lower low, but RSI doesn't).
Volume spikes, suggesting strong buying interest.
Price is below both Fast MA and Slow MA, indicating it's at a potentially low point in the range.
Action: This signal suggests that the price might be at or near the bottom of its range and could reverse upwards. A trader might consider buying here, expecting the price to move towards the upper part of the range.
Confirmation: In a sideways market, false signals can occur due to the lack of a strong trend. Always look for confirmation:
Volume Confirmation: A significant volume spike can add confidence to the signal.
Price Action: Look for price action like candlestick patterns (e.g., doji, engulfing patterns) that confirm the reversal.
Time Frame: Consider using this indicator on multiple time frames. A signal on a shorter time frame (like 15m or 1h) might be confirmed by similar conditions on a longer time frame (4h or daily).
Risk Management: Since this is designed for scalping in a sideways market:
Set Tight Stop-Losses: Due to the quick nature of reversals in range-bound markets, place stop-losses close to your entry to minimize loss.
Take Profit Levels: Set profit targets near the opposite end of the range or use a trailing stop to capture as much of the move as possible before it reverses again.
Practice: Before trading with real money, practice with this indicator on historical data or in a paper trading environment to understand how it behaves in different sideways market scenarios.
Key Points for New Traders
Patience: Wait for all conditions to align before taking a trade. Sideways markets require patience as the price might hover around these levels for a while.
Not All Signals Are Equal: Sometimes, even with all conditions met, the market might not reverse immediately. Look for additional context or confirmation.
Continuous Learning: Understand that this indicator, like any tool, isn't foolproof. Learn from each trade, whether it's a win or a loss, and adjust your strategy accordingly.
By following these guidelines

Soheil PKO's 5 min Hitman Scalp - 3MA + Laguerre RSI + ADX [Pt]Someone sent me this strategy found on YouTube. It is Soheil PKO's "The Best and Most Profitable Scalping Strategy" Best way to find out is to code it =)
This strategy uses Moving Average Ribbon, Laguerre RSI, and ADX. This script only displays the MA ribbon, you will need to add Laguerre RSI and ADX separately.
Long Entry Criteria:
- 16 EMA > 48 EMA > 200 SMA
- Laguerre RSI > 80
- ADX > 20
Long Exit Criterion:
- 16 EMA < 48 EMA
Short Entry Criteria:
- 16 EMA < 48 EMA < 200 SMA
- Laguerre RSI < 20
- ADX > 20
Short Exit Criterion:
- 16 EMA > 48 EMA
As mentioned in the video, risk management is very important, especially for scalping strategies. Therefore, I've added option for setting Stop Loss and Price Target in the options for you guys to play with.
All parameters are configurable.
Enjoy~~

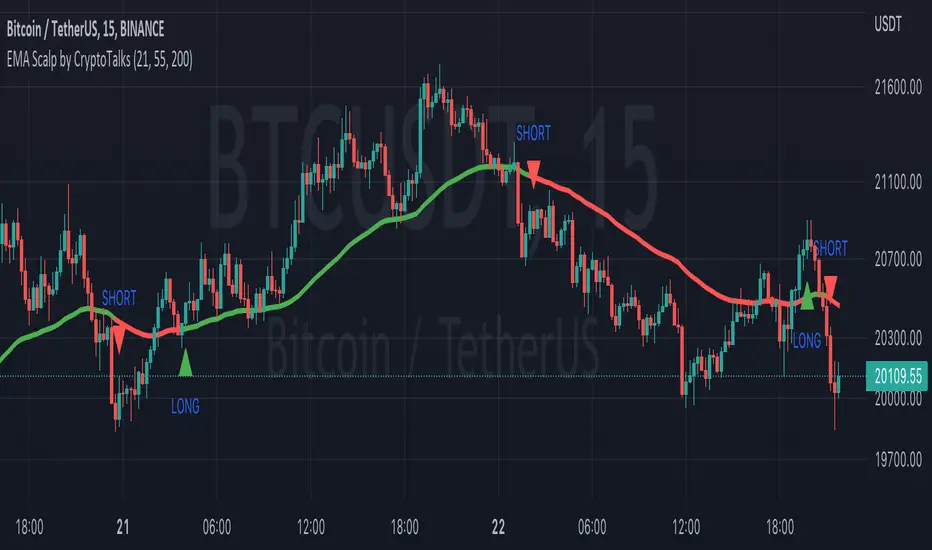
EMA Scalp by CryptoTalksEMA Scalp by Crypto Talks
EMA Scalp by Crypto Talks can be used Using Small Time Frame we Can use it in a better way and on every crossover of Two Moving Averages we can identify the trend for next 15-20 Mins. If you want to use the same for Large time frame even that is possible but you need to hold the call.
Two Different Signals are provided depending on the movement of Moving Averages Long and Short.
There are three Moving Averages used one is 21MA, Second is 55MA and Third one is 200MA where 21 & 55 decides the Market Trend and the third one 200 which confirms the trend and by using these three it makes this indicator Unique.
Thank you
*************
Budhil Vyas
Crypto Talks
(Data Scientist)
Rolling VWAP - Vhunt Scalper botBINANCE:ADAUSDTPERP
Modified VWAP to use scalping in lower timeframe.
Use 1minute TF for best results but can also use up to 30min.
This indicator is made for crypto but may also work for other assets.
The bands serve as support and resistance and used for opening quick profit position if conditions below are met:
Indicators:
Blue - modified rolling vwap
Orange - Band1
Green - Band2
Opening position Conditions:
Long:
Band2 < Band1
Price < Band2
Short:
Band2 > Band1
Price > Band2

Top Scalping Indicator with Trend & S/RINTRODUCTION
---------------------
Welcome Traders, this is a custom indicator created specifically for scalping stocks, commodities, currencies, and cryptos where there is usually high volatility and momentum. This indicator is a fusion of three specially coded indicators.
1) Custom Dynamic Trend Line
2) Custom Buy and Sell signals
3) Support and Resistance lines
The trendline and the buy/sell scalp signals are based on RSI, MACD, Stochastics values, and the past volume of the security. There is also an ATR inbuilt which allows you to ride the trend. All values can be tweaked according to your trading style. After choosing the desired values, a trendline and buy/sell signals will be generated providing you with various trading opportunities.
Finally, the S/R levels help you to take better confluence trades.
HOW TO USE THIS INDICATOR
-------------------------------------
To make the most of this indicator, deploy it on your chart, wait for a buy signal when the candlestick breaks the trend line from below and take a trade after it closes above the trendline, with previous candles low as to stop loss. Similarly, take a short when the candle cuts the trendline from above and closes below. Maintain a 1:1 or 1:2 risk to reward ratio for net positive results over time. My suggested time frame for trading is 3m, 5m, and 15m, but it may be used on higher time frames as well depending on your strategy and trading style.
The above strategy is just a suggestion from personal experience. As this indicator is a confluence indicator that takes into account various technical values, it is best to back-test this strategy or create your own through the tools provided in this indicator.
Happy Trading!!

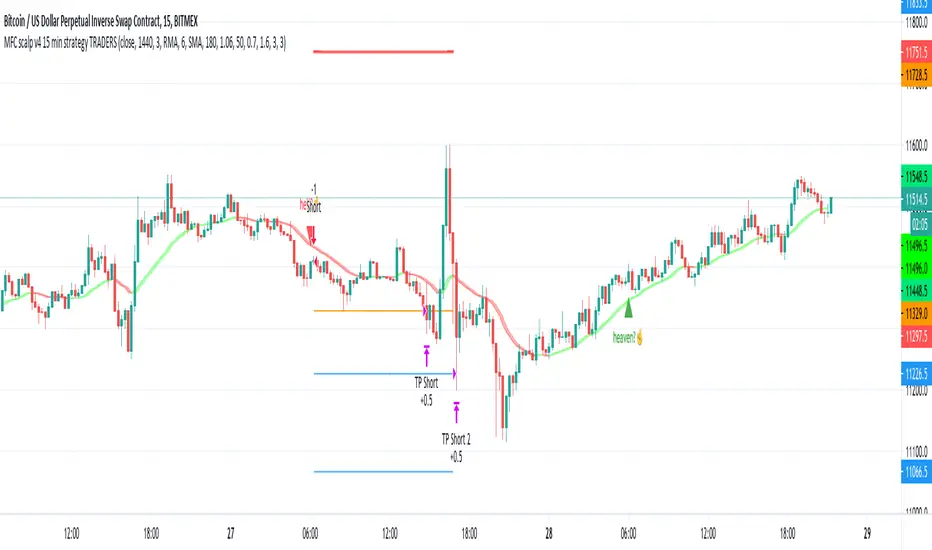
MFC scalp v4 15 min strategy TRADERSthis indicator to trade for a short time in a TF of 15 minutes.
We have created takeprofit zones for you so that you can understand where we can get to and take your profit. these points are mostly very helpful.
There are basic settings that allow you to adjust the indicator individually for each situation; because of this, this indicator can be used for any exchange and any currency pair.
For Scalp trading, we use 4 different strategies available to our clients. If you enter them correctly, you can never see the minus sign.
Use the link below to obtain access to this indicator.
Profit Sniper 2.0 Visual Scalper CompanionProfit Sniper companion indicator for scalping, derived from standard Chande Momentum that can be changed to display Heiken-Ashi Chande while Japanese candles are displayed on the screen.
To be used as a visual tool alongside "Profit Sniper 2.0" Indicator to allow you to clearly and easily verify Heiken-Ashi Chande Momentum precise position and general trend at the time a "Sight" label is painted onto your chart from the main "Profit Sniper 2.0" Indicator.
We'll be adding further indicators in the near future to match legacy Profit Sniper.

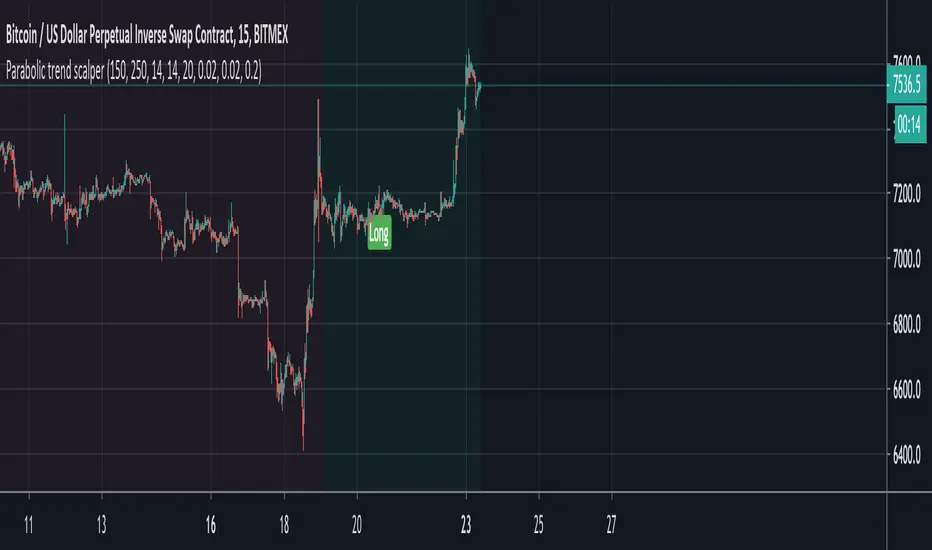
Parabolic trend scalperThis is based on a well known 5 min forex scalping strategy that analyses the general trend and goes long/short in that direction. Trades are filtered against a number of fundamentals to minimise the chances of weak signals.
Dark green = Upward trend
Light green = Long signal
Dark red = Downward trend
Light red = Short signal
Alerts are built in and should be set to 'once per candle' if trading with a bot. Ensure that your setup ignores alerts for positions already open in the same direction.
Extreme ScalpingThis is a test of an easy scalping method: buy if actual close is below forecast close and sell if actual close is above forecast close. Take profit and stop loss shall be very small (few pips) as in most of scalping strategies.
No filter is used for only long or only short positions, but you can select buy only or sell only based on other indicators or whatever you feel is the direction of trading.
NOTE: you can add this strategy to your chart but you should modify the backtest day otherwise you will get an error due to calculation limits of pine script. For example, on one minute chart, you should set the backtest day from today only. For past days, set both start day and and day.
I have also a study with alarms.
Please use comment section for any feedback.


Hermes Scalping Study by ZekisA simple scalping indicator, based on Highs and Lows.
It's working in any timeframe, the only condition is ... volatility .
Values are already set, but you can change them according to your preferences and to your chart.
Alerts are enabled.
Enjoy!
@ Zekis


Camelback ScalpingThis is a port of Camelback scalping strategy (google it for more info).
It looks profitable in tradingview.
I'm testing it also with MT4 and next step will be jforex testing.
If you are interested in ex4 file for metatrader let me know through comment section.
Thanks for your feedbaks.
PS: note that this strategy works well at higher time frames too.

No-Lag MA Crossover ScalperThe No Lag Crossover Scalper aims to capitalize on short-term trends using a combination of Hull Moving Average (HMA) for trend detection and multiple indicators for generating buy and sell signals. Here’s an overview of its components and approach:
1. Trend Detection with Hull Moving Averages (HMA) :
- Dual Hull MA Setup : Uses two Hull Moving Averages (HMA) to detect crossovers and crossunders, which are signals of short-term trend changes.
- No Lag Nature : HMAs are chosen for their ability to reduce lag compared to traditional moving averages, providing quicker responses to price movements.
2. Indicators for Signal Generation :
- Relative Strength Index (RSI) : Detects overbought and oversold conditions, generating signals when price movements diverge from RSI readings.
- Moving Average Convergence Divergence (MACD) : Provides signals based on the convergence and divergence of two moving averages, indicating potential trend reversals.
- Stochastic Oscillator (Stoch) : Identifies momentum shifts by comparing the current closing price to its range over a specific period.
- On-Balance Volume (OBV) : Measures buying and selling pressure based on volume flow, signaling potential changes in price direction.
- RSI Divergence : Looks for discrepancies between price action and RSI values, suggesting weakening trends and possible reversals.
3. Signal Generation Logic :
- Buy Signals : Generated when both HMAs cross over, supported by bullish indications from RSI, MACD, Stoch, OBV, or RSI divergence. At least 2 indicators must be true to generate a signal.
- Sell Signals : Triggered when HMAs cross under, complemented by bearish signals from the mentioned indicators.
4. Implementation and Optimization :
- Parameter Optimization : Fine-tuning of indicator periods and sensitivity settings to balance signal accuracy and responsiveness.
- Confirmation Mechanisms : Use of multiple indicators to confirm signals, reducing false positives and enhancing reliability.
Overall, the No Lag Crossover Scalper combines the speed of Hull Moving Averages with the reliability of multiple indicators to identify short-term trends effectively. By focusing on no lag indicators and confirming signals with diverse technical tools, it aims to capitalize on rapid market movements while managing risk through disciplined execution.
Credits: used TradingView ta library for a lot of the built-in indicators.
Disclaimer: This is still experimental beta version so use at your own risk.

Parabolic SAR Heikin Ashi MTF Candle ScalperThis is scalper strategy designed around parabolic sar indicator, where as an input candle value it uses the heikinashi from a higher timeframe.
This example has been adapted to SPY/SPX chart
In this case ,we are using a 5 min chart, but the calculations are made on a 15 min heikin ashi chart for the PSAR and then on 5 min chart we plot the results.
At the same time we are conditioning the entry to be base on a time/session for daytrading/scalper mentality
In this case we only enter within the first 30 min of SPY opening session , and then we exit after 3-4 hours of staying in the position ( unless we hit a reverse condition).
For long condition we enter when the mtf ha candle close is above the mtf psar and for short condition we enter when the mtf ha candle close is below the mtf psar
This script is made with an educational purpose to show the power of multiple time frame approach compared to a single chart.
If you have any questions, let me know !
