Inverse BandsThis was the result of quite some time spent examining how much information could be gleamed by studying the interactions between Keltner Channels, STARC Bands and Bollinger Bands. I was surprised by the results.
First of all, there are four fills that are black. Set the transparency of those to 0 and you'll see this indicator the way that it's meant to be seen. Those fills belong to unused sections of the Bollinger Bands.
There are two clouds which represent STARC Bands and the Keltner Channel. There is some delay when they flip from bullish (green) to bearish (red), but they are indicative of the trend. The space between them is black and the narrower that space is, the greater volatility is. Because of this, we don't need the exterior Bollinger Bands.
The Bollinger Bands remain visible as the yellow interior clouds on the top cloud and the blue interior clouds on the bottom cloud. Often, the thicker the yellow or blue cloud is, the less severe a throwback from a given trend reversal will be. Often the thinner that yellow or blue cloud is, the more severe the trend reversal will be. If price is rising into a thin interior yellow cloud, the following dip will be substantial. If price action dips towards a thicker interior blue cloud, often the pump following that dump will be less enthusiastic.
We preserve the Keltner Channel and STARC bands as our cloud because the way that they interact with the three basis lines yields a lot of information.
The yellow Bollinger basis line tells us about trend strength. The closer the BB basis line is to the top of the top cloud or the bottom of the bottom cloud, the stronger the trend is. When it enters the cloud very close to the bottom of the bottom cloud, you know you're looking at a strong pump, and vice versa when it's close to the top of the top cloud.
The purple Keltner Channel basis line and orange STARC Band basis line can forecast short term trend changes one candlestick in advance by contacting any line in either cloud. The moment either basis line touches or crosses any boundary of the clouds, you know that the next candle will change directions. In an uptrend, a touch or cross means the next candle will have a lower high point. In a downtrend, a cross or touch means the next candle will have a higher high point. This is most useful in scalping.
It'd be pretty easy to slap some crossover alerts on to this and useful considering that they come a candle in advance. Feel free to further explore and develop this.
在脚本中搜索"scalping"

Phoenix Ascending 2.201Hi Everyone!
It's time to make this indicator public to relieve myself of replying to requests for access. There has been an update to this indicator; in which a Stochastic RSI was added to this indicator. Please follow the directions to SETUP the indicator in the SETUP VIDEO provided below.
Phoenix Ascending 2.201 and Bollinger Bands Setup Video.
The following are BASIC rules for the Phoenix 2.201 Indicator. More advanced rules and the requirements for those rules can be found in my publications in my public profile. Unfortunately, I do not have organized videos created on how to use this indicator in full but will be available in the future.
IMPORTANT: The BASIC rules below are beneficial but these are NOT all the rules. More rules and requirements for those rules will be available in the future.
RULE NO. 1
We PREFER the Blue LSMA to be at 80% or higher for SAFE EXIT (SHORT) bets.
We PREFER the Blue LSMA to be at 20% or lower for SAFE ENTRY (LONG) bets.
Rule No. 2
ANY time the red line is approaching a green line that’s moving UPWARD,
Be prepared to make an ENTRY (LONG) when the red line is about to touch the green line that’s moving upward.
One can look at a lower time frame to get a better idea of how much longer you may have
To wait for the red line to touch the green line. In many cases, you may make ENTRY (LONG)
Just before the red line actually touches the green line that’s moving up in that higher time frame
You were initially using as your COMPASS. I currently have the 1-Month TF as a compass for EURUSD.
Rule No. 3
ANY time the red line is approaching a green line that’s moving DOWNWARD,
Be prepared to make an EXIT (SHORT) when the red line is about to touch the green line that’s moving downward.
One can look at a lower time frame to get a better idea of how much longer you may have
To wait for the red line to touch the green line. In many cases, you may make your EXIT (SHORT)
Just before the red line actually touches the green line that’s moving downward in that higher time frame
You were initially using as your COMPASS. I currently have the 1-Month TF as a compass for EURUSD.
Rule No. 4
The Green Line and/or Ghost Line can often help one determine when an upward or downward move in a particular time frame
Is nearly exhausted and about to reverse.
Example for Upside Exhaustion about to reverse to the Downside:
When the Green Line and/or Ghost line is at 80% level or higher, this is a good indicator to inform
Us the current upside move may be approaching exhaustion. You can look at a higher time frame to try to gain
More insight as to whether this will only be a brief dip down in the lower time frame IF the higher time frame you
Went to reveals there is a lot more room remaining for the Green and/or Ghost Lines to reach the 80% or higher level.
Example for Downside Exhaustion about to reverse to the Upside:
When the Green Line and/or Ghost line is at 20% level or lower, this is a good indicator to inform
Us the current downside move may be approaching exhaustion. You can look at a higher time frame to try to gain
More insight as to whether this will only be a brief dip up in the lower time frame IF the higher time frame you
Went to reveals there is a lot more room remaining for the Green and/or Ghost Lines to reach the 20% or lower level.
Rule No. 5
The same rules you see in Rule No. 4 also apply to the Stochastic RSI. Keep in mind I changed the colors of the
Stochastic RSI to the following: Red default changed to Purple and Blue changed changed to Black to avoid confusing
Them with the lines in Godmode.
When the Stochastic RSI is at 80% or higher level, we need to be on guard for a reversal to the downside.
When the Stochastic RSI is at 20% or lower level, we need to be on guard for a reversal to the upside.
EXTREMELY IMPORTANT to apply these rules in GROUPS OF TIME FRAMES.
"TYPES" OF TIME FRAME GROUP TRADING SIGNALS
Scalping Group Signals: Signals provided for this group involve analyzing the following two groups of time frames. Short Term Group as a compass and Scalping Group for confirmation and more precise entry/exit.
Scalping Group: 6min. 12min. 23min & 45min.
Short Term Group: 90min. 3hr. 6hr. & 12hr.
Short Term Group Signals: Signals provided for this group involve analyzing the following two groups of time frames. NearTerm Group as a compass and Short Term Group for confirmation and more precise entry/exit.
Short Term Group: 90min. 3hr. 6hr. & 12hr.
Near Term Group: 24hr. 2-Day, 3-Day & 4-Day
Near Term Group Signals: Signals provided for this group involve analyzing the following two groups of time frames. Mid Term Group as a compass and Near Term Group for confirmation and more precise entry/exit.
Near Term Group: 24hr. 2-Day, 3-Day & 4-Day
Mid Term Group: 3-Day, 6-Day, 9-Day & 12-Day
Mid Term Group Signals: Signals provided for this group involve analyzing the following two groups of time frames. Long Term Group as a compass and Mid Term Group for confirmation and more precise entry/exit.
Mid Term Group: 3-Day, 6-Day, 9-Day & 12-Day
Long Term Group: 1-Week, 2-Week, 3-Week & 4-Week
Long Term Group Signals: Signals provided for this group involve analyzing the following two groups of time frames. Macro Term Group as a compass and Long Term Group for confirmation and more precise entry/exit.
Long Term Group: 1-Week, 2-Week, 3-Week & 4-Week
Macro Term Group: 1-Month, 2-Month, 3-Month & 4-Month
Macro Term Group Signals: Signals provided for this group involve analyzing the following two groups of time frames. Macro Term Group as a compass and Long Term Group for confirmation and more precise entry/exit.
Macro Term Group: 1-Month, 2-Month, 3-Month & 4-Month
Super Macro Group: 3-Month , 6-Month, 12-Month & 24-Month

Trend Risk Indicator (TRI)The Trend Risk Indicator is a simple bands indicator made of 2 custom averages of candlesticks ranges calculated within the variable “ BandBars ” period.
Upper and lower channel bands width can be adjusted with the “ Deviation ” variable, which act as a simple factor to enlarge the spread between them.
When Close crosses over the upper band, it is a bearish signal and candlesticks are painted in Red.
When Close crosses under the lower band, it’s a bullish signal and candlesticks are painted in Green.
One of the most interesting indicators for 1 minute scalping. Recommended to use on Renko bars.
*drag to chart and pin to scale, also remove borders from candlesticks.

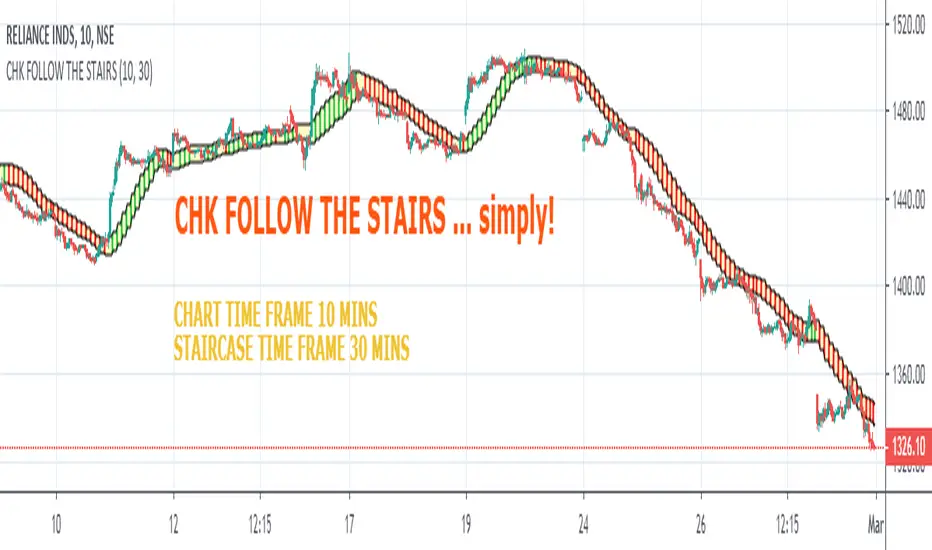
CHK FOLLOW THE STAIRSCHK FOLLOW THE STAIRS....
The stairs are nothing but HIGH LOW CHANNEL at HTF or LTF
I observed 10 Period Moving Average an optimum length for the Staircase
you can change it to 8 or 13, one will generate noise, other will generate lag
Tinker with the Staircase Time Frame to get an optimum fit
The script also shows Strength of the Trend.
If there is a gap between the price and the stairs, that is relection of the strength
The script can also be used for scalping.
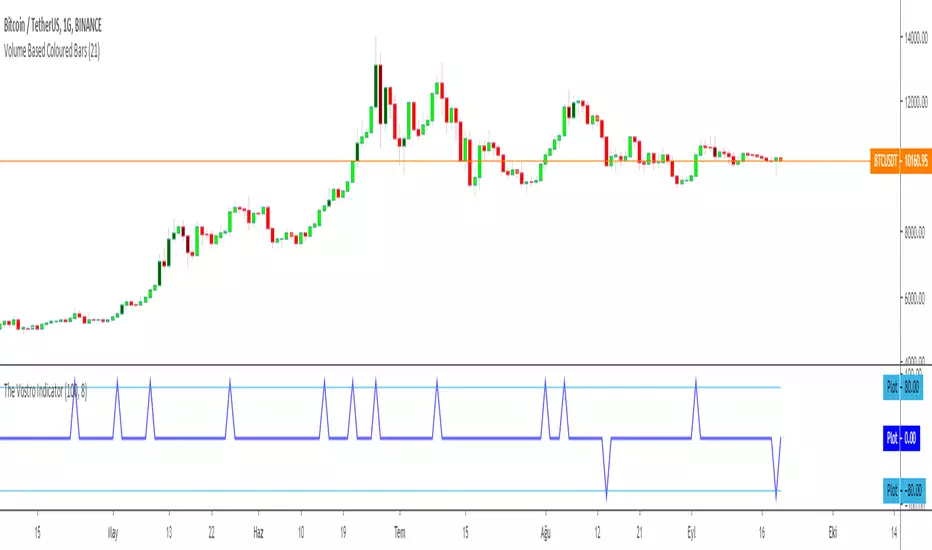
The Vostro Indicator by KIVANÇ fr3762The VOSTRO indicator is a trend indicator that automatically provides buying and selling signals. The indicator marks in a window the potential turning points. The indicator is recommended for scalping.
The Vostro indicator determines the overbought zones (value greater than +80) and the oversold zones (less than the -80 level)
BUY signal: The Vostro curve moves below the -80 level and forms a trough – Turnaround of the upward trend
SELL signal: The Vostro curve moves above the +80 level and forms a peak – Downward trend
further info:
www.prorealcode.com
Here's the link to a complete list of all my indicators:
t.co
Yazar: KıvanÇ @fr3762 twitter
Şimdiye kadar paylaştığım indikatörlerin tam listesi için: t.co
Relative Vigor IndexHere we are looking at a trend strength indicator based on the Relative Vigor Index(RVI). The RVI measures trend strength by comparing the open-close and high-low ranges for the current and three most recent periods. As a zero-centered oscillator, the RVI oscillates above and below zero to signal the strength of the trend.
As there are different ways to interpret the RVI, we have included 3 different modes for traders to choose from in the input option menu:
1. Zero-Crossing:
The RVI Histogram will turn green when it crosses above zero and red when it crosses below. Therefore, a green RVI means the trend is bullish and red means bearish. This mode is better for longer-term swing trading in comparison to the other 2 modes.
2. Increasing / Decreasing:
The RVI histogram will turn green when it is increasing(rvi >= rvi ) and red when it is decreasing. A green RVI is viewed as a bullish signal and red means bearish. This mode is a good middle-ground between the Zero-Crossing and Signal Comparison modes.
3. Signal Comparison:
Here, the RVI is compared to its signal line. If the RVI is greater than its signal line, the histogram is green, indicating a bullish trend, while red means bearish. This mode is preferred for scalping.
Hope everyone finds this one useful!
You can check out our other invite only studies/strategies at our website: profitprogrammers.com

Key Levels [@treypeng]Draws horizontal lines for Daily, Hourly (1) and Weekly levels. Really handy to switch on quickly when scalping.
Light blue: Previous hour OHLC
Thick light blue: Previous hour Close / current hour Open
Dark blue: Yesterday OHLC
Thick dark blue: Yesterday Close / today Open
Purple: Weekly Open
It's a bit ugly, I'd prefer horizontal rays instead of lines stretching back across the chart but I couldn't figure out how to do this in PineScript. If I get it sorted, I'll publish an update.

Adjustable Fibonacci LevelsThe Adjustable Fibonacci Levels script allows you to retrieve Fibonacci levels for x days back. This might come in handy when scalping. Shoutout to u/Autemox for the inspiration!

SHERRIFx (variation) IN TRENDI share this script where I made some modifications to the SHERRIF strategy to perform trend scalping.
I use:
- Bollinguer Bands (20)
- CCIs (14 and 40)
- EMAS (20, 57, 100, 200)
- Stochastics (13,3,3) in 70, 30.
I apply in low temporalities, especially M15 and M1, it can also be used to make binaries or in higher temporalities by modifying the constants.
If you improve this program, share it.
Greetings.

Two Bar Break Line Alerts R1.0 by JustUncleLThis indicator with default settings is designed for BINARY OPTIONS trading. The indicator can also be used for Forex trading with some setting changes. The script shows Two Bar Pullback Break lines and alerts when those Break lines are Touched (broken) creating a short term momentum entry condition.
For a Bullish Break (Green Up Arrow) to occur: first must have two (or three) consecutive bear (red) candles which is followed by a bull (green) candle creating a pivot point. The breakout occurs then the High of the current Bull (green) exceeds the highest point of the previous two (or three) pivotal bear candles. The green channel Line shows where the current Bullish BreakOut occurs.
For a Bearish Break (Red Down Arrow) to occur: first must have two (or three) consecutive bull (green) candles which is followed by a bear (red) candle creating a pivot point. The breakout occurs when the Low of the current Bear (red) drops below the lowest point of the previous two (or three) pivotal Bull candles. The red channel Line shows where the current Bearish BreakOut occurs.
The break Line Arrows can optionally be filtered by the Coloured MA (enabled by default), a longer term directional MA (disabled by default) and/or a MACD condition (enabled by default) as a momentum filter.
You can optionally select three Bar break lines instead of two. The three bar break lines are actually equivalent to Guppy's Three Bar Count Back Line method for trade entries (see Guppy's video reference below).
Included in this indicator is an ability to display some basic Binary Option statistics, when enabled (enabled by default) it shows Successful Bars in Yellow and failed Bars in Black and the last Nine numbers on the script title line represent the Binary option Statistics in order:
%ITM rate
Total orders
Successful Orders
Failed Orders
Total candles tested
Candles per Day
Trades per Day
Max Consecutive Wins
Max Consecutive Losses
You can start the Binary Option statistics from a specific Date, which is handy for checking more recent history.
HINTS:
BINARY OPTIONS trading: use 5min, 15m, 1hr or even Daily charts. Trade after the price touches one of the Breakout lines and the Arrow first appears. Wait for the price to come back from Break Line by 1 or 2 pips, the alert arrow must stay on and candle change to black, then take Binary trade expiry End of Candle. If price pull back and arrow turns off, don't trade this candle, move on you probably don't have momentum, there will be plenty of other trigger events. The backtesting results are good with ITM rates 65% to 72% on many currency pairs, commodities and indices. Realtime trading has confirmed the backtesting results and they could even be bettered, provided you are selective on which signals to trade (strong MACD support etc), that you are patient and disciplined to this trading method.
FOREX trading: the default settings should work with scalping. For longer term trades try with settings change to a more standard MACD filter or slower to catch the longer term momentum swings and the idea would be to trade the first Break Line alert that occurs after a decent Pullback in the direction of the trend. Setting the SL to just above/below the Pivot High/Low and set target to two or three times SL.
References:
"Fundamentals of Price Action Trading for Forex, Stocks, Options and Futures" video:
www.youtube.com
Other videos by "basecamptrading" on Naked Trading.
"Taking Profits in Today's Market by Daryl Guppy" video:
www.youtube.com

NG [Multi-Stochastics]Multiple stochastic script with trend direction.
* Each base shows 3 lines multiplied by 1.618
* Possible to chose how to calculate MA of stochastics SMA, EMA, DEMA, TEMA.
* Possible to chose how to calculate trend.
* Trend adjustment is to adapt to current situation not for signals
Fast stochastics gives a lot of noise but some times good for scalping.

Pivot Boss 4 EMA Summary:
Creates one indicator with four exponential moving averages based off the central pivot point
which assists you in trading pure price action using floor pivots.
This also helps you to avoid getting chopped up during price confluence.
How to use:
When T-Line cross Green Short EMA it can be used for scalping.
When Short EMA pulls back to Medium EMA you can buy more or sell more
without having to exit your position prematurely before trend direction changes.
This can also be used as position entry points to make sure you are getting the best possible price.
When T-Line, Short EMA and Medium EMA cross over Long EMA you go long or short.

EMA Market Regime & Real-Time Candle Projection System📌 EMA Market Regime & Real-Time Candle Projection System
EMA Market Regime & Parabolic Projection is a real-time market structure system designed to anticipate candle behavior before it fully forms, by dynamically projecting price levels based on trend strength, acceleration, and market expansion.
Unlike traditional indicators that react after the candle closes, this system continuously adapts to live price data to provide early insight into bullish, bearish, parabolic, and exhaustion phases.
🔍 Core Concept
The system operates on four key dimensions:
Market Structure
Uses a fast and a slow EMA to determine the dominant market regime (bullish or bearish).
Directional Momentum
Measures EMA slope to confirm directional commitment.
Acceleration & Parabolic Detection
Identifies true parabolic movements through acceleration analysis, filtering out weak or range-bound price action.
Expansion Validation
Confirms that movements are supported by genuine market expansion, reducing false signals.
By combining these elements, the indicator projects a dynamic price level in real time, effectively drawing a forward-looking guide that adapts as each candle evolves.
🧠 Real-Time Candle Projection
The projected line represents a dynamic equilibrium level derived from EMA structure and acceleration.
This allows traders to:
Anticipate continuation vs exhaustion
Visualize momentum shifts before candle close
Read potential candle direction and strength in real time
The projection is non-repainting and updates tick-by-tick during the candle’s formation.
🎯 Market Regime Classification
The system automatically classifies the market into distinct states:
Bullish Trend – Positive structure with controlled momentum
Bearish Trend – Negative structure with controlled momentum
Parabolic Expansion – Accelerated trend with strong continuation potential
Parabolic Exhaustion – Loss of acceleration signaling potential reversal or pullback
Neutral / Range – Low momentum and low expansion (no-trade zone)
Each state is visually encoded using subtle, professional coloring, ensuring price candles always remain the primary focus.
🛡️ Professional-Grade Filters
Anti-range and anti-fake breakout filtering
Cooldown logic to prevent repetitive signals
Slope normalization relative to volatility
Designed to remain readable on M1–M5 scalping and higher timeframes
⚙️ Designed For
Scalping & Intraday Trading
Real-time decision-making
Trend continuation & exhaustion timing
Prop-firm and professional trading environments
This system is intended as a market structure and timing tool, not a signal spam indicator.
⚠️ Disclaimer
This indicator does not predict the future and does not provide guaranteed results. It is designed to assist discretionary traders by improving real-time market reading and execution timing.

Ichimoku + VWAP + OBV + ATR Full System (NQ Daytrade)This script provides optimized scalping signals for BTC, designed mainly for the 15-minute timeframe.
Long/short entries are generated using VWAP band position and trend confirmation logic.
OBV momentum is used as a secondary filter to validate breakout or reversal conditions.
Exit signals are displayed when volatility compression or mean-reversion conditions occur.
Simple visual markers (triangles and circles) are included for easy decision-making.
롱/숏 삼각형 시그널
동그라미 청산 시그널
VWAP 밴드 기반 방향성
OBV 보조지표
이름 (Name)
BTC Scalping Signal – VWAP + OBV
짧은 설명 (Short Description)
VWAP 밴드와 OBV를 기반으로 방향성, 진입·청산 시그널을 제공하는 스캘핑 지표입니다.
긴 설명 (Long Description)
이 지표는 BTC 단기 스캘핑을 위해 설계된 것으로, 특히 15분봉 환경에 최적화되어 있습니다.
VWAP 밴드의 위치와 추세 판별 로직을 기반으로 롱·숏 진입 신호를 제공합니다.
OBV 모멘텀을 보조 필터로 사용하여 돌파 및 되돌림 가능성을 판단합니다.
시장 변동성이 축소되거나 평균회귀 신호가 감지될 때 청산 시그널을 표시합니다.
삼각형(진입), 원형(청산) 등 직관적 시각 요소를 통해 빠른 의사결정을 지원합니다.

Exhaustion IndicatorThe ScalpSQZ indicator is designed to identify four critical market states using volatility structure, momentum behavior, and exhaustion conditions. It enhances scalping precision by visually marking transitions between consolidation, squeeze conditions, and momentum reversals through color-coded candles.
1. Squeeze Conditions (Orange Candles)
Orange candles highlight volatility compression, detected when Bollinger Bands contract inside the Keltner Channels. This structure signals that market volatility is tightening and a significant expansion move is likely to follow. The squeeze represents a pre-breakout environment and serves as the earliest warning of a potential directional shift.
2. Consolidation Conditions (Yellow Candles)
Yellow candles identify phases of low directional momentum. These conditions occur when RSI remains near neutral values, MACD histogram activity is minimal, and the Rate of Change stays muted. This combination indicates that the market is balanced and non-trending, often preceding a volatility spike or a new trend. Consolidation helps traders avoid low-probability entries during indecisive price action.
3. Momentum Exhaustion — Overbought Fade (White Candles)
White candles signal potential top-side exhaustion. This occurs when RSI enters overbought territory while the MACD histogram begins to weaken compared to the previous bar. This condition does not necessarily call a reversal but warns that bullish momentum is deteriorating and upside continuation may be limited. It is particularly useful for identifying trend fatigue and tightening stop-loss placement.
4. Momentum Exhaustion — Oversold Fade (Purple Candles)
Purple candles identify bottom-side exhaustion and appear when RSI reaches oversold levels, MACD momentum begins improving, and the current close shows buyer defense relative to the previous low. This condition suggests selling pressure is diminishing and a potential reversal or relief bounce may be forming. Purple candles serve as an early indication of bearish trend exhaustion.
Color Priority System
The indicator follows a fixed hierarchy to ensure clarity:
Squeeze (orange) has the highest priority, followed by consolidation (yellow). Exhaustion signals (white for tops, purple for bottoms) apply only when no squeeze or consolidation conditions are active. This structure ensures that the most critical market states are always highlighted first.
Purpose and Application
ScalpSQZ helps traders identify optimal environments for breakouts, anticipate trend exhaustion, and avoid low-quality trades during choppy or low-momentum conditions. It is suitable for scalping, day trading, and swing trading across any asset class or timeframe.

XAU Micro ScalperThis indicator is designed for short-term price rotation detection on XAUUSD, especially on the 1-minute timeframe.
It combines three momentum components—Stochastic, RSI, and OBV slope—to highlight potential reversal points and short-term scalping opportunities.
Core Logic
The script generates a signal only when multiple conditions align:
1. Stochastic Reversal (Timing Component)
A basic long/short trigger occurs when the Stochastic oscillator exits oversold (long) or overbought (short).
This represents a potential shift in short-term momentum.
2. RSI “Smart Rotation” Filter (Context Component)
Instead of using fixed oversold/overbought thresholds, the indicator checks whether RSI is turning:
Long: RSI is below a contextual ceiling (default 50) and rising
Short: RSI is above a contextual floor (default 55) and falling
This avoids premature entries during strong trending phases and confirms that momentum is actually rotating.
3. OBV Slope Filter (Volume Confirmation)
The On-Balance Volume trend is compared to its previous value:
Long: OBV slope improving
Short: OBV slope deteriorating
This helps confirm whether volume pressure is shifting in favor of the trade direction.
Both RSI and OBV filters can be enabled or disabled independently via the indicator settings.
Signals
Small circles mark raw Stochastic reversal points (unfiltered).
Green / red triangles represent validated long/short signals where all active filters agree.
Optional candle coloring highlights confirmed entry signals on the chart.
Use Cases
Intraday and scalping strategies on XAUUSD
Identifying short-term momentum reversals
Filtering noisy signals during high-volatility sessions
Studying how volume and momentum align around turning points
Customization
Users can adjust:
RSI contextual thresholds
Lookback periods
OBV slope sensitivity
Stochastic parameters
Activation of RSI and OBV filters
This flexibility allows the indicator to adapt to different market conditions and timeframes.
Disclaimer
This indicator does not provide financial advice or guarantee performance.
Always test any strategy on historical data and use proper risk management.

Momentum Candle by DNDFXMomentum Candle v2 is a simple yet powerful indicator designed to detect strong momentum candles based on candle body size and the ratio between the body and total wick.
This indicator is ideal for traders who focus on:
Momentum trading
Breakout strategies
XAUUSD (Gold) scalping
Supply & Demand / Smart Money Concepts (SMC) confirmation
🔧 How the Indicator Works
The indicator analyzes each candle and classifies it as a Bullish Momentum or Bearish Momentum candle when these conditions are met:
✅ The candle body exceeds the minimum size
✅ The total wick is smaller compared to the body
✅ The Body-to-Wick ratio meets the strength filter
Visual signals include:
Green background for bullish momentum
Red background for bearish momentum
Up/Down triangle markers as entry guidance
⚙️ Customizable Parameters
Min Body Size (Points) – Sets the minimum candle body size
Min Body : Wick Ratio – Controls how dominant the body is compared to the wicks
All parameters can be optimized according to your trading style and timeframe.
✅ Best Use Cases
This indicator is useful for:
Breakout confirmation
Momentum validation
Filtering false breakouts
Scalping and intraday trading on XAUUSD
🧠 Trading Tips
For better accuracy, combine this indicator with:
Support & Resistance
Supply & Demand zones
Break of Structure (BOS) / CHoCH
Best performance on M5 – H1 timeframes.
⚠️ DISCLAIMER
This indicator is a supporting tool, not a guaranteed profit system. Always apply proper risk management. You are fully responsible for your trading decisions.

Setup Keltner BandS MMS + RSI SIGNALS
📊 Keltner Bands with RSI Confirmation – TradingView Script
Introduction
This script combines Keltner Channel logic with Relative Strength Index (RSI) confirmation to provide traders with visual signals and alerts for potential reversals. It is designed for scalping and short-term trading strategies, where precision and quick decision-making are essential.
🔧 How It Works
• Keltner Bands (ATR-based):
• Two sets of bands are plotted around a moving average:
• Band 3 (ATR × 3) – more sensitive, suitable for aggressive entries.
• Band 5 (ATR × 5) – wider, used as a filter or confirmation zone.
• Signals are generated when the price crosses back inside the bands from outside.
• RSI Confirmation:
• RSI is calculated with a customizable period (default: 14).
• Overbought and oversold levels (default: 70/30) are used to filter signals.
• A bearish reversal is confirmed only if RSI is above the overbought level.
• A bullish reversal is confirmed only if RSI is below the oversold level.
📌 Functions and Features
• Visual Signals:
• Triangles plotted above/below candles for Keltner-only signals.
• Additional colored triangles for Keltner + RSI confirmed signals.
• Alerts:
• Configurable alerts for both Keltner-only and RSI-confirmed conditions.
• Messages include the type of reversal and the band level.
• Customizable Parameters:
• Moving average length.
• ATR multipliers (3 and 5).
• RSI length and thresholds.
• Colors for band fills and signals.
🎯 Usage
1. Apply the script to your chart in TradingView.
2. Adjust parameters to fit your trading style (scalping, intraday, swing).
3. Watch for signals:
• Red/green/orange/teal triangles → Keltner-only reversals.
• Maroon/lime/purple/blue triangles → RSI-confirmed reversals.
4. Set alerts to receive notifications when conditions are met.
5. Use RSI confirmation to filter out false signals and increase accuracy.
✅ Benefits
• Clear visualization of reversal zones.
• Dual-layer confirmation (Keltner + RSI).
• Flexible for different timeframes and trading styles.
• Ready-to-use alerts for automation or manual trading.

VV Moving Average Convergence Divergence # VMACDv3 - Volume-Weighted MACD with A/D Divergence Detection
## Overview
**VMACDv3** (Volume-Weighted Moving Average Convergence Divergence Version 3) is a momentum indicator that applies volume-weighting to traditional MACD calculations on price, while using the Accumulation/Distribution (A/D) line for divergence detection. This hybrid approach combines volume-weighted price momentum with volume distribution analysis for comprehensive market insight.
## Key Features
- **Volume-Weighted Price MACD**: Traditional MACD calculation on price but weighted by volume for earlier signals
- **A/D Divergence Detection**: Identifies when A/D trend diverges from MACD momentum
- **Volume Strength Filtering**: Distinguishes high-volume confirmations from low-volume noise
- **Color-Coded Histogram**: 4-color system showing momentum direction and volume strength
- **Real-Time Alerts**: Background colors and alert conditions for bullish/bearish divergences
## Difference from ACCDv3
| Aspect | VMACDv3 | ACCDv3 |
|--------|---------|---------|
| **MACD Input** | **Price (Close)** | **A/D Line** |
| **Volume Weighting** | Applied to price | Applied to A/D line |
| **Primary Signal** | Volume-weighted price momentum | Volume distribution momentum |
| **Use Case** | Price momentum with volume confirmation | Volume flow and accumulation/distribution |
| **Sensitivity** | More responsive to price changes | More responsive to volume patterns |
| **Best For** | Trend following, breakouts | Volume analysis, smart money tracking |
**Key Insight**: VMACDv3 shows *where price is going* with volume weight, while ACCDv3 shows *where volume is accumulating/distributing*.
## Components
### 1. Volume-Weighted MACD on Price
Unlike standard MACD that uses simple price EMAs, VMACDv3 weights each price by its corresponding volume:
```
Fast Line = EMA(Price × Volume, 12) / EMA(Volume, 12)
Slow Line = EMA(Price × Volume, 26) / EMA(Volume, 26)
MACD = Fast Line - Slow Line
```
**Benefits of Volume Weighting**:
- High-volume price movements have greater impact
- Filters out low-volume noise and false moves
- Provides earlier trend change signals
- Better reflects institutional activity
### 2. Accumulation/Distribution (A/D) Line
Used for divergence detection, measuring buying/selling pressure:
```
A/D = Σ ((2 × Close - Low - High) / (High - Low)) × Volume
```
- **Rising A/D**: Accumulation (buying pressure)
- **Falling A/D**: Distribution (selling pressure)
- **Doji Handling**: When High = Low, contribution is zero
### 3. Signal Lines
- **MACD Line** (Blue, #2962FF): The fast-slow difference showing momentum
- **Signal Line** (Orange, #FF6D00): EMA or SMA smoothing of MACD
- **Zero Line**: Reference for bullish (above) vs bearish (below) bias
### 4. Histogram Color System
The histogram uses 4 distinct colors based on **direction** and **volume strength**:
| Condition | Color | Meaning |
|-----------|-------|---------|
| Rising + High Volume | **Dark Green** (#1B5E20) | Strong bullish momentum with volume confirmation |
| Rising + Low Volume | **Light Teal** (#26A69A) | Bullish momentum but weak volume (less reliable) |
| Falling + High Volume | **Dark Red** (#B71C1C) | Strong bearish momentum with volume confirmation |
| Falling + Low Volume | **Light Pink** (#FFCDD2) | Bearish momentum but weak volume (less reliable) |
Additional shading:
- **Light Cyan** (#B2DFDB): Positive but not rising (momentum stalling)
- **Bright Red** (#FF5252): Negative and accelerating down
### 5. Divergence Detection
VMACDv3 compares A/D trend against volume-weighted price MACD:
#### Bullish Divergence (Green Background)
- **Condition**: A/D is trending up BUT MACD is negative and trending down
- **Interpretation**: Volume is accumulating while price momentum appears weak
- **Signal**: Smart money accumulation, potential bullish reversal
- **Action**: Look for long entries, especially at support levels
#### Bearish Divergence (Red Background)
- **Condition**: A/D is trending down BUT MACD is positive and trending up
- **Interpretation**: Volume is distributing while price momentum appears strong
- **Signal**: Smart money distribution, potential bearish reversal
- **Action**: Consider exits, avoid new longs, watch for breakdown
## Parameters
| Parameter | Default | Range | Description |
|-----------|---------|-------|-------------|
| **Source** | Close | OHLC/HLC3/etc | Price source for MACD calculation |
| **Fast Length** | 12 | 1-50 | Period for fast EMA (shorter = more sensitive) |
| **Slow Length** | 26 | 1-100 | Period for slow EMA (longer = smoother) |
| **Signal Smoothing** | 9 | 1-50 | Period for signal line (MACD smoothing) |
| **Signal Line MA Type** | EMA | SMA/EMA | Moving average type for signal calculation |
| **Volume MA Length** | 20 | 5-100 | Period for volume average (strength filter) |
## Usage Guide
### Reading the Indicator
1. **MACD Lines (Blue & Orange)**
- **Blue Line (MACD)**: Volume-weighted price momentum
- **Orange Line (Signal)**: Smoothed trend of MACD
- **Crossovers**: Blue crosses above orange = bullish, below = bearish
- **Distance**: Wider gap = stronger momentum
- **Zero Line Position**: Above = bullish bias, below = bearish bias
2. **Histogram Colors**
- **Dark Green (#1B5E20)**: Strong bullish move with high volume - **most reliable buy signal**
- **Light Teal (#26A69A)**: Bullish but low volume - wait for confirmation
- **Dark Red (#B71C1C)**: Strong bearish move with high volume - **most reliable sell signal**
- **Light Pink (#FFCDD2)**: Bearish but low volume - may be temporary dip
3. **Background Divergence Alerts**
- **Green Background**: A/D accumulating while price weak - potential bottom
- **Red Background**: A/D distributing while price strong - potential top
- Most powerful at key support/resistance levels
### Trading Strategies
#### Strategy 1: Volume-Confirmed Trend Following
1. Wait for MACD to cross above zero line
2. Look for **dark green** histogram bars (high volume confirmation)
3. Enter long on second consecutive dark green bar
4. Hold while histogram remains green
5. Exit when histogram turns light green or red appears
6. Set stop below recent swing low
**Example**:
```
Price: 26,400 → 26,450 (rising)
MACD: -50 → +20 (crosses zero)
Histogram: Light teal → Dark green → Dark green
Volume: 50k → 75k → 90k (increasing)
```
#### Strategy 2: Divergence Reversal Trading
1. Identify divergence background (green = bullish, red = bearish)
2. Confirm with price structure (support/resistance, chart patterns)
3. Wait for MACD to cross signal line in divergence direction
4. Enter on first **dark colored** histogram bar after divergence
5. Set stop beyond divergence area
6. Target previous swing high/low
**Example - Bullish Divergence**:
```
Price: Making lower lows (26,350 → 26,300 → 26,250)
A/D: Rising (accumulation)
MACD: Below zero but starting to curve up
Background: Green shading appears
Entry: MACD crosses signal line + dark green bar
Stop: Below 26,230
Target: 26,450 (previous high)
```
#### Strategy 3: Momentum Scalping
1. Trade only in direction of MACD zero line (above = long, below = short)
2. Enter on dark colored bars only
3. Exit on first light colored bar or opposite color
4. Quick in and out (1-5 minute holds)
5. Tight stops (0.2-0.5% depending on instrument)
#### Strategy 4: Histogram Pattern Trading
**V-Bottom Reversal (Bullish)**:
- Red histogram bars start rising (becoming less negative)
- Forms "V" shape at the bottom
- Transitions to light red → light teal → **dark green**
- Entry: First dark green bar
- Signal: Momentum reversal with volume
**Λ-Top Reversal (Bearish)**:
- Green histogram bars start falling (becoming less positive)
- Forms inverted "V" at the top
- Transitions to light green → light pink → **dark red**
- Entry: First dark red bar
- Signal: Momentum exhaustion with volume
### Multi-Timeframe Analysis
**Recommended Approach**:
1. **Higher Timeframe (15m/1h)**: Identify overall trend direction
2. **Trading Timeframe (5m)**: Time entries using VMACDv3 signals
3. **Lower Timeframe (1m)**: Fine-tune entry prices
**Example Setup**:
```
15-minute: MACD above zero (bullish bias)
5-minute: Dark green histogram appears after pullback
1-minute: Enter on break of recent high with volume
```
### Volume Strength Interpretation
The volume filter compares current volume to 20-period average:
- **Volume > Average**: Dark colors (green/red) - high confidence signals
- **Volume < Average**: Light colors (teal/pink) - lower confidence signals
**Trading Rules**:
- ✓ **Aggressive**: Take all dark colored signals
- ✓ **Conservative**: Only take dark colors that follow 2+ light colors of same type
- ✗ **Avoid**: Trading light colored signals during high volatility
- ✗ **Avoid**: Ignoring volume context during news events
## Technical Details
### Volume-Weighted Calculation
```pine
// Volume-weighted fast EMA
fast_ma = ta.ema(src * volume, fast_length) / ta.ema(volume, fast_length)
// Volume-weighted slow EMA
slow_ma = ta.ema(src * volume, slow_length) / ta.ema(volume, slow_length)
// MACD is the difference
macd = fast_ma - slow_ma
// Signal line smoothing
signal = ta.ema(macd, signal_length) // or ta.sma() if SMA selected
// Histogram
hist = macd - signal
```
### Divergence Detection Logic
```pine
// A/D trending up if above its 5-period SMA
ad_trend = ad > ta.sma(ad, 5)
// MACD trending up if above zero
macd_trend = macd > 0
// Divergence when trends oppose each other
divergence = ad_trend != macd_trend
// Specific conditions for alerts
bullish_divergence = ad_trend and not macd_trend and macd < 0
bearish_divergence = not ad_trend and macd_trend and macd > 0
```
### Histogram Coloring Logic
```pine
hist_color = (hist >= 0
? (hist < hist
? (vol_strength ? #1B5E20 : #26A69A) // Rising: dark/light green
: #B2DFDB) // Positive but falling: cyan
: (hist < hist
? (vol_strength ? #B71C1C : #FFCDD2) // Rising (less negative): dark/light red
: #FF5252)) // Falling more: bright red
```
## Alerts
Built-in alert conditions for divergence detection:
### Bullish Divergence Alert
- **Trigger**: A/D trending up, MACD negative and trending down
- **Message**: "Bullish Divergence: A/D trending up but MACD trending down"
- **Use Case**: Potential reversal or continuation after pullback
- **Action**: Look for long entry setups
### Bearish Divergence Alert
- **Trigger**: A/D trending down, MACD positive and trending up
- **Message**: "Bearish Divergence: A/D trending down but MACD trending up"
- **Use Case**: Potential top or trend reversal
- **Action**: Consider exits or short entries
### Setting Up Alerts
1. Click "Create Alert" in TradingView
2. Condition: Select "VMACDv3"
3. Choose alert type: "Bullish Divergence" or "Bearish Divergence"
4. Configure: Email, SMS, webhook, or popup
5. Set frequency: "Once Per Bar Close" recommended
## Comparison Tables
### VMACDv3 vs Standard MACD
| Feature | Standard MACD | VMACDv3 |
|---------|---------------|---------|
| **Price Weighting** | Equal weight all bars | Volume-weighted |
| **Sensitivity** | Fixed | Adaptive to volume |
| **False Signals** | More during low volume | Fewer (volume filter) |
| **Divergence** | Price vs MACD | A/D vs MACD |
| **Volume Analysis** | None | Built-in |
| **Color System** | 2 colors | 4+ colors |
| **Best For** | Simple trend following | Volume-confirmed trading |
### VMACDv3 vs ACCDv3
| Aspect | VMACDv3 | ACCDv3 |
|--------|---------|--------|
| **Focus** | Price momentum | Volume distribution |
| **Reactivity** | Faster to price moves | Faster to volume shifts |
| **Best Markets** | Trending, breakouts | Accumulation/distribution phases |
| **Signal Type** | Where price + volume going | Where smart money positioning |
| **Divergence Meaning** | Volume vs price disagreement | A/D vs momentum disagreement |
| **Use Together?** | ✓ Yes, complementary | ✓ Yes, different perspectives |
## Example Trading Scenarios
### Scenario 1: Strong Bullish Breakout
```
Time: 9:30 AM (market open)
Price: Breaks above 26,400 resistance
MACD: Crosses above zero line
Histogram: Dark green bars (#1B5E20)
Volume: 2x average (150k vs 75k avg)
A/D: Rising (no divergence)
Action: Enter long at 26,405
Stop: 26,380 (below breakout)
Target 1: 26,450 (risk:reward 1:2)
Target 2: 26,500 (risk:reward 1:4)
Result: High probability setup with volume confirmation
```
### Scenario 2: False Breakout (Avoided)
```
Time: 2:30 PM (slow period)
Price: Breaks above 26,400 resistance
MACD: Slightly positive
Histogram: Light teal bars (#26A69A)
Volume: 0.5x average (40k vs 75k avg)
A/D: Flat/declining
Action: Avoid trade
Reason: Low volume, no conviction, potential false breakout
Outcome: Price reverses back below 26,400 within 10 minutes
Saved: Avoided losing trade due to volume filter
```
### Scenario 3: Bullish Divergence Bottom
```
Time: 11:00 AM
Price: Making lower lows (26,350 → 26,300 → 26,280)
MACD: Below zero but curving upward
Histogram: Red bars getting shorter (V-bottom forming)
Background: Green shading (divergence alert)
A/D: Rising despite price falling
Volume: Increasing on down bars
Setup:
1. Divergence appears at 26,280 (green background)
2. Wait for MACD to cross signal line
3. First dark green bar appears at 26,290
4. Enter long: 26,295 (next bar open)
5. Stop: 26,265 (below divergence low)
6. Target: 26,350 (previous swing high)
Result: +55 points (30 point risk, 1.8:1 reward)
Key: Divergence + volume confirmation = high probability reversal
```
### Scenario 4: Bearish Divergence Top
```
Time: 1:45 PM
Price: Making higher highs (26,500 → 26,520 → 26,540)
MACD: Positive but flattening
Histogram: Green bars getting shorter (Λ-top forming)
Background: Red shading (bearish divergence)
A/D: Declining despite rising price
Volume: Decreasing on up bars
Setup:
1. Bearish divergence at 26,540 (red background)
2. MACD crosses below signal line
3. First dark red bar appears at 26,535
4. Enter short: 26,530
5. Stop: 26,555 (above divergence high)
6. Target: 26,475 (support level)
Result: +55 points (25 point risk, 2.2:1 reward)
Key: Distribution while price rising = smart money exiting
```
### Scenario 5: V-Bottom Reversal
```
Downtrend in progress
MACD: Deep below zero (-150)
Histogram: Series of dark red bars
Pattern Development:
Bar 1: Dark red, hist = -80, falling
Bar 2: Dark red, hist = -95, falling
Bar 3: Dark red, hist = -100, falling (extreme)
Bar 4: Light pink, hist = -98, rising!
Bar 5: Light pink, hist = -90, rising
Bar 6: Light teal, hist = -75, rising (crosses to positive momentum)
Bar 7: Dark green, hist = -55, rising + volume
Action: Enter long on Bar 7
Reason: V-bottom confirmed with volume
Stop: Below Bar 3 low
Target: Zero line on histogram (mean reversion)
```
## Best Practices
### Entry Rules
✓ **Wait for dark colors**: High-volume confirmation is key
✓ **Confirm divergences**: Use with price support/resistance
✓ **Trade with zero line**: Long above, short below for best odds
✓ **Multiple timeframes**: Align 1m, 5m, 15m signals
✓ **Watch for patterns**: V-bottoms and Λ-tops are reliable
### Exit Rules
✓ **Partial profits**: Take 50% at first target
✓ **Trail stops**: Use histogram color changes
✓ **Respect signals**: Exit on opposite dark color
✓ **Time stops**: Close positions before major news
✓ **End of day**: Square up before close
### Avoid
✗ **Don't chase light colors**: Low volume = low confidence
✗ **Don't ignore divergence**: Early warning system
✗ **Don't overtrade**: Wait for clear setups
✗ **Don't fight the trend**: Zero line dictates bias
✗ **Don't skip stops**: Always use risk management
## Risk Management
### Position Sizing
- **Dark green/red signals**: 1-2% account risk
- **Light signals**: 0.5% account risk or skip
- **Divergence plays**: 1% account risk (higher uncertainty)
- **Multiple confirmations**: Up to 2% account risk
### Stop Loss Placement
- **Trend trades**: Below/above recent swing (20-30 points typical)
- **Breakout trades**: Below/above breakout level (15-25 points)
- **Divergence trades**: Beyond divergence extreme (25-40 points)
- **Scalp trades**: Tight stops at 10-15 points
### Profit Targets
- **Minimum**: 1.5:1 reward to risk ratio
- **Scalps**: 15-25 points (quick in/out)
- **Swing**: 50-100 points (hold through pullbacks)
- **Runners**: Trail with histogram color changes
## Timeframe Recommendations
| Timeframe | Trading Style | Typical Hold | Advantages | Challenges |
|-----------|---------------|--------------|------------|------------|
| **1-minute** | Scalping | 1-5 minutes | Fast profits, many setups | Noisy, high false signals |
| **5-minute** | Intraday | 15-60 minutes | Balance of speed/clarity | Still requires quick decisions |
| **15-minute** | Swing | 1-4 hours | Clearer trends, less noise | Fewer opportunities |
| **1-hour** | Position | 4-24 hours | Strong signals, less monitoring | Wider stops required |
**Recommendation**: Start with 5-minute for best balance of signal quality and opportunity frequency.
## Combining with Other Indicators
### VMACDv3 + ACCDv3
- **Use**: Confirm volume flow with price momentum
- **Signal**: Both showing dark green = highest conviction long
- **Divergence**: VMACDv3 bullish + ACCDv3 bearish = examine price action
### VMACDv3 + RSI
- **Use**: Overbought/oversold with momentum confirmation
- **Signal**: RSI < 30 + dark green VMACD = strong reversal
- **Caution**: RSI > 70 + light green VMACD = potential false breakout
### VMACDv3 + Elder Impulse
- **Use**: Bar coloring + histogram confirmation
- **Signal**: Green Elder bars + dark green VMACD = aligned momentum
- **Exit**: Blue Elder bars + light colors = momentum stalling
## Limitations
- **Requires volume data**: Will not work on instruments without volume feed
- **Lagging indicator**: MACD inherently follows price (2-3 bar delay)
- **Consolidation noise**: Generates false signals in tight ranges
- **Gap handling**: Large gaps can distort volume-weighted values
- **Not standalone**: Should combine with price action and support/resistance
## Troubleshooting
**Problem**: Too many light colored signals
**Solution**: Increase Volume MA Length to 30-40 for stricter filtering
**Problem**: Missing entries due to waiting for dark colors
**Solution**: Lower Volume MA Length to 10-15 for more signals (accept lower quality)
**Problem**: Divergences not appearing
**Solution**: Verify volume data available; check if A/D line is calculating
**Problem**: Histogram colors not changing
**Solution**: Ensure real-time data feed; refresh indicator
## Version History
- **v3**: Removed traditional MACD, using volume-weighted MACD on price with A/D divergence
- **v2**: Added A/D divergence detection, volume strength filtering, enhanced histogram colors
- **v1**: Basic volume-weighted MACD on price
## Related Indicators
**Companion Tools**:
- **ACCDv3**: Volume-weighted MACD on A/D line (distribution focus)
- **RSIv2**: RSI with A/D divergence detection
- **DMI**: Directional Movement Index with A/D divergence
- **Elder Impulse**: Bar coloring system using volume-weighted MACD
**Use Together**: VMACDv3 (momentum) + ACCDv3 (distribution) + Elder Impulse (bar colors) = complete volume-based trading system
---
*This indicator is for educational purposes. Past performance does not guarantee future results. Always practice proper risk management and never risk more than you can afford to lose.*

⚔️ The Scalpel⚔️ THE SCALPEL v2.0
━━━━━━━━━━━━━━━━━━━━━━━━━━━━━━━━━━━━━━━━━━━━━━━━━━━━━━━━
Surgical-Grade Market Structure Detection System
🔬 WHAT IS THE SCALPEL?
The Scalpel is a precision-engineered market structure analyzer that identifies and tracks critical support and resistance zones with surgical accuracy. Unlike conventional S&R tools that flood your chart with noise, The Scalpel cuts through the clutter to reveal only the most significant price structures.
━━━━━━━━━━━━━━━━━━━━━━━━━━━━━━━━━━━━━━━━━━━━━━━━━━━━━━━━
⚙️ CORE TECHNOLOGY
▸ Pivot-Based Detection Engine
Advanced pivot analysis calibrated by user-defined precision settings
▸ Tissue Integrity Validation
Filters structures based on candle body-to-range ratios
▸ Dynamic Stress Analysis
Tracks zone interactions and removes exhausted levels automatically
▸ Volatility-Adaptive Zones
Zone width scales with ATR for consistent performance across all markets
━━━━━━━━━━━━━━━━━━━━━━━━━━━━━━━━━━━━━━━━━━━━━━━━━━━━━━━━
🎨 VISUAL SPECTRUM
💜 STERILE ZONES (Electric Violet)
Fresh, untested structures with maximum potential
🔴 COMPRESSION ZONES (Magenta Fire)
Tested resistance ceilings under selling pressure
🩵 FOUNDATION ZONES (Neon Teal)
Tested support floors with proven buyer interest
✨ PLASMA AURA EFFECT
Multi-layered glow effect for enhanced visibility
━━━━━━━━━━━━━━━━━━━━━━━━━━━━━━━━━━━━━━━━━━━━━━━━━━━━━━━━
📐 PARAMETERS
🔪 Blade Precision (1-10)
Higher = fewer but sharper pivots detected
🩺 Tissue Integrity % (30-90)
Minimum candle body percentage required
📏 Incision Depth (0.1-2.0 ATR)
Controls zone thickness based on volatility
💉 Stress Threshold (1-10)
Maximum touches before zone invalidation
📐 Projection Range (10-200)
How far zones extend into the future
━━━━━━━━━━━━━━━━━━━━━━━━━━━━━━━━━━━━━━━━━━━━━━━━━━━━━━━━
💡 HOW TO USE
1. Fresh sterile zones (violet) are your highest-probability setups
2. Watch for price reaction at zone boundaries
3. Tested zones confirm structure but may have diminished strength
4. Zones auto-remove after stress threshold is reached
5. Use projection range to anticipate future tests
━━━━━━━━━━━━━━━━━━━━━━━━━━━━━━━━━━━━━━━━━━━━━━━━━━━━━━━━
🎯 BEST FOR
✓ Scalping & Day Trading
✓ Swing Trade Entries
✓ Stop Loss Placement
✓ Take Profit Targeting
✓ Multi-Timeframe Analysis
━━━━━━━━━━━━━━━━━━━━━━━━━━━━━━━━━━━━━━━━━━━━━━━━━━━━━━━━
⚠️ DISCLAIMER
This indicator is for educational purposes only. Always conduct your own analysis and use proper risk management. Past performance does not guarantee future results.
━━━━━━━━━━━━━━━━━━━━━━━━━━━━━━━━━━━━━━━━━━━━━━━━━━━━━━━━
🏷️ TAGS
support resistance zones SNR pivot points market structure scalping day trading swing trading price action order blocks smart money supply demand technical analysis

Price Volume Heatmap [MHA Finverse]Price Volume Heatmap - Advanced Volume Profile Analysis
Unlock the power of institutional-level volume analysis with the Price Volume Heatmap indicator. This sophisticated tool visualizes market structure through volume distribution across price levels, helping you identify key support/resistance zones, high-probability reversal areas, and optimal entry/exit points.
🎯 What Makes This Indicator Unique?
Unlike traditional volume indicators that only show volume over time, this heatmap displays volume distribution across price levels , revealing where the most significant trading activity occurred. The gradient coloring system instantly highlights high-volume nodes (areas of strong interest) and low-volume nodes (potential breakout zones).
📊 Core Features
1. Dynamic Volume Heatmap
- Visualizes volume concentration across 250 customizable price levels
- Gradient color scheme from high volume (white) to low volume (teal/green)
- Adjustable brightness multiplier for enhanced contrast and clarity
- Real-time updates as market conditions evolve
2. Point of Control (POC)
- Automatically identifies the price level with the highest traded volume
- Acts as a magnetic price level where markets often return
- Critical for identifying fair value areas and potential reversal zones
- Customizable line style, width, and color
3. Flexible Lookback Settings
- Lookback Bars: Set any value from 1-5000 bars to control analysis depth
- Visible Range Mode: Analyze only what's currently visible on your chart
- Timeframe-Specific Settings: Different lookback periods for 1m, 5m, 15m, 30m, 1h, Daily, and Weekly charts
- Adapts to your trading style - scalping to position trading
4. Session Separation Analysis
- Tokyo Session: 00:00-09:00 UTC
- London Session: 07:00-16:00 UTC
- New York Session: 13:00-22:00 UTC
- Sydney Session: 21:00-06:00 UTC
- Daily Reset: Analyze each trading day independently
Session separation allows you to understand volume distribution specific to each major trading session, revealing institutional order flow patterns and session-specific support/resistance levels.
5. Profile Width Options
- Dynamic: Profile width adjusts based on lookback period
- Fixed Bars: Set a specific bar count for consistent profile width
- Extend Forward: Project the profile into future bars for planning trades
6. Smart Alerts
- POC crossover/crossunder alerts
- New session start notifications
- Never miss critical price action at high-volume nodes
📈 How to Use This Indicator Professionally
Understanding Market Structure:
High Volume Nodes (HVN):
- Appear as bright/white areas in the heatmap
- Represent price levels where significant trading occurred
- Act as strong support/resistance zones
- Markets often consolidate or bounce from these levels
- Trading Strategy: Look for entries when price tests HVN areas with confluence from other indicators
Low Volume Nodes (LVN):
- Appear as darker/teal areas in the heatmap
- Represent price levels with minimal trading activity
- Price tends to move quickly through these areas
- Often form "gaps" in the volume profile
- Trading Strategy: Expect rapid price movement through LVN zones; avoid placing stop losses here
Point of Control (POC):
- The single most important price level in your analysis window
- Represents the fairest price where maximum volume traded
- Price gravitates toward POC like a magnet
- Trading Strategy:
* When price is above POC: bullish bias, POC acts as support
* When price is below POC: bearish bias, POC acts as resistance
* POC breaks often lead to significant trend changes
Session-Based Analysis:
Use session separation to understand how different market participants trade:
Asian Session (Tokyo/Sydney):
- Typically lower volatility and range-bound
- Volume profiles often show tight, balanced distribution
- Use for identifying overnight ranges and gap fill zones
London Session:
- Highest volume session for forex pairs
- Often shows strong directional bias
- Look for breakouts from Asian ranges during London open
New York Session:
- Maximum participation when overlapping with London
- Institutional order flow most visible
- POC during NY session often becomes key level for following sessions
🎯 Practical Trading Applications
1. Identifying Support & Resistance:
High volume nodes from the heatmap are far more reliable than traditional swing highs/lows. When price approaches an HVN, expect reaction - either a bounce or a significant breakout if breached.
2. Trend Confirmation:
- Healthy uptrend: POC rising over time, HVN forming at higher levels
- Healthy downtrend: POC falling over time, HVN forming at lower levels
- Consolidation: POC relatively flat, volume balanced across range
3. Breakout Trading:
When price breaks through a Low Volume Node with momentum, it often continues to the next High Volume Node. Use LVN areas as measured move targets.
4. Reversal Zones:
Multiple HVN stacking on top of each other creates a "volume shelf" - an extremely strong support/resistance zone where reversals are highly probable.
5. Risk Management:
- Place stops beyond HVN areas (not within LVN zones)
- Size positions based on distance to nearest HVN
- Use POC as trailing stop level in trending markets
⚙️ Recommended Settings
For Day Trading (Scalping/Intraday):
- Lookback: 200-500 bars
- Rows: 200-250
- Enable session separation for your primary trading session
- Profile Width: Dynamic or Fixed Bars (30-50)
For Swing Trading:
- Lookback: 500-1000 bars
- Rows: 250
- Session separation: Daily Reset
- Profile Width: Dynamic
For Position Trading:
- Lookback: 1000-3000 bars
- Rows: 250
- Use timeframe-specific settings
- Profile Width: Extend Forward (20-50 bars)
💡 Pro Tips
1. Combine this indicator with price action analysis - volume confirms what price is telling you
2. Watch for POC convergence with other technical levels (fibonacci, pivot points, moving averages)
3. Volume at extremes (tops/bottoms of heatmap) often indicates exhaustion
4. Session POC from previous sessions often acts as magnet for current session
5. Increase brightness multiplier (1.5-2.5) for clearer visualization on busy charts
6. Use "Number of Sessions to Display" to analyze consistency of volume levels across multiple sessions
🎨 Customization
Fully customizable visual appearance:
- Gradient colors for volume visualization
- POC line thickness, color, and style
- Session line colors and visibility
- All settings organized in intuitive groups
⚠️ Disclaimer
This indicator is a technical analysis tool and should not be used as the sole basis for trading decisions. Always combine volume analysis with proper risk management, fundamental analysis, and other technical indicators. Past performance does not guarantee future results.
---
Support & Updates
Regular updates and improvements are made to enhance functionality. For questions, suggestions, or bug reports, please use the comments section below.
Happy Trading! 📊💹

ROC Bot AlertsA rules-based momentum scalping framework for short-term index futures
This indicator is designed for traders who focus on fast-moving, intraday momentum opportunities—particularly on lower timeframes such as the 1-minute chart. It uses a structured combination of trend filters and short-term momentum tools to help identify potential continuation entries during active market conditions.
Core Concept
The tool evaluates price behavior relative to a dynamic trend line while measuring short-term rate-of-change and directional strength. When all components align, the indicator highlights moments where the market may be transitioning into or sustaining momentum in one direction. Conversely, when conditions deteriorate or momentum weakens, the indicator suppresses signals to reduce noise and avoid choppy environments.
This approach aims to provide buy/sell signals for scalping in trending or expanding-volatility conditions.
What the Indicator Uses
The system assesses several factors before confirming a potential momentum signal:
A dynamic trend filter to determine directional bias
A rate-of-change threshold to confirm short-term acceleration
A trend-strength component to avoid signals during low-energy or ranging conditions
A cooldown mechanism to prevent rapid, back-to-back signals in unsettled areas
Only when all conditions align does the indicator paint a long or short trigger on the chart.
Intended Use
This tool is best suited for:
- Active scalpers
- Intraday index futures traders (NQ, ES, GC, etc.)
- Short-duration momentum traders
- Traders who prefer clean, rules-based decision making
It is not designed for swing trading, long-term trend following, or counter-trend strategies.
How to Read the Signals
- Buy markers appear when trend, momentum, and strength all support upward continuation.
- Sell markers appear when these same factors align in the opposite direction.
- The 90-period trend line can be shown or hidden based on user preference, but it remains part of the decision framework internally.
- The user may optionally adjust the momentum threshold (ROC%) to suit different volatility environments.
Important Notes
Signals are generated only on completed bars.
As with all technical tools, this should be used alongside proper risk and trade management practices.

Fib Golden RatioDynamic Fib High → Low (0.5 & 0.618)
This indicator automatically tracks the current day’s High and Low and plots the key Fibonacci retracement levels 0.5 (50%) and 0.618 (Golden Ratio) based on the live intraday price range.
The tool is designed for traders who want simple, clean, and dynamic intraday Fibonacci levels without clutter on the chart.
How It Works
Detects the start of a new trading day
Tracks the highest high and lowest low of the current day
Continuously recalculates:
Fibonacci 0.5 (Midpoint)
Fibonacci 0.618 (Golden Ratio)
Plots clean continuous lines across the chart
Fib is calculated from High → Low, matching how typical intraday fib tools are visually applied
Why This Indicator
No drawings to manually adjust
No user configuration required
Extremely lightweight and fast
Automatically adjusts as the day progresses
Perfect for identifying intraday mean reversion zones, pullback zones, and reaction levels
Ideal Use Cases
Intraday directional trading
Scalping pullbacks
Mean reversion setups
Identifying dynamic support/resistance zones
Option scalping (CE/PE)
