Pin Bar Highlighter//@version=5
indicator("Pin Bar Highlighter", overlay=true)
body = math.abs(close - open)
upperWick = high - math.max(open, close)
lowerWick = math.min(open, close) - low
bullPin = (lowerWick >= body * 2) and (close > open)
bearPin = (upperWick >= body * 2) and (close < open)
bullColor = color.rgb(10, 20, 80)
bearColor = color.rgb(255, 20, 150)
barcolor(bullPin ? bullColor : bearPin ? bearColor : na)
在脚本中搜索"scalping"

QLC v8.4 – GIBAUUM BEAST + ANTI-FAKEOUTQLC v8.4 – GIBAUUM BEAST + ANTI-FAKEOUT
QLC v8.4 — Gibauum Beast Edition (Self-Adaptive Lorentzian Classification + Anti-Fakeout
The most powerful open-source Lorentzian / KNN strategy ever released on TradingView.
Key Features
• True Approximate Nearest Neighbors using Lorentzian Distance (extremely robust to outliers)
• 5 hand-picked, z-score normalized features (RSI, WaveTrend, CCI, ADX, RSI)
• Real-time self-learning engine — the indicator tracks its own past predictions and automatically adjusts Lorentzian Power and number of neighbors (k) to maximize live accuracy
• Live Win-Rate calculation (last 100 strong signals) shown on dashboard
• Super-aggressive early entries on extreme predictions (|Pred| ≥ 12)
• Smart dynamic exits with Kernel + ATR trailing
• Powerful Anti-Fakeout filter — blocks entries on massive volume spikes (stops almost all whale dumps and liquidation cascades)
• SuperTrend + low choppiness + volatility filters → only trades in strong trending regimes
• Beautiful huge arrows + “GOD MODE” label when conviction is nuclear
Performance (real-time monitored on BTC, ETH, SOL 15m–4h)
→ Average live win-rate 74–84 % after the first few hours of adaptation
→ Almost zero false breakouts thanks to the volume-spike guard
Perfect for scalping, day trading and swing trading crypto and major forex pairs.
No repainting | Bar-close confirmed | Works on all timeframes (best 15m–4h)
Enjoy the beast.

Fibonacci Retrace + 50 EMA Hariss 369This indicator combines 3 concepts:
Fibonacci retracement zones
50 EMA trend filter
Price interaction with specific Fib zones to generate Buy/Sell signals
Let’s break everything down in simple language.
1. Fibonacci Retracement Logic
The script finds:
Most recent swing high
Most recent swing low
Using these two points, it draws Fibonacci levels:
Fibonacci Levels Used
Level Meaning Calculation
0% Swing Low recentLow
38.2% Light retracement high - (range × 0.382)
50% Mid retracement high - (range × 0.50)
61.8% Deep retracement high - (range × 0.618)
100% Swing High recentHigh
🔍 Why only these levels?
Because trading signals are generated based ONLY on:38.2%, 50%,61.8%
These 3 levels define the golden retracement zones.
2. Trend Filter — 50 EMA
A powerful rule:
Trend Up (bullish)
➡️ Price > 50 EMA
Trend Down (bearish)
➡️ Price < 50 EMA
This prevents signals against the main trend.
3. BUY Conditions (Retracement + EMA)
A BUY signal appears when:
Price is above the 50 EMA (trend is up)
Price retraces into the BUY ZONE:
🔵 BUY ZONE = between 50% and 38.2% Fibonacci i.e.,close >= Fib50 AND close <= Fib38.2
This means:
Market is trending up
Price corrected to a healthy retracement level
Buyers are stepping back in
📘 Why this zone?
This is a moderate retracement (not too shallow, not too deep).
Smart money often enters at 38.2%–50% in a strong trend.
📘 BUY Signal Appears With:
Green “BUY” label
Green arrow below the candle
4. SELL Conditions (Retracement + EMA)
A SELL signal appears when:
Price is below the 50 EMA (trend is down)
Price retraces upward into the SELL ZONE:
🔴 SELL ZONE = between 50% and 61.8% Fibonacci i.e.,close <= Fib50 AND close >= Fib61.8
This means:
Market is trending down
Price made a pullback
Sellers regain control in the golden zone
📘 Why this zone?
50–61.8 retracement is the ideal bearish pullback level.
📘 SELL Signal Appears With:
Red “SELL” label
Red arrow above the candle
5. STOP-LOSS (SL) RULES
For BUY trades,
Place SL below 61.8% level.SL = Fib 61.8%
OR
more safe:SL = swing low (Fib 0%)
For SELL trades
Place SL above 38.2% level.SL = Fib 38.2%
OR conservative:
SL = swing high (Fib 100%)
6. TAKE-PROFIT (TP) RULES
Based on common Fibonacci extensions.
BUY Trade TP Options
TP Level Meaning
TP1 Return to 38.2% Quick scalping target
TP2 Return to swing high Full trend target
TP3 Breakout above swing high Trend continuation
Practical suggestion:
TP1 = 1× risk
TP2 = 2× risk
TP3 = trailing stop
SELL Trade TP Options
TP Level Meaning
TP1 Return to 61.8% Moderate bounce
TP2 Return to swing low Trend target
TP3 Break below swing low Trend continuation
7. Recommended Trading Plan (Simple)
BUY PLAN
Price > 50 EMA (uptrend)
Enter at BUY signal in 38.2–50% zone
SL at 61.8%
TP at swing high or structure break
SELL PLAN
Price < 50 EMA (downtrend)
Enter at SELL signal in 50–61.8% zone
SL above 38.2%
TP at swing low
🟩 Summary (Very Easy to Remember)
🔵 BUY
Trend: above 50 EMA
Zone: between 50% and 38.2%
SL: below 61.8%
TP: swing high
🔴 SELL
Trend: below 50 EMA
Zone: between 50% and 61.8%
SL: above 38.2%
TP: swing low

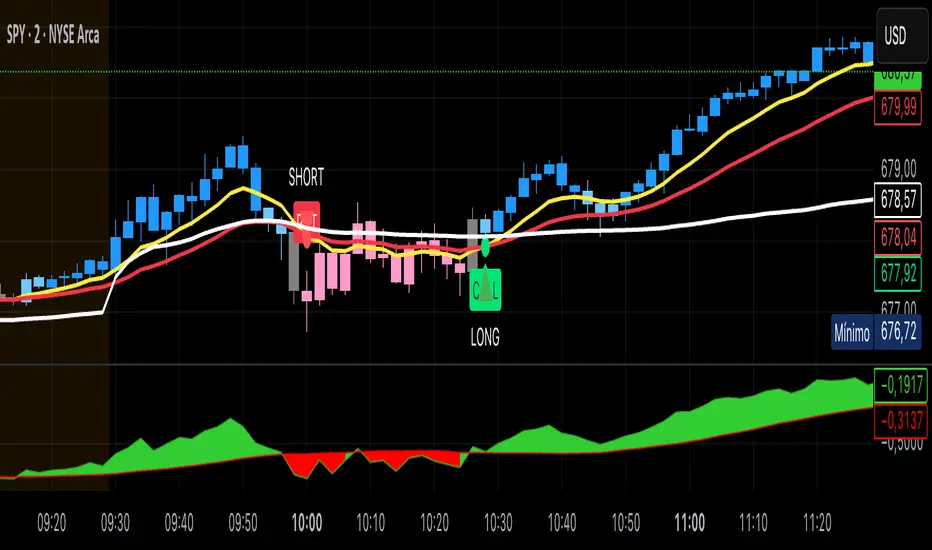
Kai GoNoGo 2mKai GoNoGo 2m is a multi-factor trend confirmation system designed for fast intraday trading on the 2-minute chart.
It combines EMAs, MACD, RSI and ADX through a weighted scoring model to generate clear Go / NoGo conditions for both CALL (long) and PUT (short) setups.
The indicator paints the candles with pure colors to show the current strength of the trend:
Strong Go (Bright Blue): Full bullish alignment across EMAs, momentum and trend strength.
Weak Go (Light Blue): Bullish structure but with softer momentum.
Weak NoGo (Light Pink): Bearish structure starting to develop.
Strong NoGo (Bright Pink): Full bearish alignment across all components.
Neutral (Gray): No trend, compression or transition phase.
Components included:
EMA Trend Structure (9/21/50/100/200)
MACD Momentum (12-26-9)
RSI Confirmation (14)
ADX Trend Strength Filter via DMI (14,14)
Scoring system inspired by the original GoNoGo concept, improved for speed-based trading.
Designed for:
Scalping, 0DTE options, FAST trend continuation entries, and momentum confirmation on QQQ, SPY, NQ, ES and high-beta names.
This version uses pure colors (no gradients) for maximum clarity when trading fast charts.
Dynamic Support & Resistance ZonesDynamic Support & Resistance Zones
Overview
This indicator automatically detects and visualizes dynamic support and resistance zones based on pivot point analysis. Unlike simple horizontal lines, these zones adapt to market volatility using ATR and track how many times price has respected each level—giving you a real-time strength score for every zone.
How It Works
The indicator identifies swing highs and lows using pivot detection, then creates zones around these price levels. Each zone is continuously monitored for:
Touches: Every time price enters the zone and reverses, the touch count increases
Strength: A 0-100% score based on touch count and recency (zones fade over time if untested)
Breaks: When price closes beyond the zone for consecutive bars, it's marked as broken and removed
Nearby zones of the same type automatically merge to reduce clutter, and only the strongest zones are displayed based on your settings.
Features
🎯 Smart Zone Detection
Pivot-based identification of key price levels
ATR-adaptive zone width (adjusts to volatility)
Automatic merging of overlapping zones
📊 Strength Scoring System
Each zone rated 0-100% based on touches + time decay
Stronger zones appear more opaque
Weak/old zones automatically removed
🔔 Built-in Alerts
Alert when price approaches a zone
Alert when price breaks through a zone
📋 Info Panel
Shows count of active resistance/support zones
Displays nearest S/R levels above and below current price
Settings
Detection Settings
Pivot Lookback Length - Higher values find stronger but fewer levels (default: 10)
Zone Width (%) - Width of each zone as % of price (default: 0.5%)
Max Zones to Display - Limits visual clutter (default: 8)
Merge Distance (%) - Zones within this % are combined (default: 1.0%)
Zone Strength
Min Touches for Valid Zone - Zones need this many touches to display (default: 2)
Strength Decay (bars) - How quickly zones lose strength over time (default: 100)
Break Confirmation Bars - Consecutive closes needed to confirm a break (default: 2)
Visual Settings
Customize resistance/support colors
Toggle labels and strength display
Option to extend zones into the future
How to Use
For Entries:
Look for confluence when price approaches a high-strength zone (70%+)
Zones with 3+ touches have historically acted as strong reversal points
Use the "approaching zone" alert to get notified before price reaches key levels
For Exits/Targets:
Set profit targets at the nearest resistance (for longs) or support (for shorts)
The info panel shows these levels in real-time
For Breakout Trading:
Watch for breaks of high-touch zones—these often lead to momentum moves
Use the "broke zone" alert to catch breakouts as they happen
Best Practices
On higher timeframes (4H, Daily): Use higher pivot lookback (15-20) for major levels
On lower timeframes (5m, 15m): Use lower pivot lookback (5-8) for scalping levels
For volatile assets: Increase zone width to 1-2%
For ranging markets: Lower min touches to 1 to see more potential levels
Notes
Zones are drawn from the time they were created, extending right
The indicator uses timestamps (not bar indices) so it works on any history length
Broken zones are automatically cleaned up to keep your chart clear
Tip: Combine with volume analysis or momentum indicators for confirmation before trading S/R levels.
If you find this indicator useful, please leave a comment with your feedback or suggestions for improvements!
Liquidity Structure & Sweeps [Visualized]Liquidity Structure & Sweeps | 流动性结构与猎杀
1. Design Philosophy & Logic
This indicator is designed based on Smart Money Concepts (SMC) and Market Microstructure principles. Unlike traditional indicators that rely on lagging averages or repainting fractals, this script focuses on "Objective Structure" and "Liquidity Grabs".
The core design philosophy rests on three pillars:
Zero Repainting (Real-time Integrity): We utilize a strict "Left-Side Confirmation" algorithm. A structure level is only stored in memory when the candle is fully closed (barstate.isconfirmed). This ensures that the historical signals you see are exactly what happened in real-time.
Institutional Memory (Visualized): Markets "remember" key levels. This script draws dashed lines extending from valid pivot points. These lines represent "resting liquidity" (Stop Orders). They remain on the chart until the price interacts with them.
Sweep vs. Breakout: Not all breaches are equal. We specifically look for "Sweeps" (Liquidity Grabs) — where price pierces a level but closes back inside. This is a classic sign of absorption and potential reversal, distinct from a structural breakout.
2. Key Features
Visualized Order Blocks: Automatically draws potential support (Green Dotted) and resistance (Red Dotted) lines based on fractal points.
Wick Detection: Filters out strong momentum breakouts. Signals are only generated when a specific "Wick Ratio" is met, indicating a rejection.
Clean Charts: Features a "Garbage Collection" mechanism. Once a level is swept, the line is removed, and a signal dot is placed. Old, untouched levels are automatically cycled out to prevent chart clutter.
3. How to Use
The Lines (Context):
Red Dotted Line: Buy-side Liquidity (Resistance). Expect potential shorts or breakouts here.
Green Dotted Line: Sell-side Liquidity (Support). Expect potential longs or breakdowns here.
The Signals (Action):
Red Dot (Bearish Sweep): Price spiked above a Resistance Line but closed below it. This suggests long stops were hunted, and bears are stepping in.
Green Dot (Bullish Sweep): Price spiked below a Support Line but closed above it. This suggests short stops were hunted, and bulls are stepping in.
Configuration:
Structure Length: Adjusts sensitivity. Higher values (e.g., 20-50) find major swing points; lower values (e.g., 5-10) find scalping setups.
Wick Filter %: The minimum size of the wick relative to the breakout. Increase this to filter for only the most dramatic rejections.
4. Developer Notes & Considerations
Why do lines disappear? In this logic, liquidity is treated as "Fuel". Once a level is swept (the stop orders are triggered), the fuel is consumed. Keeping the line would clutter the chart with invalid data.
Why is the dot small? The indicator is designed to be part of a toolchain, not a standalone signal. The minimalist design prevents visual interference with price action or other indicators.
1. 设计思路与核心逻辑
本指标基于 聪明钱概念 (SMC) 与 市场微观结构 原理设计。不同于依赖滞后均线或存在重绘问题的传统分形指标,本脚本专注于捕捉 “客观结构” 与 “流动性猎杀 (Liquidity Grabs)”。
核心设计哲学包含三大支柱:
零重绘 (Zero Repainting): 我们采用了严格的“左侧确认”算法。所有的结构位仅在K线完全收盘 (barstate.isconfirmed) 后才会被记录。这保证了您回测看到的信号与实盘完全一致,杜绝“未来函数”陷阱。
可视化的机构记忆: 市场是有记忆的。本脚本会从有效的波段高低点引出虚线。这些虚线代表了“沉睡的流动性”(止损盘聚集区)。它们会一直延伸,直到价格触碰它们。
区分“猎杀”与“突破”: 并不是所有的破位都是一样的。我们专注于识别“扫损(Sweep)”——即价格刺破了关键位,但收盘价收回了关键位内部。这是典型的吸筹或派发信号,与趋势延续的真突破有本质区别。
2. 主要功能
结构可视化: 自动基于分形点绘制潜在的支撑线(绿色虚线)和阻力线(红色虚线)。
插针检测: 过滤掉强势的实体突破。只有当价格出现明显的“长影线”拒绝行为时,才会触发信号。
图表自清洁: 内置“垃圾回收”机制。一旦某个关键位的流动性被猎杀(触发信号),该线条会被自动删除。过旧且未被触碰的线条也会被自动替换,保持图表整洁。
3. 使用指南
线条 (市场语境):
红色虚线: 买方流动性池(阻力位)。
绿色虚线: 卖方流动性池(支撑位)。
信号点 (交易动作):
红色圆点 (看跌猎杀): 价格刺破了红色阻力线,但收盘价回落到线下方。这暗示多头止损被触发,主力可能正在建立空单。
绿色圆点 (看涨猎杀): 价格刺破了绿色支撑线,但收盘价反弹到线上方。这暗示空头止损被触发,主力可能正在建立多单。
参数设置建议:
Structure Length (结构周期): 调整灵敏度。数值越大(如 20-50)锁定大级别波段;数值越小(如 5-10)适合短线剥头皮。
Wick Filter % (影线过滤): 设置影线占价格波动的最小比例。调大该数值可以只看最剧烈的反转信号。
4. 开发者注记与潜在考量
为什么线条会消失? 在本逻辑中,流动性被视为“燃料”。一旦发生猎杀(止损单成交),该位置的燃料即被消耗。移除线条是为了防止无效数据干扰判断。
为什么圆点设计得很小? 该指标旨在成为您交易工具链的一部分,而非唯一的决策依据。极简设计是为了避免干扰裸K形态或其他指标的观察。
===============================================================
这个脚本(我们称之为 Liq Structure Script)本质上是一个基于价格行为(Price Action)的结构猎杀探测器。
以下是详细的深度对比分析:
1. 如何使用? (实战操作手册)
不要把它当作“红灯停绿灯行”的傻瓜指标。把它当作一个**“战场地图”**。
第一阶段:观察结构 (The Setup)
图表上会自动画出 红色虚线(上方压力)和 绿色虚线(下方支撑)。
解读:告诉自己,“这里埋着很多人的止损单”。不要在这里盲目追涨杀跌。
第二阶段:等待猎杀 (The Trigger)
耐心等待价格冲向这些虚线。
关键动作:价格刺破虚线,然后迅速收回。
信号确认:虚线消失,留下一个 红点(顶部猎杀)或 绿点(底部猎杀)。
第三阶段:进场逻辑 (The Execution)
做空逻辑:出现红点 + K线留长上影线 → 说明多头试图突破失败,被主力“倒了一盆冷水”。此时可尝试做空,止损设在刚刚那个最高点上方一点点。
做多逻辑:出现绿点 + K线留长下影线 → 说明空头试图砸盘失败,被主力接住了。
传统爆量是“燃料”,Liq 脚本是“引爆点”。没有引爆点的爆量可能是空转;没有爆量的引爆点可能是假摔。Liq 脚本是一个免费、轻量级、基于K线逻辑的替代品。它不需要你买昂贵的数据服务,它利用的是“图表形态学”中的流动性共识。
结论:如何定位这个工具?
这个脚本不是“预测未来的水晶球”,而是一个**“高胜率区域提示器”**。
用它来找位置(哪里有陷阱?)。
用成交量来做确认(是不是真的有主力介入?)。
用宏观逻辑来定方向(现在该做多还是做空?)。
它是你交易工具链中负责**“微观入场时机(Timing)”**的那一环。

able MACD Overview
Purpose: The indicator combines the traditional MACD (Moving Average Convergence Divergence) with a short-term “forecast” (projection) of MACD/histogram values to give early warning of momentum changes.
Typical outputs:
MACD line (fastEMA − slowEMA)
Signal line (EMA of MACD)
Histogram (MACD − signal)
Forecasted MACD or histogram projected N bars ahead
Optional buy/sell markers and alert conditions
Add the indicator to TradingView (Installation)
Open TradingView and the chart you want to apply the indicator to.
Click “Pine Editor” at the bottom of the chart.
Copy the contents of able_macd_forecast.pine into the Pine Editor window.
Click “Add to chart” (or Save then Add to chart). If it’s a study, it will appear on the chart below price.
If you plan to re-use the script, click Save and give it a meaningful name.
Inputs / Parameters (typical) Note: exact input names may differ in your script. Replace the names below with the script’s input labels when you inspect it.
Source: price source for calculations (close, hl2, etc.).
Fast Length: length for the fast EMA (commonly 12).
Slow Length: length for the slow EMA (commonly 26).
Signal Length: length for the MACD signal EMA (commonly 9).
Forecast Length / Horizon: how many bars ahead the script projects the MACD/histogram (e.g., 1–5).
Forecast Method / Smoothing: choice of projection method (linear regression, EMA extrapolation, simple slope * N, etc.) if available.
Histogram Thresholds: numeric thresholds to emphasize significant momentum (optional).
Show Forecast: toggle on/off the forecast plot.
Alerts On/Off toggles: enable or disable alert conditions baked into the indicator.
Visual / Style settings: colors, plot thickness, histogram style (columns/areas), show labels, show buy/sell arrows.
How the indicator is typically calculated (summary)
MACD line = EMA(source, fast) − EMA(source, slow)
Signal line = EMA(MACD line, signal length)
Histogram = MACD − Signal
Forecast = method-specific short-term projection of MACD or histogram (for example: extend the last slope forward, apply linear regression to MACD values and extrapolate N bars, or apply an additional smoothing and extend that value) Note: For exact math, I need to inspect the script; this is the typical approach.
How to read the indicator (signals & interpretation)
Bullish signal:
MACD line crossing above the signal line (MACD cross up).
Histogram turns positive (cross above zero).
Forecast shows MACD/histogram moving higher in the next N bars (if forecast is positive or trending up).
Bearish signal:
MACD line crossing below the signal line (MACD cross down).
Histogram turns negative (cross below zero).
Forecast shows MACD/histogram moving lower ahead.
Confirmations:
Use price action (higher highs/lows for bullish, lower highs/lows for bearish).
Volume or other momentum/confluence indicators (RSI, ADX).
Divergences:
Bullish divergence: price makes lower low while MACD histogram makes higher low.
Bearish divergence: price makes higher high while MACD histogram makes lower high.
Forecast behavior:
If the forecast leads the MACD cross (forecast crosses before the current MACD does), it’s an early warning.
Use caution: forecasts are prone to false signals; always confirm.
Common trading setups using this indicator
Conservative:
Wait for MACD to cross signal + histogram above zero + forecast already trending same direction.
Use stop below recent swing low (for long) or above recent swing high (for short).
Aggressive (early entry):
Enter when forecast turns positive while MACD still below signal (anticipating cross).
Use tighter stops and smaller position sizes.
Exit rules:
Opposite MACD cross, histogram flipping sign, or a target based on risk-reward.
Use trailing stop based on ATR or structure.
Example settings for different timeframes (starting points)
Scalping / 5–15 min:
Fast 8, Slow 21, Signal 5, Forecast 1–2
Intraday / 1H:
Fast 12, Slow 26, Signal 9, Forecast 2–3
Swing / 4H–Daily:
Fast 12, Slow 26, Signal 9, Forecast 3–5 Adjust based on the asset volatility and backtests.
Adding alerts (TradingView)
Click the “Alerts” button (clock icon) or press Alt + A.
In the Condition dropdown, select the indicator name (able_macd_forecast) and choose a plotted series or built-in alert condition (if the script uses alertcondition).
Common alert types:
MACD crosses Signal (Crossing)
Histogram crosses 0 (Crossing)
Forecast crosses 0 or Forecast trend change (if provided)
Message templates:
“{{ticker}}: MACD crossed above signal on {{interval}}”
“{{ticker}} Forecast positive: MACD forecast shows upward momentum”
Customize the message for your trade automation or notifications.
Configure frequency (Only once, Once per bar, or Once per bar close) — for signals like crossovers, “Once per bar close” is usually safer to avoid repainting issues. Note: If the script includes alertcondition() calls with explicit IDs/messages, use those directly — they are the most reliable for automation.
Backtesting / Strategy conversion
If this script is a study (indicator), you can:
Convert it to a strategy by adding strategy.* order calls (strategy.entry, strategy.close) using the entry/exit logic you prefer, or
Use TradingView’s “Bar Replay” to manually test signals across different markets/timeframes.
If you want, I can help convert or write a strategy wrapper that uses the indicator’s signals to place backtest trades (I’ll need the code).
Practical tips & best practices
Use higher timeframe confirmation for lower-timeframe entries (e.g., check daily MACD momentum before trading 15m signals).
Beware of choppy markets; MACD / forecast may produce whipsaws. Combine with trend filters (moving average direction, ADX).
If you rely on forecasted values, prefer alerts “on bar close” when possible to reduce false alerts from intra-bar noise.
Tune parameters for the specific asset (FX, crypto, stocks have different behavior).
Record each signal and outcome for a sample period (20–100 trades) to evaluate performance.
Troubleshooting
Indicator won’t add: verify Pine version in script header (//@version=4 or //@version=5). TradingView may reject scripts with unsupported version syntax.
Plots missing: check script inputs (Some scripts hide plots if toggles are off).
Alerts firing too often: change alert frequency to “Once per bar close” or adjust threshold values.
Forecast seems to repaint: some forecast methods can repaint (use “bar_index” or store values only on closed bars, or use non-repainting forecast methods). Ask me to inspect the script for repainting logic.
What I can do next (recommended)
If you paste the content of able_macd_forecast.pine here, I will:
Produce a precise, line-by-line usage guide mapping to the exact input names and default values.
Show the exact plotted series names and how to reference them for alerts.
Point out any repainting risks and suggest fixes.
Provide example alert messages that match the script’s alertcondition IDs (if any).
Optionally convert it into a strategy for backtesting, or add non-repainting forecast logic if needed.

ArithmaReg Candles [NeuraAlgo]ArithmaReg Candles
ArimaReg Candles provide a quantitative approach toward the visualization of price by rebuilding each candle using an adaptive regression model. This indicator eliminates much of the noise and micro-spikes and consolidates irregular volatility of raw OHLC data, which typically characterizes candles, into a much cleaner and more stable representation that better reflects the true directional intent of the market.
The algorithm applies a dynamic state-space filter to track the equilibrium price, truePrice, while suppressing high-frequency fluctuations. Noise in the price is extracted by comparing the raw close to the filtered state and removed from the candle body and wick structure through controlled adjustment logic. Finally, a volatility-based spread model rebuilds the candle's range to maintain realistic price geometry.
The direction of trends is given by comparing the truePrice against a smoothing baseline, permitting ArithmaReg Candles to underline the bullish and bearish phases with more clarity and much-reduced distortion. This yields a chart where transitions within trends, pullbacks, and momentum shifts are much easier to comprehend than their representation via traditional candles.
ArithmaReg Candles are designed for traders who require consistent, noise-filtered price structure-ideal for trend analysis, breakout validation, and precision entries. The indicator itself does not generate any signals; it only refines the visual environment so that your existing tools and decision models become more reliable.
How It Works
Micro-Price Extraction
A weighted micro-price is calculated to represent the bar's internal structure and reduce intrabar irregularities.
Adaptive Regression Filter
The state-based regression engine continuously updates price equilibrium, adjusting its confidence level. This gives the filter the ability to remain responsive during strong movements yet be stable during noisy periods.
Noise Removal & Candle Reconstruction
The difference between raw price and truePrice is considered noise. This noise is subtracted from OHLC values, and a volatility-scaled spread restores realistic wick and body proportions. What results is a candle that depicts true directional flow.
Trend Classification
A smoothed trend baseline is computed from the filtered price, and candle color is determined by whether the market is positioned above or below this equilibrium trend.
How to Use It
Identify True Trend Direction
Candles follow the cleaned price path so that you can differentiate valid trend shifts from temporary spikes or wick-driven traps.
Improve Existing Strategies
These candles will complement your existing indicators, be they Supertrend, moving averages, volume tools, or momentum oscillators, by giving you a more sound price basis.
Spot Clean Breakouts & Pullbacks
Reduced noise makes breakout structure, swing highs/lows, and retracements significantly clearer. This is particularly useful in fast markets like crypto and Forex.
Improve Entry & Exit Timing
By highlighting the underlying flow of price, ArithmaReg Candles help traders avoid false signals and pinpoint spots where the price momentum is actually changing.
Adaptable to All Timeframes & Assets
The filter is self-adjusting, so it performs consistently on scalping timeframes, intraday charts, swing setups, and all asset classes. Summary ArithmaReg Candles create a mathematically refined view of market structure by removing noise and reconstructing candles through adaptive regression. The result is a more refined, stable price representation that improves trend recognition and decision-making and enables professional-grade technical analysis.

Gap & Go Day Trading Tool - Key Levels, Alerts & Setup GradingVisualizes Gap & Go setups with automatic gap detection, pre-market levels, and breakout signals. Shows: ✅ Gap % with quality rating (5%/10%/20%+) ✅ Pre-market high/low ✅ First candle range ✅ 50% gap fill target ✅ VWAP ✅ Relative volume. Includes setup grading system (A+ to C), entry signals on PM high breakouts, and 6 customizable alerts. Perfect for momentum day traders focusing on gapping stocks.
Full Description
█ OVERVIEW
The Gap & Go indicator automatically identifies and visualizes gap trading setups - one of the most popular momentum day trading strategies. When a stock gaps up significantly from the prior close, it often signals strong buying interest and potential for continuation moves.
This indicator displays all the key levels you need to trade gaps effectively, grades setup quality, and alerts you to breakout opportunities.
█ HOW IT WORKS
The indicator calculates the gap percentage between yesterday's close and today's open, then displays critical support/resistance levels that gap traders watch:
Gap Zone → The price range between prior close and gap open
Pre-Market High/Low → Key breakout and support levels from extended hours
First Candle Range → Opening range that often defines intraday direction
50% Gap Fill → Common retracement target and support level
VWAP → Institutional reference point
█ GAP CLASSIFICATION
Gaps are automatically classified by magnitude:
🔥 Qualifying Gap (5%+) → Meets minimum threshold for gap trading
🔥🔥 Strong Gap (10%+) → Ideal gap size for momentum plays
🔥🔥🔥 Monster Gap (20%+) → Exceptional move requiring extra attention
Background color changes based on gap quality for instant visual identification.
█ SETUP GRADING SYSTEM
The indicator grades each setup from A+ to C based on multiple factors:
- Gap magnitude (qualifying vs strong)
- Relative volume (2x+ vs 5x+ average)
- Price position relative to VWAP
A+ Setup (4-5 points) → High probability
A Setup (3 points) → Good setup
B Setup (2 points) → Moderate
C Setup (0-1 points) → Weak/avoid
█ ENTRY SIGNALS
Triangle signals appear when price breaks above key levels:
▲ Lime Triangle → Breaking above Pre-Market High
▲ Aqua Triangle → Breaking above First Candle High
Signals require volume confirmation by default (configurable).
█ KEY LEVELS DISPLAYED
- Prior Close (Orange) → Gap reference point
- Pre-Market High (Lime) → Primary breakout level
- Pre-Market Low (Red) → Support if gap fails
- First Candle Range (Aqua box) → Opening range breakout levels
- 50% Gap Fill (Yellow dotted) → Common support/target
- VWAP (Purple) → Institutional pivot
█ INFO TABLE
Real-time dashboard showing:
- Gap % with quality emoji
- Relative Volume with status
- All key price levels
- Breakout status (✓ if broken)
- Distance from PM High
- Setup Grade
█ ALERTS INCLUDED
6 customizable alerts:
1. Qualifying Gap Detected (5%+)
2. Strong Gap Detected (10%+)
3. Monster Gap Detected (20%+)
4. Pre-Market High Breakout
5. First Candle High Breakout
6. 50% Gap Fill Test
7. Full Gap Fill (setup invalidated)
█ SETTINGS
Gap Settings
- Minimum gap % threshold
- Strong gap % threshold
- Monster gap % threshold
Volume Settings
- Enable/disable relative volume filter
- Minimum RVol requirement
- Strong RVol threshold
- RVol calculation period
Level Settings
- Toggle each level type on/off
- Show/hide gap zone
- Show/hide VWAP
Signal Settings
- Breakout signal type (PM High, First Candle, Both)
- Volume confirmation requirement
Visual Settings
- Info table position
- Color customization for all levels
█ HOW TO USE
1. Scan for gapping stocks pre-market (use a scanner or watchlist)
2. Apply this indicator to candidates
3. Check the Setup Grade in the info table
4. Wait for price to consolidate near pre-market high
5. Enter on breakout above PM High with volume confirmation
6. Use 50% gap fill or PM Low as stop loss reference
7. Monitor VWAP - staying above is bullish
█ BEST PRACTICES
✓ Focus on A and A+ setups
✓ Require strong relative volume (5x+)
✓ Trade in the direction of the gap (long for gap ups)
✓ Watch for gap fill as potential support
✓ Be cautious if price falls below VWAP
✓ First 30-60 minutes typically have best momentum
█ TIMEFRAME RECOMMENDATIONS
- 1-minute: Scalping, precise entries
- 5-minute: Most common for gap trading (recommended)
- 15-minute: Swing entries, less noise
█ NOTES
- Pre-market levels require extended hours data enabled
- First candle range is based on the first regular market candle
- Works on stocks, ETFs, and futures
- Gaps down are detected but focus is on gap-up setups
█ DISCLAIMER
This indicator is for educational purposes only. Gap trading involves significant risk. Past performance does not guarantee future results. Always use proper risk management and never risk more than you can afford to lose.

Smart RSI MTF Matrix [DotGain]Summary
Are you tired of trading trend signals, only to miss the bigger picture because you are focused on a single timeframe?
The Smart RSI MTF Matrix is the ultimate "Cockpit View" for momentum traders. Unlike chart overlays that can sometimes clutter your price action, this indicator organizes RSI conditions across 10 different timeframes simultaneously into a clean, separate Heatmap pane.
It monitors everything from the 5-minute chart all the way up to the 12-Month view , giving you a complete X-ray vision of the market's momentum structure instantly.
⚙️ Core Components and Logic
The Smart RSI MTF Matrix relies on a sophisticated hierarchy to deliver clear, actionable context:
Multi-Timeframe Engine: The script runs 10 independent RSI calculations in the background, organized in rows from bottom (Short Term) to top (Long Term).
Classic RSI Thresholds:
Overbought (> 70): Indicates price may be extended to the upside.
Oversold (< 30): Indicates price may be extended to the downside.
Smart Visibility System (The "Secret Sauce"): Not all signals are equal. A 5-minute signal is "noise" compared to a Yearly signal. This indicator automatically applies Transparency to differentiate importance. The visibility increases by 10% for each higher timeframe slot (Row).
🚦 How to Read the Matrix
The indicator plots dots in 10 stacked rows. The position and opacity tell you the direction and significance:
🟥 RED DOTS (Overbought Condition)
Trigger: RSI is above 70 on that specific timeframe.
Meaning: Potential bearish reversal or pullback.
🟩 GREEN DOTS (Oversold Condition)
Trigger: RSI is below 30 on that specific timeframe.
Meaning: Potential bullish reversal or bounce.
⚪ GRAY DOTS (Neutral)
Trigger: RSI is between 30 and 70.
Meaning: No extreme momentum present.
👻 TRANSPARENCY (Signal Strength)
The visibility of the dot tells you exactly which Timeframe (Row) is triggered. The higher the row, the more solid the color:
Faint (10-30% Visibility): Rows 1-3 (5m, 15m, 1h). Used for scalping entries.
Medium (40-60% Visibility): Rows 4-6 (4h, 1D, 1W). Used for swing trading context.
Solid (70-100% Visibility): Rows 7-10 (1M, 3M, 6M, 12M). Used for identifying major macro cycles.
Visual Elements
Structure: Row 1 (Bottom) represents the 5-minute timeframe. Row 10 (Top) represents the 12-Month timeframe.
Vertical Alignment: If you see a vertical column of Red or Green dots, it indicates Multi-Timeframe Confluence —a highly probable reversal point.
Key Benefit
The goal of the Smart RSI MTF Matrix is to keep your main chart clean while providing maximum information. You can instantly see if a short-term pullback (Faint Green Dot) is happening within a long-term uptrend (Solid Gray/Red Dot), allowing for precision entries.
Have fun :)
Disclaimer
This "Smart RSI MTF Matrix" indicator is provided for informational and educational purposes only. It does not, and should not be construed as, financial, investment, or trading advice.
The signals generated by this tool (both "Buy" and "Sell" indications) are the result of a specific set of algorithmic conditions. They are not a direct recommendation to buy or sell any asset. All trading and investing in financial markets involves substantial risk of loss. You can lose all of your invested capital.
Past performance is not indicative of future results. The signals generated may produce false or losing trades. The creator (© DotGain) assumes no liability for any financial losses or damages you may incur as a result of using this indicator.
You are solely responsible for your own trading and investment decisions. Always conduct your own research (DYOR) and consider your personal risk tolerance before making any trades.

Smart RSI MTF [DotGain]Summary
Are you tired of constantly switching between timeframes to check the RSI, only to miss the bigger picture?
The Smart RSI MTF (Multi-Timeframe) is designed to solve this exact problem. It is a streamlined chart overlay that monitors RSI conditions across up to 10 different timeframes simultaneously —from the 1-minute chart all the way up to the Monthly view.
This indicator removes the need for multiple open tabs and declutters your analysis by plotting signals directly on your main chart using a smart "visual hierarchy" system based on transparency.
⚙️ Core Components and Logic
The Smart RSI MTF relies on a sophisticated 3-layer logic to deliver clear, actionable context:
Multi-Timeframe Engine: The script runs 10 independent RSI calculations in the background. It checks standard intervals (5m, 15m, 1h, 4h, Daily, Weekly, Monthly) to ensure you never miss a momentum extreme on any scale.
Classic RSI Thresholds:
Overbought (> 70): Indicates price may be extended to the upside.
Oversold (< 30): Indicates price may be extended to the downside.
Smart Visibility System (The "Secret Sauce"): Not all signals are equal. A 5-minute Overbought signal is "noise" compared to a Weekly Overbought signal. This indicator automatically applies Transparency to differentiate importance:
Minutes = High Transparency (Faint).
Hours = Medium Transparency.
Days/Weeks/Months = No Transparency (Solid/Bold).
🚦 How to Read the Indicator
The indicator plots shapes (Labels by default) directly above or below the candles. The appearance tells you the direction and the timeframe significance:
🟥 RED SIGNALS (Overbought Condition)
Trigger: RSI is above 70 on a specific timeframe.
Location: Placed above the candle bar.
Meaning: Potential bearish reversal or pullback.
🟩 GREEN SIGNALS (Oversold Condition)
Trigger: RSI is below 30 on a specific timeframe.
Location: Placed below the candle bar.
Meaning: Potential bullish reversal or bounce.
👻 TRANSPARENCY (Signal Strength)
Faint/Ghostly: The signal comes from a lower timeframe (e.g., 5m, 15m). Use for scalping or entry timing.
Solid/Bright: The signal comes from a major timeframe (e.g., Daily, Weekly). Use for swing trading and identifying major market turns.
Visual Elements
Symbol Shapes: Fully customizable (Label, Diamond, Circle, Triangle, etc.) via settings.
Stacking: If multiple timeframes trigger at once, symbols will overlay, creating a visually denser and darker color, indicating Confluence .
Key Benefit
The goal of the Smart RSI MTF is to help traders instantly spot Confluence . When you see a faint short-term signal align with a solid long-term signal, you have identified a high-probability reversal zone without leaving your chart.
Have fun :)
Disclaimer
This "Smart RSI MTF" indicator is provided for informational and educational purposes only. It does not, and should not be construed as, financial, investment, or trading advice.
The signals generated by this tool (both "Buy" and "Sell" indications) are the result of a specific set of algorithmic conditions. They are not a direct recommendation to buy or sell any asset. All trading and investing in financial markets involves substantial risk of loss. You can lose all of your invested capital.
Past performance is not indicative of future results. The signals generated may produce false or losing trades. The creator (© DotGain) assumes no liability for any financial losses or damages you may incur as a result of using this indicator.
You are solely responsible for your own trading and investment decisions. Always conduct your own research (DYOR) and consider your personal risk tolerance before making any trades.

Delta Signals NO REPINTA (FINAL)📢 New Indicator: Delta Signals NO REPAINT 🔥
Introducing my new indicator based on Order Flow Delta, designed to provide buy and sell signals with absolutely NO repainting — perfect for scalping, day trading, or swing trading.
This tool combines two powerful components:
✅ Order Flow Delta — Measures the real strength between buyers and sellers
✅ Smart Trend Filter — Only shows signals in the direction of the dominant trend
Together, they deliver cleaner, more accurate and more reliable signals, with clear entry markers on the chart and a delta histogram revealing real market pressure.
🚀 What’s Included?
🔹 Buy/Sell signals with NO repaint
🔹 Intelligent delta calculation
🔹 Trend filter using moving average
🔹 Clear labels on entry points
🔹 Visual delta histogram
🔹 Works great on Crypto, Forex, Indices & Stocks
🔹 Very lightweight and fast on TradingView
🎯 Why is it powerful?
Because it doesn't rely on lagging indicators — it reads the actual imbalance between buyers and sellers, often detecting strong moves before traditional indicators do.
This type of analysis is used by professional order flow traders, but now you have it on your TradingView chart in a simple, visual format.
🔥 Perfect for:
Scalpers who need precision
Day traders working breakouts and pullbacks
Swing traders seeking strong confirmations
Traders who want clean, NO-repaint signals
If you want a version with automatic TP/SL, alerts, or full backtesting, I can publish that as well.
Just let me know. 🚀📈

MAHI Indicator v9.5 - Smart Momentum HUD + IntradayMAHI Indicator v9.5 — Smart Momentum HUD (Multi-Framework + Intraday Engine)
A Complete Momentum, Trend, and Setup Framework for Swing, Position & Intraday Traders
MAHI v9.5 is the most advanced version yet — a highly optimized, visual, multi-framework trading system that blends momentum, trend alignment, adaptive setup detection, and now Auto-Intraday Mode for short-term traders.
This indicator acts like a Heads-Up Display (HUD) on your chart: it shows trend strength, squeeze zones, dynamic support/resistance, EMAs, setup validation, and early reversal signals in one clean interface — without clutter.
✔ Core Features
📌 1. Smart Momentum Ribbon
A dynamic EMA-based momentum band that visually shifts as trend strength changes.
Helps identify strong vs. weak momentum zones
Adapts to volatility & trend slope
Works on all timeframes (1m to 1M)
📌 2. EMA 9 → 21 Flip System
A precision trend-switching signal:
EMA 9 → 21 BULL = early bullish momentum
EMA 9 → 21 BEAR = early bearish momentum
More reliable than stand-alone MA crossovers
📌 3. Bullish Setup Engine (Standard + Weak)
Automatically identifies when price is entering a reversal-ready state based on:
Position relative to the ribbon
Candle structure
Momentum compression
Slope + exhaustion conditions
Includes:
Bull Setup (Standard) — Higher probability setup
Bull Setup (Weak) — Early or less developed setup
Setup Invalidated — Confirms that the pattern failed
This prevents false confidence & keeps traders disciplined.
📌 4. Strong Buy / Strong Sell Signals
Only appear when multiple confirmations align:
Ribbon bias
EMA slope
Momentum compression
Trend alignment
Filtered to remove noise — especially in lower timeframes.
📌 5. Multi-Timeframe Trend HUD
Top-right panel summarizing:
Overall Trend (Bullish, Bearish, Neutral)
RSI Condition
Daily vs Weekly Alignment
Trading Mode Suggestions (Buy / Sell / LEAPS / Neutral)
This gives instant context.
📌 6. Auto Intraday Engine (NEW in v9.5)
Automatically switches internal logic when you move into intraday timeframes (1m–30m):
Intraday Enhancements:
Adaptive setup detection
Faster momentum sensitivity
EMAs tuned for scalp/swing precision
Tighter invalidation logic
Reduced false positives
Optional strict filtering
Perfect for scalping, day trading & micro-trends
Works instantly — no settings needed.
Just change the chart timeframe and MAHI adjusts.
📌 7. Dynamic High-Timeframe Support (W & M)
Auto-layers weekly & monthly levels:
Helps identify strong bounce zones
Extremely useful for swing & LEAPS traders
📌 8. Weekly Volume Shelf Projection
Lightweight VWAP-style level based on weekly volume aggregation.
Shows probable bottoming areas during pullbacks.
✔ Who This Indicator Is For
Perfect for:
Day traders
Swing traders
Momentum riders
LEAPS & long-term investors
Beginner traders needing a structured system
MAHI adapts to your timeframe and trading style.
✔ Why MAHI Works
MAHI isn’t a single-signal indicator — it’s a framework.
It combines:
Trend
Momentum
Volatility
Setup pattern detection
Validation & invalidation
Multi-timeframe alignment
Dynamic zones
Intraday optimization
This eliminates guesswork and helps traders avoid the emotional traps that cause most losses.
You don’t just get a signal — you get context.
✔ How to Use It
Follow the ribbon bias
Use EMA 9→21 flips as trend confirmation
Look for Bull Setup tags during pullbacks
Avoid trades when you see Setup Invalidated
Respect weekly/monthly HTF support levels
On intraday charts — rely on auto-optimized mode
For swing entries, combine setups with HTF trend HUD
MAHI gives the map. You choose the path.
✔ Final Notes
This version is heavily optimized for performance, clarity, and high-probability signals.
MAHI does not repaint, and works on all assets including:
Stocks
Crypto
ETFs
Forex
Futures

Strat Reversal MTF TableStrat Reversal MTF Table — Your Complete Multi-Timeframe Strat Command Center
Take your Strat trading to the next level with an indicator that shows every reversal, on every timeframe, in one powerful visual dashboard.
Designed for traders who demand speed, clarity, and full Strat alignment, the Strat Reversal MTF Table instantly identifies all major bullish and bearish reversal patterns:
Bullish Patterns
2-1-2
3-1-2
1-3-2
3-2-2
Bearish Patterns
2-1-2
3-1-2
1-3-2
3-2-2
Each signal is displayed with:
Clear pattern name (e.g., “2-1-2 Bull”)
Automatic trigger price
Timeframe label
Color-coded background (Bullish / Bearish / Neutral)
Whether you trade options, equities, futures, or crypto, this indicator makes it effortless to see what’s flipping — and where the strongest setups are emerging.
🔥 Key Features
📊 Multi-Timeframe Scanning (1 min → Daily)
Monitor 7 customizable timeframes at once.
From scalping to swing trading, you always know which timeframe is turning.
⚡ Real-Time OR Close-Confirmed Logic
Choose your style:
Realtime (Wick Mode) → Fast entries
Close-Confirmed → Stronger validation
Ideal for traders who want precision on any timeframe.
🎨 Clean & Customizable Dashboard
Move the table anywhere on the chart
Adjust text size
Choose your own colors
Lightweight and non-intrusive
A perfect blend of simplicity and power.
📩 Instant Alerts, Built In
Get notified instantly when:
Any timeframe reverses
A specific timeframe flips
Multiple reversals fire across the stack
The indicator works great with TradingView’s push notifications, email, and webhooks.
🎯 What This Helps You Do
✔ Catch Strat reversals as they happen
✔ Quickly spot full-timeframe alignment
✔ Improve your entries for options plays
✔ Avoid chop by reading higher-timeframe intent
✔ Trade more confidently with automated trigger levels
This indicator is built for Strat traders who want to trade smarter, faster, and cleaner.
✨ Perfect For
Strat Traders
Options Traders
Futures Scalpers
Intraday & Swing Traders
Quant/Algo-inspired traders
Anyone following Rob Smith’s methodology

Volume Spike & Second Entry (Fast Scalping)this indicator puts volume spikes on your chart which gives a good indicator of a large move

Alg0 ۞ Hal0 Triple EMA BlastFully customizable and stand-alone comprehensive indicator for scalping and short-term trading.
Cheers!
A۞H
Chop Meter + Trade Filter 1H/30M/15M (Ace PROFILE CLEAN v2)What this indicator does
Name: Chop Meter + Trade Filter 1H/30M/15M (Ace PROFILE CLEAN v2)
This is not an entry signal indicator. It’s a market condition filter:
It checks how compressed or expanded price is on
1H, 30M, and 15M.
It labels each TF as CHOP or NORMAL.
If 2 or more of those are in CHOP, it prints NO TRADE.
If 0 or 1 are in CHOP, it prints TRADE.
You use it to answer one question:
“Is this a session I should be pushing the button,
or is this a day to sit on my hands?”
How it works (simple version)
For each timeframe (1H, 30M, 15M), the script:
Looks back N bars (ATR length).
Measures:
ATR over N bars
Price range over N bars (highest high − lowest low)
Computes a compression value:
compression = ATR / range.
Then it compares that to the Threshold:
If compression > threshold → CHOP (market boxed / compressed)
If compression ≤ threshold → NORMAL (market expanded / trending)
Finally:
It counts how many TFs are CHOP.
If 2 or 3 TFs are CHOP → NO TRADE.
If 0 or 1 TFs are CHOP → TRADE.
Inputs / Profiles
At the top you see:
Profile
Overnight 4/0.40 – for Asia / London / overnight sessions
NYO 5/0.45 – for New York Open profile (default)
Custom – lets you type your own values
When Custom is selected, you can set:
ATR Length (Custom) – how many bars to use in the compression calc
Chop Threshold (ATR ÷ Range) (Custom) – where you cut between CHOP vs NORMAL
Higher threshold → more bars counted as NORMAL, less CHOP
Lower threshold → more bars counted as CHOP, fewer TRADE environments
For NYO, you normally keep:
Profile = NYO 5/0.45
(ATR over 5 bars, threshold 0.45)
What you see on the chart
A single line panel at the bottom-right, like:
1H: NORMAL | 30M: CHOP | 15M: NORMAL | TRADE | NYO 5/0.45
Meaning:
1H: NORMAL → the last 1H window is expanded enough (not boxed).
30M: CHOP → 30M is compressed (inside a tighter range).
15M: NORMAL → 15M has opened up.
TRADE → Only 1 TF is CHOP, so the majority says OK to trade.
NYO 5/0.45 → just a tag to remind which profile you’re using.
If instead you see:
1H: CHOP | 30M: CHOP | 15M: NORMAL | NO TRADE | NYO 5/0.45
That means:
1H and 30M are boxed
15M opened a bit, but 2 TFs are CHOP
Final verdict: NO TRADE environment
How to use it in your trading
1. As a gatekeeper before any entry model
No matter what entry you use (MSS + FVG, OB, purge setups, etc.):
If the panel says NO TRADE →
You do not open new positions.
You’re in “observe only” mode.
You can still study price, mark levels, and journal, but you’re not pressing the button.
If the panel says TRADE →
The environment is acceptable.
Now you can look for your entry model (e.g. MSS + FVG retest, SMT, OB, etc.).
Think of it as your first filter every session:
“Panel says NO TRADE? I don’t care how good the candle looks – I’m waiting.”
2. Reading each timeframe
1H: CHOP → Day is still boxed on the higher frame; big expansion hasn’t kicked in.
30M: CHOP → Classic 30M dealing range; many fake breaks and wicks likely.
15M: CHOP → Intraday still coiling; scalping environment at best.
When 2 or 3 say CHOP, expect:
Whipsaw
MSS both ways
Failed FVGs
News spikes that die in the box
Perfect time to protect your psychology and capital.
When 2 or 3 say NORMAL, expect:
Cleaner swings
Better follow-through after MSS / FVG
Easier to hold for targets
3. How it pairs with your MSS/FVG indicator
With your Chop + MSS/FVG Retest indicator:
Chop meter = environment filter
MSS/FVG indicator = entry trigger
Your process becomes:
Check chop meter:
If NO TRADE → hands off.
If TRADE → go to step 2.
On your chart, wait for:
Purge / SMT at the edges
MSS in the right direction
FVG + retest
Only take L/S when both:
Chop meter = TRADE, and
Entry model = L/S signal in the right area (premium/discount).
That way, you’re not just trading every L/S the MSS script spits out—you’re trading L/S only when the higher-timeframe environment is worth it.

Dynamic S&R Projector [Polarity Flip]Support and Resistance should not be static. It should tell a story.
Most traders clutter their charts with manually drawn lines, often forgetting which ones were important or which timeframe they came from. This indicator automates the entire process of identifying market structure, adapting dynamically to your trading style while using Volume Price Analysis (VPA) to separate "Smart Money" levels from random noise.
It combines three professional concepts into one tool: Multi-Timeframe Projection, Volume Strength Filtering, and Live Polarity Flipping.
Who is this for?
Day Traders: Project Daily levels onto your 1-minute or 5-minute charts. Stop trading in a vacuum; see the walls before you hit them.
Swing Traders: Project Weekly levels onto your Daily chart to find major trend reversals.
Investors: Project Monthly levels to identify multi-year accumulation zones.
Core Features
1. Smart Timeframe (Auto-Detection) No more toggling settings. The indicator detects what chart you are viewing and automatically projects the next significant Higher Timeframe (HTF) structure:
Viewing Intraday (< Daily)? → Projects Daily Pivots.
Viewing Daily? → Projects Weekly Pivots.
Viewing Weekly? → Projects Monthly Pivots.
2. VPA Strength Filtering (The "Truth" Serum) Not all levels are equal. This script grades every pivot based on the volume activity at the moment it was formed:
Thick Solid Line: Formed on High Volume (>1.5x Average). This is an "Institutional Level." Expect hard bounces.
Thin Dashed Line: Formed on Low Volume. This is a weak structure.
3. Live Polarity Flip (Support ↔ Resistance) The script monitors price action in real-time to respect the "Principle of Polarity."
Wick Protection: The color change is based strictly on the Candle Close. If price wicks through a level but closes back inside, the line retains its original color (rejecting the fakeout).
The Flip: Once price successfully closes past a level, the color instantly flips (Red becomes Green, or Green becomes Red) to indicate the new market state.
How to Trade This Indicator (Example Strategies)
Strategy A: The "Concrete Wall" Bounce (Day & Swing) Identify a Thick Green Line below the current price. This represents a Strong HTF Support defended by institutional volume.
Action: Set Limit Buy orders at the line or wait for a bullish reversal candle (Hammer) to form at the touch.
Strategy B: The "Paper Wall" Breakout (Momentum) Identify price approaching a Thin Dashed Red Line (Weak Resistance).
Action: Since this level lacks volume backing, do not fade it. Look for a breakout setup as price is likely to slice through easily.
Strategy C: The "Flip & Retest" (Trend Following) Watch for a Thick Red Line to turn Green. This means resistance has been conquered.
Action: Wait for price to pull back to this new Green line. If it holds (the line stays Green), enter long. You are now using the "roof" as a "floor."
Settings Guide
Calculation Mode:
Auto (Higher TF): The recommended "Smart" mode described above.
Use Current Chart: Finds pivots on the exact timeframe you are viewing (good for scalping structure).
Fixed Manual: Locks the projection to a specific timeframe (e.g., always show Daily).
Pivot Lookback (Sensitivity):
Default (10/10): Balances major and minor structure.
Higher (20/20): Shows only the most critical major market turns.
Max Number of Lines: Limits how many historical levels are shown to keep your chart clean.
***********************************************************************************************
Disclaimer: This tool is for educational purposes and decision support. Past volume and price action do not guarantee future results. Always manage your risk.

Pre-Market ORB Break and Retest - Institutional═══════════════════════════════════
PRE-MARKET ORB BREAK AND RETEST - INSTITUTIONAL
═══════════════════════════════════
Free professional Pre-Market Opening Range Breakout indicator from QuantCrawler - your AI-powered futures trading analysis platform.
Built as a free resource for the trading community. Support us at quantcrawler.com and on YouTube @AutomateWithAaron.
═══════════════════════════════════
📊 HOW IT WORKS
1. Captures the 8:00-8:15 AM ET pre-market range where institutional investors position
2. Draws OR High, OR Low, and Midpoint levels on your chart
3. Waits for market open at 9:30 AM EST before detecting breakouts
4. Fires LONG/SHORT entry signals when price retests the OR midpoint after breakout
═══════════════════════════════════
✓ FEATURES
- Runs on 1m or 5m charts - captures 15m pre-market range automatically
- Zone marked at 8:15 AM, trades trigger after 9:30 AM market open
- Universal - works on futures, forex, stocks, and crypto
- Customizable sessions - NY, London, Asia, or any custom timeframe
- Adjustable breakout distance to match your instrument
- Clean visual signals - only shows actionable entries
- Session end time stops monitoring after market close
═══════════════════════════════════
⚙️ SETTINGS
- Breakout Distance (Points): Distance outside OR zone to confirm breakout
- Timezone: Select your trading session
- Opening Range Time: Pre-market positioning window (default 8:00-8:15)
- Session End Time: When to stop monitoring (default 16:00)
═══════════════════════════════════
🎯 IDEAL FOR
Day traders who defend institutional positioning levels. The 8:00-8:15 AM range captures where smart money positions before retail market open, giving you an edge on key support/resistance zones.
═══════════════════════════════════
🚀 WANT MORE?
This indicator pairs perfectly with QuantCrawler's AI-powered chart analysis:
- Multi-timeframe futures analysis (15m/5m/1m scalping, 4H/1H/30m intraday, 1D/4H/1H swing)
- Precision entry points, stop losses, and profit targets
- Confidence scoring for every setup
- Covers futures, forex, and crypto markets
Visit quantcrawler.com to see how AI can level up your trading.
═══════════════════════════════════
⚠️ DISCLAIMER
This indicator is for educational purposes only. Past performance does not guarantee future results. Always use proper risk management and never risk more than you can afford to lose.
═══════════════════════════════════
Built with ❤️ by Aaron at QuantCrawler
quantcrawler.com | AI-Powered Futures Trading Analysis

15m ORB BREAK AND RETEST - MIDPOINT═══════════════════════════════════
15m ORB BREAK AND RETEST - MIDPOINT
═══════════════════════════════════
Free professional 15-minute Opening Range Breakout indicator from QuantCrawler - your AI-powered futures trading analysis platform.
Built as a free resource for the trading community. Support us at quantcrawler.com and on YouTube @AutomateWithAaron.
═══════════════════════════════════
📊 HOW IT WORKS
1. Captures the 15-minute Opening Range (default: 9:30-9:45 AM ET)
2. Draws OR High, OR Low, and Midpoint levels on your chart
3. Detects breakouts when price closes beyond the OR zone + your specified distance
4. Fires LONG/SHORT entry signals when price retests the OR midpoint after breakout
═══════════════════════════════════
✓ FEATURES
- Runs on 1m or 5m charts - captures 15m opening range automatically
- Universal - works on futures, forex, stocks, and crypto
- Customizable sessions - NY, London, Asia, or any custom timeframe
- Adjustable breakout distance to match your instrument
- Clean visual signals - only shows actionable entries
- Session end time stops monitoring after market close
═══════════════════════════════════
⚙️ SETTINGS
- Breakout Distance (Points): Distance outside OR zone to confirm breakout
- Timezone: Select your trading session
- Opening Range Time: First 15 minutes to capture (default 9:30-9:45)
- Session End Time: When to stop monitoring (default 16:00)
═══════════════════════════════════
🎯 IDEAL FOR
Day traders and swing traders who prefer wider opening ranges for reduced noise. The 15-minute OR provides more stable support/resistance levels compared to 5m setups.
═══════════════════════════════════
🚀 WANT MORE?
This indicator pairs perfectly with QuantCrawler's AI-powered chart analysis:
- Multi-timeframe futures analysis (15m/5m/1m scalping, 4H/1H/30m intraday, 1D/4H/1H swing)
- Precision entry points, stop losses, and profit targets
- Confidence scoring for every setup
- Covers futures, forex, and crypto markets
Visit quantcrawler.com to see how AI can level up your trading.
═══════════════════════════════════
⚠️ DISCLAIMER
This indicator is for educational purposes only. Past performance does not guarantee future results. Always use proper risk management and never risk more than you can afford to lose.
═══════════════════════════════════
Built with ❤️ by Aaron and QuantCrawler
quantcrawler.com | AI-Powered Futures Trading Analysis

8FigRenko – Precision FVG Zones8FigRenko – Pure FVG Zones is a clean, reliable Fair Value Gap tool designed for traders who want accurate FVG zones only from the chart timeframe — without repainting, without higher-timeframe complications, and without messy borders.
This script is built for traders who want simple, precise, and visually clean imbalance zones that work the way FVGs should work:
🔥 Features
✔ Chart-timeframe FVGs only
No request.security, no multi-TF artifacts, no lagging or repainting.
The script reads exactly what your chart shows and never mixes timeframes.
✔ Wick-based or Body-based detection
Use classic ICT wick gaps, or switch to body-only gaps with one click.
✔ Minimum FVG size (points)
Filters out noise by requiring a minimum point distance (default: 5 points).
Great for futures and fast intraday charts.
✔ Clean, seamless boxes (no borders)
The FVG zones are rendered with borderless boxes, matching the modern style shown in institutional imbalance tools.
✔ Proper “end-to-end” FVG drawing
Each gap box starts from the origin of the imbalance and extends forward automatically.
✔ Auto-disrespect removal
FVGs are automatically deleted when price invalidates the zone:
Bullish FVG removed if close < FVG low
Bearish FVG removed if close > FVG high
No clutter. No manual cleanup.
✔ Extend zones forever or to the current bar
Choose if your FVGs run across the full future chart or just up to the latest candle.
✔ Optional: show only most recent FVG
Great for scalping or IFV (Immediate Fair Value) strategies.

Flux-Tensor Singularity [FTS]Flux-Tensor Singularity - Multi-Factor Market Pressure Indicator
The Flux-Tensor Singularity (FTS) is an advanced multi-factor oscillator that combines volume analysis, momentum tracking, and volatility-weighted normalization to identify critical market inflection points. Unlike traditional single-factor indicators, FTS synthesizes price velocity, volume mass, and volatility context into a unified framework that adapts to changing market regimes.
This indicator identifies extreme market conditions (termed "singularities") where multiple confirming factors converge, then uses a sophisticated scoring system to determine directional bias. It is designed for traders seeking high-probability setups with built-in confluence requirements.
THEORETICAL FOUNDATION
The indicator is built on the premise that market time is not constant - different market conditions contain varying levels of information density. A 1-minute bar during a major news event contains far more actionable information than a 1-minute bar during overnight low-volume trading. Traditional indicators treat all bars equally; FTS does not.
The theoretical framework draws conceptual parallels to physics (purely as a mental model, not literal physics):
Volume as Mass: Large volume represents significant market participation and "weight" behind price moves. Just as massive objects have stronger gravitational effects, high-volume moves carry more significance.
Price Change as Velocity: The rate of price movement through price space represents momentum and directional force.
Volatility as Time Dilation: When volatility is high relative to its historical norm, the "information density" of each bar increases. The indicator weights these periods more heavily, similar to how time dilates near massive objects in physics.
This is a pedagogical metaphor to create a coherent mental model - the underlying mathematics are standard financial calculations combined in a novel way.
MATHEMATICAL FRAMEWORK
The indicator calculates a composite singularity value through four distinct steps:
Step 1: Raw Singularity Calculation
S_raw = (ΔP × V) × γ²
Where:
ΔP = Price Velocity = close - close
V = Volume Mass = log(volume + 1)
γ² = Time Dilation Factor = (ATR_local / ATR_global)²
Volume Transformation: Volume is log-transformed because raw volume can have extreme outliers (10x-100x normal). The logarithm compresses these spikes while preserving their significance. This is standard practice in volume analysis.
Volatility Weighting: The ratio of short-term ATR (5 periods) to long-term ATR (user-defined lookback) is squared to create a volatility amplification factor. When local volatility exceeds global volatility, this ratio increases, amplifying the raw singularity value. This makes the indicator regime-aware.
Step 2: Normalization
The raw singularity values are normalized to a 0-100 scale using a stochastic-style calculation:
S_normalized = ((S_raw - S_min) / (S_max - S_min)) × 100
Where S_min and S_max are the lowest and highest raw singularity values over the lookback period.
Step 3: Epsilon Compression
S_compressed = 50 + ((S_normalized - 50) / ε)
This is the critical innovation that makes the sensitivity control functional. By applying compression AFTER normalization, the epsilon parameter actually affects the final output:
ε < 1.0: Expands range (more signals)
ε = 1.0: No change (default)
ε > 1.0: Compresses toward 50 (fewer, higher-quality signals)
For example, with ε = 2.0, a normalized value of 90 becomes 70, making threshold breaches rarer and more significant.
Step 4: Smoothing
S_final = EMA(S_compressed, smoothing_period)
An exponential moving average removes high-frequency noise while preserving trend.
SIGNAL GENERATION LOGIC
When the tensor crosses above the upper threshold (default 90) or below the lower threshold (default 10), an extreme event is detected. However, the indicator does NOT immediately generate a buy or sell signal. Instead, it analyzes market context through a multi-factor scoring system:
Scoring Components:
Price Structure (+1 point): Current bar bullish/bearish
Momentum (+1 point): Price higher/lower than N bars ago
Trend Context (+2 points): Fast EMA above/below slow EMA (weighted heavier)
Acceleration (+1 point): Rate of change increasing/decreasing
Volume Multiplier (×1.5): If volume > average, multiply score
The highest score (bullish vs bearish) determines signal direction. This prevents the common indicator failure mode of "overbought can stay overbought" by requiring directional confirmation.
Signal Conditions:
A BUY signal requires:
Extreme event detection (tensor crosses threshold)
Bullish score > Bearish score
Price confirmation: Bullish candle (optional, user-controlled)
Volume confirmation: Volume > average (optional, user-controlled)
Momentum confirmation: Positive momentum (optional, user-controlled)
A SELL signal requires the inverse conditions.
INPUTS EXPLAINED - Core Parameters:
Global Horizon (Context): Default 20. Lookback period for normalization and volatility comparison. Higher values = smoother but less responsive. Lower values = more signals but potentially more noise.
Tensor Smoothing: Default 3. EMA period applied to final output. Removes "quantum foam" (high-frequency noise). Range 1-20.
Singularity Threshold: Default 90. Values above this (or below 100-threshold) trigger extreme event detection. Higher = rarer, stronger signals.
Signal Sensitivity (Epsilon): Default 1.0. Post-normalization compression factor. This is the key innovation - it actually works because it's applied AFTER normalization. Range 0.1-5.0.
Signal Interpreter Toggles:
Require Price Confirmation: Default ON. Only generates buy signals on bullish candles, sell signals on bearish candles. Reduces false signals but may delay entry.
Require Volume Confirmation: Default ON. Only signals when volume > average. Critical for stocks/crypto, less important for forex (unreliable volume data).
Use Momentum Filter: Default ON. Requires momentum agreement with signal direction. Prevents counter-trend signals.
Momentum Lookback: Default 5. Number of bars for momentum calculation. Shorter = more responsive, longer = trend-following bias.
Visual Controls:
Colors: Customizable colors for bullish flux, bearish flux, background, and event horizon.
Visual Transparency: Default 85. Master control for all visual elements (accretion disk, field lines, particles, etc.). Range 50-99. Signals and dashboard have separate controls.
Visibility Toggles: Individual on/off switches for:
Gravitational field lines (trend EMAs)
Field reversals (trend crossovers)
Accretion disk (background gradient)
Singularity diamonds (neutral extreme events)
Energy particles (volume bursts)
Event horizon flash (extreme event background)
Signal background flash
Signal Size: Tiny/Small/Normal triangle size
Signal Offsets: Separate controls for buy and sell signal vertical positioning (percentage of price)
Dashboard Settings:
Show Dashboard: Toggle on/off
Position: 9 placement options (all corners, centers, middles)
Text Size: Tiny/Small/Normal/Large
Background Transparency: 0-50, separate from visual transparency
VISUAL ELEMENTS EXPLAINED
1. Accretion Disk (Background Gradient):
A three-layer gradient background that intensifies as the tensor approaches extremes. The outer disk appears at any non-neutral reading, the inner disk activates above 70 or below 30, and the core layer appears above 85 or below 15. Color indicates direction (cyan = bullish, red = bearish). This provides instant visual feedback on market pressure intensity.
2. Gravitational Field Lines (EMAs):
Two trend-following EMAs (10 and 30 period) visualized as colored lines. These represent the "curvature" of market trend - when they diverge, trend is strong; when they converge, trend is weakening. Crossovers mark potential trend reversals.
3. Field Reversals (Circles):
Small circles appear when the fast EMA crosses the slow EMA, indicating a potential trend change. These are distinct from extreme events and appear at normal market structure shifts.
4. Singularity Diamonds:
Small diamond shapes appear when the tensor reaches extreme levels (>90 or <10) but doesn't meet the full signal criteria. These are "watch" events - extreme pressure exists but directional confirmation is lacking.
5. Energy Particles (Dots):
Tiny dots appear when volume exceeds 2× average, indicating significant participation. Color matches bar direction. These highlight genuine high-conviction moves versus low-volume drifts.
6. Event Horizon Flash:
A golden background flash appears the instant any extreme threshold is breached, before directional analysis. This alerts you to pay attention.
7. Signal Background Flash:
When a full buy/sell signal is confirmed, the background flashes cyan (buy) or red (sell). This is your primary alert that all conditions are met.
8. Signal Triangles:
The actual buy (▲) and sell (▼) markers. These only appear when ALL selected confirmation criteria are satisfied. Position is offset from bars to avoid overlap with other indicators.
DASHBOARD METRICS EXPLAINED
The dashboard displays real-time calculated values:
Event Density: Current tensor value (0-100). Above 90 or below 10 = critical. Icon changes: 🔥 (extreme high), ❄️ (extreme low), ○ (neutral).
Time Dilation (γ): Current volatility ratio squared. Values >2.0 indicate extreme volatility environments. >1.5 = elevated, >1.0 = above average. Icon: ⚡ (extreme), ⚠ (elevated), ○ (normal).
Mass (Vol): Log-transformed volume value. Compared to volume ratio (current/average). Icon: ● (>2× avg), ◐ (>1× avg), ○ (below avg).
Velocity (ΔP): Raw price change. Direction arrow indicates momentum direction. Shows the actual price delta value.
Bullish Flux: Current bullish context score. Displayed as both a bar chart (visual) and numeric value. Brighter when bullish score dominates.
Bearish Flux: Current bearish context score. Same visualization as bullish flux. These scores compete - the winner determines signal direction.
Field: Trend direction based on EMA relationship. "Repulsive" (uptrend), "Attractive" (downtrend), "Neutral" (ranging). Icon: ⬆⬇↔
State: Current market condition:
🚀 EJECTION: Buy signal active
💥 COLLAPSE: Sell signal active
⚠ CRITICAL: Extreme event, no directional confirmation
● STABLE: Normal market conditions
HOW TO USE THE INDICATOR
1. Wait for Extreme Events:
The indicator is designed to be selective. Don't trade every fluctuation - wait for tensor to reach >90 or <10. This alone is not a signal.
2. Check Context Scores:
Look at the Bullish Flux vs Bearish Flux in the dashboard. If scores are close (within 1-2 points), the market is indecisive - skip the trade.
3. Confirm with Signals:
Only act when a full triangle signal appears (▲ or ▼). This means ALL your selected confirmation criteria have been met.
4. Use with Price Structure:
Combine with support/resistance levels. A buy signal AT support is higher probability than a buy signal in the middle of nowhere.
5. Respect the Dashboard State:
When State shows "CRITICAL" (⚠), it means extreme pressure exists but direction is unclear. These are the most dangerous moments - wait for resolution.
6. Volume Matters:
Energy particles (dots) and the Mass metric tell you if institutions are participating. Signals without volume confirmation are lower probability.
MARKET AND TIMEFRAME RECOMMENDATIONS
Scalping (1m-5m):
Lookback: 10-14
Smoothing: 5-7
Threshold: 85
Epsilon: 0.5-0.7
Note: Expect more noise. Confirm with Level 2 data. Best on highly liquid instruments.
Intraday (15m-1h):
Lookback: 20-30 (default settings work well)
Smoothing: 3-5
Threshold: 90
Epsilon: 1.0
Note: Sweet spot for the indicator. High win rate on liquid stocks, forex majors, and crypto.
Swing Trading (4h-1D):
Lookback: 30-50
Smoothing: 3
Threshold: 90-95
Epsilon: 1.5-2.0
Note: Signals are rare but high conviction. Combine with higher timeframe trend analysis.
Position Trading (1D-1W):
Lookback: 50-100
Smoothing: 5-7
Threshold: 95
Epsilon: 2.0-3.0
Note: Extremely rare signals. Only trade the most extreme events. Expect massive moves.
Market-Specific Settings:
Forex (EUR/USD, GBP/USD, etc.):
Volume data is unreliable (spot forex has no centralized volume)
Disable "Require Volume Confirmation"
Focus on momentum and trend filters
News events create extreme singularities
Best on 15m-1h timeframes
Stocks (High-Volume Equities):
Volume confirmation is CRITICAL - keep it ON
Works excellently on AAPL, TSLA, SPY, etc.
Morning session (9:30-11:00 ET) shows highest event density
Earnings announcements create guaranteed extreme events
Best on 5m-1h for day trading, 1D for swing trading
Crypto (BTC, ETH, major alts):
Reduce threshold to 85 (crypto has constant high volatility)
Volume spikes are THE primary signal - keep volume confirmation ON
Works exceptionally well due to 24/7 trading and high volatility
Epsilon can be reduced to 0.7-0.8 for more signals
Best on 15m-4h timeframes
Commodities (Gold, Oil, etc.):
Gold responds to macro events (Fed announcements, geopolitical events)
Oil responds to supply shocks
Use daily timeframe minimum
Increase lookback to 50+
These are slow-moving markets - be patient
Indices (SPX, NDX, etc.):
Institutional volume matters - keep volume confirmation ON
Opening hour (9:30-10:30 ET) = highest singularity probability
Strong correlation with VIX - high VIX = more extreme events
Best on 15m-1h for day trading
WHAT MAKES THIS INDICATOR UNIQUE
1. Post-Normalization Sensitivity Control:
Unlike most oscillators where sensitivity controls don't actually work (they're applied before normalization, which then rescales everything), FTS applies epsilon compression AFTER normalization. This means the sensitivity parameter genuinely affects signal frequency. This is a novel implementation not found in standard oscillators.
2. Multi-Factor Confluence Requirement:
The indicator doesn't just detect "overbought" or "oversold" - it detects extreme conditions AND THEN analyzes context through five separate factors (price structure, momentum, trend, acceleration, volume). Most indicators are single-factor; FTS requires confluence.
3. Volatility-Weighted Normalization:
By squaring the ATR ratio (local/global), the indicator adapts to changing market regimes. A 1% move in a low-volatility environment is treated differently than a 1% move in a high-volatility environment. Traditional indicators treat all moves equally regardless of context.
4. Volume Integration at the Core:
Volume isn't an afterthought or optional filter - it's baked into the fundamental equation as "mass." The log transformation handles outliers elegantly while preserving significance. Most price-based indicators completely ignore volume.
5. Adaptive Scoring System:
Rather than fixed buy/sell rules ("RSI >70 = sell"), FTS uses competitive scoring where bullish and bearish evidence compete. The winner determines direction. This solves the classic problem of "overbought markets can stay overbought during strong uptrends."
6. Comprehensive Visual Feedback:
The multi-layer visualization system (accretion disk, field lines, particles, flashes) provides instant intuitive feedback on market state without requiring dashboard reading. You can see pressure building before extreme thresholds are hit.
7. Separate Extreme Detection and Signal Generation:
"Singularity diamonds" show extreme events that don't meet full criteria, while "signal triangles" only appear when ALL conditions are met. This distinction helps traders understand when pressure exists versus when it's actionable.
COMPARISON TO EXISTING INDICATORS
vs. RSI/Stochastic:
These normalize price relative to recent range. FTS normalizes (price change × log volume × volatility ratio) - a composite metric, not just price position.
vs. Chaikin Money Flow:
CMF combines price and volume but lacks volatility context and doesn't use adaptive normalization or post-normalization compression.
vs. Bollinger Bands + Volume:
Bollinger Bands show volatility but don't integrate volume or create a unified oscillator. They're separate components, not synthesized.
vs. MACD:
MACD is pure momentum. FTS combines momentum with volume weighting and volatility context, plus provides a normalized 0-100 scale.
The specific combination of log-volume weighting, squared volatility amplification, post-normalization epsilon compression, and multi-factor directional scoring is unique to this indicator.
LIMITATIONS AND PROPER DISCLOSURE
Not a Holy Grail:
No indicator is perfect. This tool identifies high-probability setups but cannot predict the future. Losses will occur. Use proper risk management.
Requires Confirmation:
Best used in conjunction with price action analysis, support/resistance levels, and higher timeframe trend. Don't trade signals blindly.
Volume Data Dependency:
On forex (spot) and some low-volume instruments, volume data is unreliable or tick-volume only. Disable volume confirmation in these cases.
Lagging Components:
The EMA smoothing and trend filters are inherently lagging. In extremely fast moves, signals may appear after the initial thrust.
Extreme Event Rarity:
With conservative settings (high threshold, high epsilon), signals can be rare. This is by design - quality over quantity. If you need more frequent signals, reduce threshold to 85 and epsilon to 0.7.
Not Financial Advice:
This indicator is an analytical tool. All trading decisions and their consequences are solely your responsibility. Past performance does not guarantee future results.
BEST PRACTICES
Don't trade every singularity - wait for context confirmation
Higher timeframes = higher reliability
Combine with support/resistance for entry refinement
Volume confirmation is CRITICAL for stocks/crypto (toggle off only for forex)
During major news events, singularities are inevitable but direction may be uncertain - use wider stops
When bullish and bearish flux scores are close, skip the trade
Test settings on your specific instrument/timeframe before live trading
Use the dashboard actively - it contains critical diagnostic information
Taking you to school. — Dskyz, Trade with insight. Trade with anticipation.
