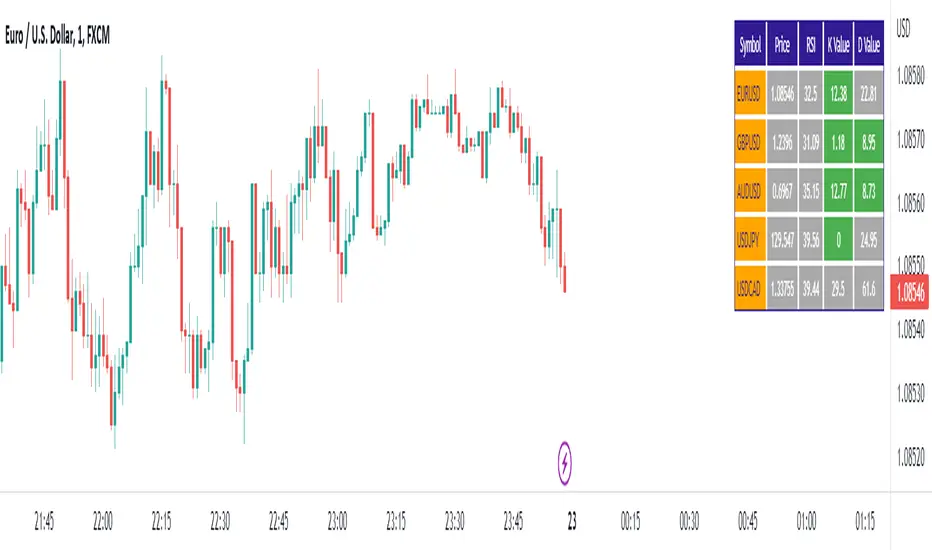
Stochastic RSI ScreenerStochastic RSI Screener is built as an indicator and can be applied to any chart.
It gives users the ability to choose 5 specific symbols to watch and then specify the required options to change the RSI and Stochastic settings in a way that fits their needs.
This screener shows the values of (CURRENT PRICE, RSI, K-VALUE, D-VALUE) for each one of the specified symbols. It will do the calculations based on the currently opened timeframe for all symbols.
在脚本中搜索"screener"
ORB PSAR MTF Screener+ 1.0The parabolic SAR is a technical indicator used to determine the price direction of an asset, as well as draw attention to when the price direction is changing.
Sometimes known as the "stop and reversal system," the parabolic SAR was developed by J. Welles Wilder Jr., creator of the relative strength index (RSI).
PSAR can itself prove to be great trading strategy if it is used on a multiple timeframe.
This indicator contains the followings:
1. A Screener to process multiple stocks at one go to show possible trades
2. MTF plotting of trading signals for individual stocks as well as list of stocks
3. Alert system to inform you of possible trade setups
4. Auto selection of best MTF for trades
5. Strength Candle markings.
6. Configurable options to customise as per your need.
The indicator works on the 1 Min, 5Min, 30Min, 1Hr, 4Hr, Daily, Monthly setups.
Due to TradingView restrictions and MTF usages, the screener can process a list of only 14 symbols. However , you can use the alerts option to define multiple lists of 14 stocks.
Enjoy!

Multi timeframe Stochastic RSI Screener by noop42Here is a custom x4 timeframes Stochastic RSI screener to add on your charts.
Options
Repaint mode : if enabled: values are updated in live, if disabled: values are updated once the concerned candle is closed
Default parameters
Timeframes: 1, 5, 15, 60
Repaint mode: enabled
Notes
Use the lowest timeframe configured on the screener to get real values
A classic x3 multi-timeframe Stochastic RSI indicator is also available

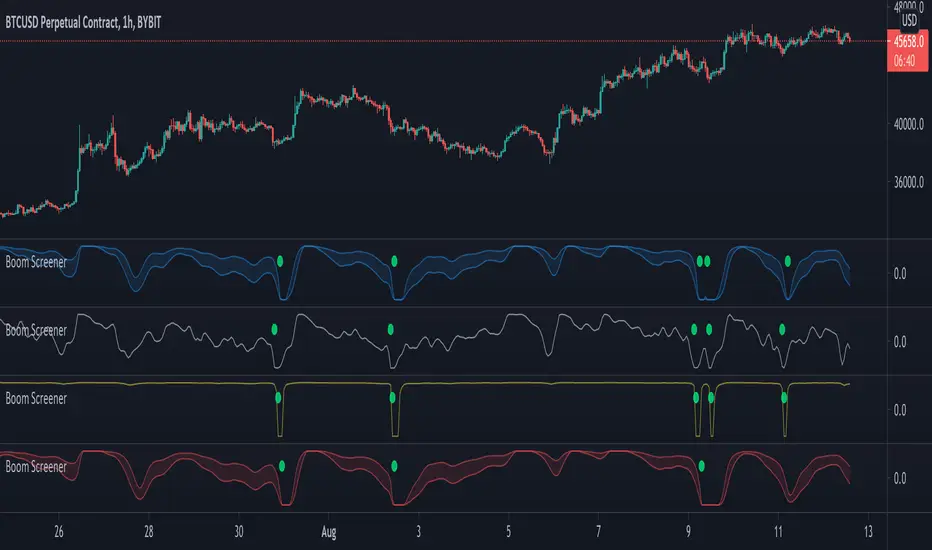
Boom Hunter - Entry Point Screener AlertsStock screener for Boom Hunter and Boom Hunter Pro entry zones. This script will screen 18 different stocks for entry zones.
1. Enter in any ticker ID's from charts you wish to scan in the settings.
2. Go to desired timeframe.
3. Click add alert button at top toolbar.
4. Select Boom Screener indicator, input alert notification settings and/or change alert name and click create.
The script will then scan the stocks and alert you of any entry zones from the timeframe you set the alerts.
A new alert needs to be created for each timeframe you wish to screen.
[Zekis]ScreenerA simple screener that scan thru multiple pairs for a setup.
The screener have as example an EMA 50 cross, so you have to change it with your indicator/strategy.
You can use a maximum of 40 security() function, right now there are 20, so you can have a total of 40 pairs.

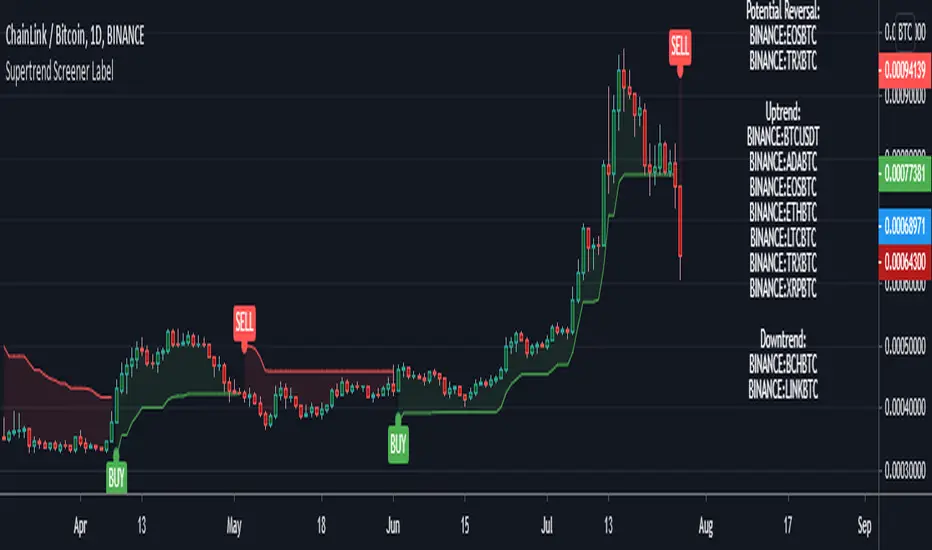
Supertrend Screener LABELThis screens for Supertrend reversal's in 10 different securities. The main logic for the screener is taken from "Simple Custom Screener in Pinescript" by QuantNomad with his permission. If the label color is not visible due to the text in it being white colored, then choose a different color from settings. Also added a simple supertrend to it.
Terminology explanation:
Confirmed Reversal: Supertrend reversal that happened in the last bar and cannot be repainted.
Potential Reversal: Supertrend reversal that might happen in the current bar but can also not happen depending upon the timeframe closing price.
Uptrend/Downtrend : Shows all the tickers that are either currently in uptrend or downtrend.
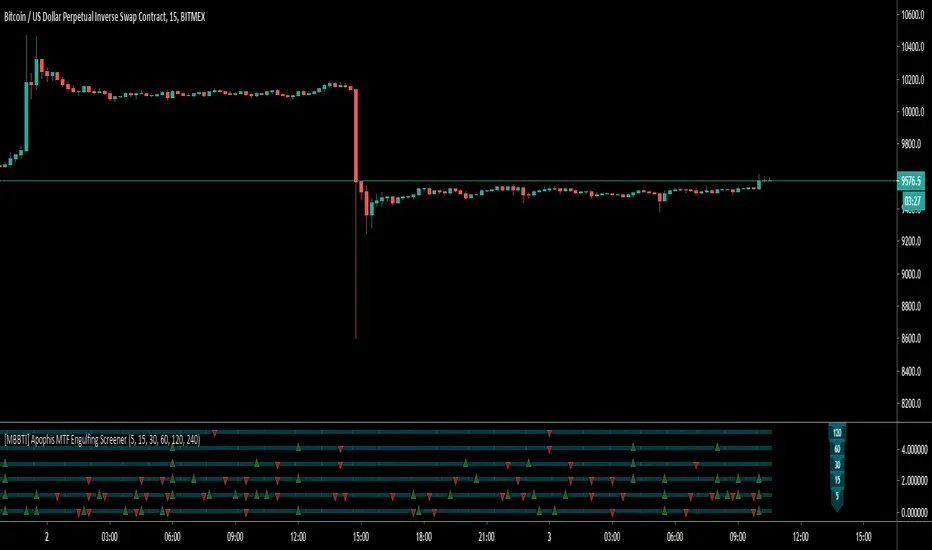
[MBBTI] Apophis MTF Engulfing ScreenerHello Traders,
Apophis MTF Engulfing Screener is based on Daveatt's Engulfing Screener and will screen for engulfing candles on multible time frames. It can help detecting not obvious engulfing candles.
How it works?
- choose your preferable time frames
- green triangle up -> bullish engulfing on this time frame
- red triangle down -> bearish engulfing on this time frame
Contact me if you have any questions or change requests
Wuuzzaa
Flag Screener [QuantVue]Flag Screener is a screening tool that identify bull and bear flags in up to 40 different symbols.
The indicator takes a comma separated list of symbols and then scans the symbols in real time to detect bull or bear flags.
What are flags
Flags are continuation patterns that occur within the general trend of the security. A bull flag represents a temporary pause or consolidation before price resumes it's upward movement, while a bear flag occurs before price continues its downward movement.
Both flag patterns consist of two components:
The Pole
The Flag
The pole is the initial strong upward surge or decline that precedes the flag. The pole is usually a fast move accompanied by heavy volume signaling significant buying or selling pressure.
The flag is then formed as price consolidates after the initial surge or decline from the pole. For a bull flag price will drift slightly downward to sideways, a bear flag will drift upward to sideways. The best flags often see volume dry up during this phase of the pattern.
Indicator Settings
Both components are fully customizable in the indicator so the user can adjust for any time frame or volatility. Select the minimum and maximum accepted limits from the % gain loss required for the pole, the maximum acceptable flag depth or rally and the minimum and maximum number of bars for each component.

RSI Screener / Heatmap - By LeviathanThis script allows you to quickly scan the market by displaying the RSI values of up to 280 tickers at once and visualizing them in an easy-to-understand format using labels with heatmap coloring.
📊 Source
The script can display the RSI from a custom timeframe (MTF) and custom length for the following data:
- Price
- OBV (On Balance Volume)
- Open Interest (for crypto tickers)
📋 Ticker Selection
This script uses a different approach for selecting tickers. Instead of inputting them one by one via input.symbol(), you can now copy-paste or edit a list of tickers in the text area window. This approach allows users to easily exchange ticker lists between each other and, for example, create multiple lists of tickers by sector, market cap, etc., and easily input them into the script. Full credit to @allanster for his functions for extracting tickers from the text. Users can switch between 7 groups of 40 tickers each, totaling 280 tickers.
🖥️ Display Types
- Screener with Labels: Each ticker has its own color-coded label located at its RSI value.
- Group Average RSI: A standard RSI plot that displays the average RSI of all tickers in the group.
- RSI Heatmap (coming soon): Color-coded rows displaying current and historical values of tickers.
- RSI Divergence Heatmap (coming soon): Color-coded rows displaying current and historical regular/hidden bullish/bearish divergences for tickers.
🎨 Appearance
Appearance is fully customizable via user inputs, allowing you to change heatmap/gradient colors, zone coloring, and more.

Crypto Daily WatchList And Screener [M]
Hi, this is a watchlist and screener indicator designed for traders in the field of cryptocurrencies who want to monitor developments in other currency pairs and indices.
The indicator consists of two tables. One of them is the table containing indices such as BTC dominance, total, total2, which allows you to track market developments and changes. In this table, you will find price information, daily change, stochastic, and trend information.
The other table includes cryptocurrencies like BTC/USDT, ETH/USDT, DOT/USDT, and more. In this table, you will see real-time prices, daily volume, daily change, stochastic, the correlation coefficient between the pair and Bitcoin, and the trend value calculated based on MACD.
The "Customize" section in the settings enables you to personalize the appearance of the tables according to your preferences.

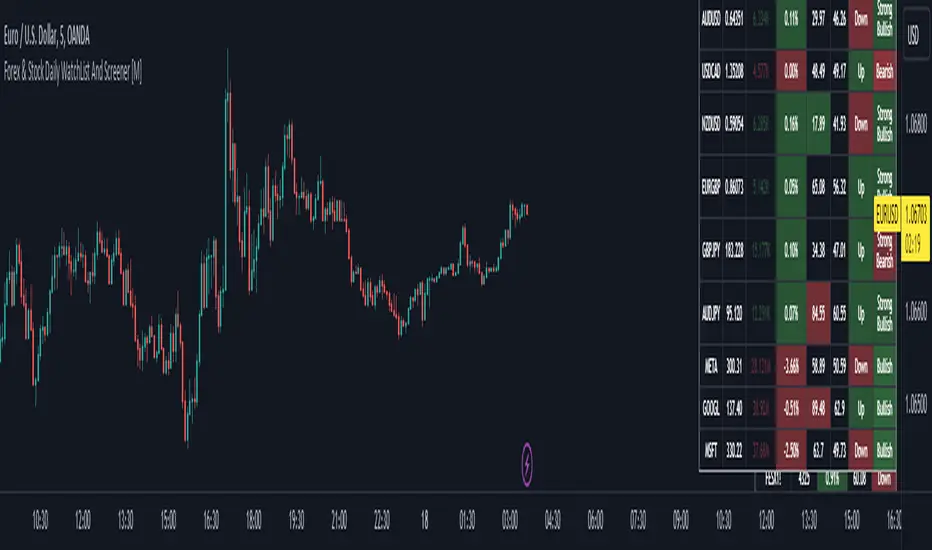
Forex & Stock Daily WatchList And Screener [M]Hi, this is a watchlist and screener indicator for Forex and Stocks.
This indicator is designed for traders who trade in the forex markets and monitor developments in indices and other currency pairs.
It includes information on 14 indices such as the volatility index, Baltic dry index, etc. You can customize the indices as you wish. The indices table contains the index's price (or points), daily change, stochastic value, and trend direction.
The second table is designed for trading forex and stock currency pairs.
In this table, you will find information such as price, volume, change, stochastic, RSI, trend direction, and MACD result for all traded pairs. You can customize all the currency pairs in this table as you wish, and you can also tailor the oscillator settings to your preferences.
In the settings section, you can use checkboxes to hide the pairs in both tables.
The "Customize" section in the settings allows you to personalize the table appearances according to your preferences.
GDCA ScreenerThis is upgrated system for Screener to DCA from "Grospector DCA V.3".
This has 5 zone Extreme high , high , normal , low , Extreme low. You can dynamic set min - max percent every zone.
Extreme zone is derivative short and long which It change Extreme zone to Normal zone all position will be closed.
Every Zone is splitted 10 channel. and this strategy calculate contribution.
and now can predict price in future.
Price Type: Allows the user to select the price type (open, high, low, close) for calculations.
ALL SET
Length MA for normal zone: The length of the moving average used in the normal zone.
Length for strong zone: The length of the moving average used in the strong zone, which is averaged from the normal zone moving average.
Multiple for Short: The multiplication factor applied to determine the threshold for the short zone.
Multiple for Strong Sell: The multiplication factor applied to determine the threshold for the strong sell zone.
Multiple for Sell Zone: The multiplication factor applied to determine the threshold for the sell zone.
Multiple for Buy Zone: The multiplication factor applied to determine the threshold for the buy zone.
Multiple for Strong Buy: The multiplication factor applied to determine the threshold for the strong buy zone.
Multiple for Long: The multiplication factor applied to determine the threshold for the long zone.
ZONE
Start Short Zone %: The start percentage of the short zone.
End Short Zone %: The end percentage of the short zone.
Start Sell Zone %: The start percentage of the sell zone.
End Sell Zone %: The end percentage of the sell zone.
Start Normal Zone %: The start percentage of the normal zone.
End Normal Zone %: The end percentage of the normal zone.
Start Buy Zone %: The start percentage of the buy zone.
End Buy Zone %: The end percentage of the buy zone.
Start Long Zone %: The start percentage of the long zone.
End Long Zone %: The end percentage of the long zone.
DISPLAY
Show Price: Controls the visibility of the price column in the display table.
Show Mode: Controls the visibility of the mode column in the display table.
Show GDCA: Controls the visibility of the GDCA column in the display table.
Show %: Controls the visibility of the percentage column in the display table.
Show Short: Controls the visibility of the short column in the display table.
Show Strong Sell: Controls the visibility of the strong sell column in the display table.
Show Sell: Controls the visibility of the sell column in the display table.
Show Buy: Controls the visibility of the buy column in the display table.
Show Strong Buy: Controls the visibility of the strong buy column in the display table.
Show Long: Controls the visibility of the long column in the display table.
Show Suggestion Trend: Controls the visibility of the suggestion trend column in the display table.
Show Manual Custom Code: Controls the visibility of the manual custom code column in the display table.
Show Dynamic Trend: Controls the visibility of the dynamic trend column in the display table.
Symbols: Boolean parameters that control the visibility of individual symbols in the display table.
Mode: Integer parameters that determine the mode for each symbol, specifying different settings or trends.
My mindset has been customed = AAPL , MSFT
To effectively make the DCA plan, I recommend adopting a comprehensive strategy that takes into consideration your mindset as the best indicator of the optimal approach. By leveraging your mindset, the task can be made more manageable and adaptable to any market
Dollar-cost averaging (DCA) is a suitable investment strategy for sound money and growth assets which It is Bitcoin, as it allows for consistent and disciplined investment over time, minimizing the impact of market volatility and potential risks associated with market timing

Divergence Screener [Mr_Zed]Divergence Screener
This script allows you to scan multiple assets and timeframes for bullish and bearish divergences based on the RSI (Relative Strength Index) indicator.
Features
Supports up to 40 different assets and timeframes for simultaneous scanning.
Customizable settings for RSI period and source.
Adjustable lookback periods for identifying pivot highs and pivot lows.
Flexible range limits for filtering divergences based on the number of bars since the last pivot point.
Alerts for bullish and bearish divergences on confirmed bars.

Candle Combo ScreenerThe Candle Combo Screener allows you to see candlestick combinations for up to 5 different tickers at the same time . If one of the candle combination is detected the corresponding cell will be highlighted to alert you.
Candle Combinations Detected
Bullish Kicker
Bullish & Bearish Oops Reversals
Open Equals High / Low
Inside Day
Select any 5 tickers. Colors and table settings are fully customizable to fit your style.
Bullish Kicker
The opening price of the current candle gaps up above the body of the prior day's candle AND the prior day's candle close was less than the open.
Oops Reversals
Bullish: Price opens below the prior day’s low and closes above.
Bearish: Price opens above the prior day's high and closes below.
Open Equals High / Low
The current candles opening price is equal to either the high or low of the day.
Inside Day
The current candles high and low are contained within the prior day's high and low.

Multi Timeframe Stochastic RSI ScreenerThis script is also a Stochastic RSI Screener, but it allows users to choose one specific symbol and three timeframes of that symbol to monitor at once.

TradingCube : Crypto : Pivot ScreenerThe Crypto Pivot Screener is a real-time scanner of a list of top crypto assets.
You can use the indicator to monitor the pivots of about 40 crypto assets.
At least once a month, I will update the List of Crypto assets.
The indicator includes three types of pivots . Classic, Fibonacci, and Standard.
You have the option to select between Daily, Weekly, and Monthly time frames as well

Sectors ScreenerThis screener compares the corresponding market sectors in relation to the complete market.
If a sector rises or falls equal to the market, the value is on the dashed line.
If a sector rises faster or falls slower than the market, the sector's line is green and above the dashed line.
If a sector falls faster or rises slower than the market, the sector's line is red and below the dashed line.

Relative Volume Screener AlertsThis script will screen 12 different stocks and current chart (13 in total) for entry points from my relative volume indicator.
1. Enter in any ticker ID's from charts you wish to scan in the settings.
2. Go to desired timeframe.
3. Click add alert button at top toolbar.
4. Select RVOL Screener Alerts indicator, input alert notification settings and/or change alert name and click create.
The script will then scan the stocks and alert you of any entry points from the timeframe you set the alerts.
A new alert needs to be created for each timeframe you wish to screen.
You can find my relative volume indicator here:

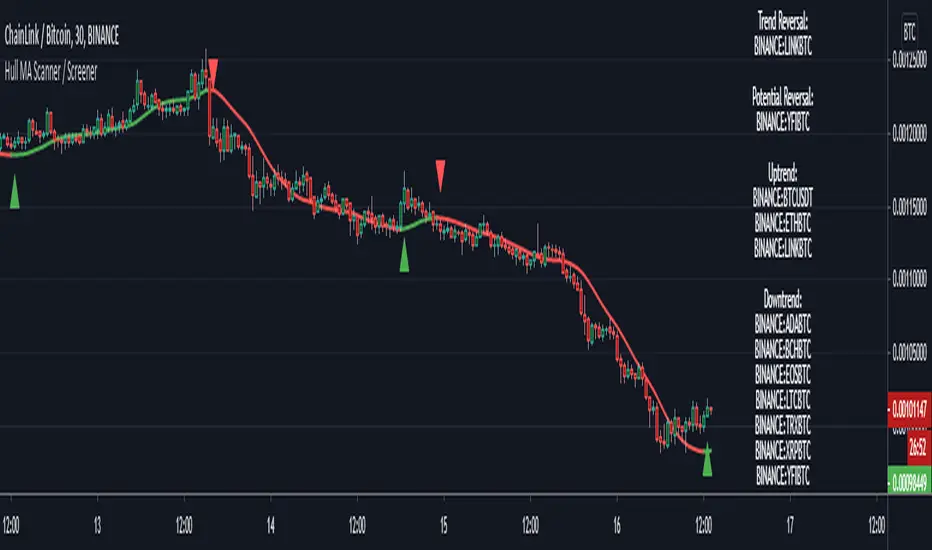
Hull MA Scanner / Screener LabelThis screens for Hull MA trend reversal's in 10 different securities. If the label color is not visible due to the text in it being white colored, then choose a different color from settings. Also added a simple HullMA to it. If want can increase it upto 40 securities in the code which is upto user to decide.
This was requested by soderstromkenan in comments and looked like a nice idea so decided to make it.
The Hull MA logic is from "Hull50" by u/RafaelZioni with his permission. Screener logic from u/Quantnomad with his permission.
BORSACA SCANNER SCREENER ANALYS EXPLORER DASHBOARDBORSACA SCANNER SCREENER ANALYS EXPLORER DASHBOARD
This is a signal scanner for your portfolio. You can add your stocks, fx, crypto and analys for buy and sell signal.
You can set up in settings trend strategy. And you can follow the Borsaca Trader indicator buy and sell signal.
You can watch 20 pair on one indicator. You can create more template and watch more a custom layout for signals :) Yeah
This is the best. Good luck.


