Scalping Strategy (5min)This indicator is designed for scalping strategies on a 5-minute timeframe. It generates signals based on two RSI crossovers and incorporates moving averages to identify trends. Additionally, a Bollinger Band is included to eliminate the need for an additional Bollinger Band on the chart.
Please note that this indicator does not guarantee 100% accurate signals and may produce false signals. It is recommended to use this indicator in conjunction with other indicators such as Stochastic, MACD, SuperTrend, or any other suitable indicators to enhance the accuracy of trading decisions.
1) Signal Generation: The indicator generates buy and sell signals based on two RSI crossovers. A buy signal is generated when the fast RSI crosses above the slow RSI, indicating potential bullish momentum. Conversely, a sell signal is generated when the fast RSI crosses below the slow RSI, suggesting potential bearish momentum.
2) To adjust the indicator to your specific chart and trading preferences, you have the flexibility to modify the RSI and moving average (MA) values. By changing the RSI values (slow RSI length and fast RSI length), you can fine-tune the sensitivity of the RSI crossovers to suit different timeframes and market conditions. Similarly, adjusting the MA values (slow MA period and fast MA period) allows you to adapt the indicator to the desired trend identification and short-term trend confirmation.
3) Pay attention to trades that are confirmed by the short-term moving average (MA) aligning with the desired direction. For buy signals, ensure that the short MA is tending upward, indicating a potential uptrend. For sell signals, confirm that the short MA is trending downward, suggesting a potential downtrend.
4) Moving Averages: The indicator uses a 200-period moving average (MA) to identify the overall trend and a short-term MA for additional confirmation.
5) Bollinger Band: The included Bollinger Band is not directly used in the indicator's calculations. However, it is provided for convenience so that users don't need to add another Bollinger Band to their chart separately.
6) Exercise caution when the short MA is below the 200-period MA but showing signs of attempting an upward move. These situations may indicate a potential reversal or consolidation, and it is advisable to avoid taking trades solely based on the 200-period MA crossover in such cases.
Remember that these guidelines are intended to provide additional insights and should be used in combination with your trading judgment and analysis.
在脚本中搜索"supertrend"

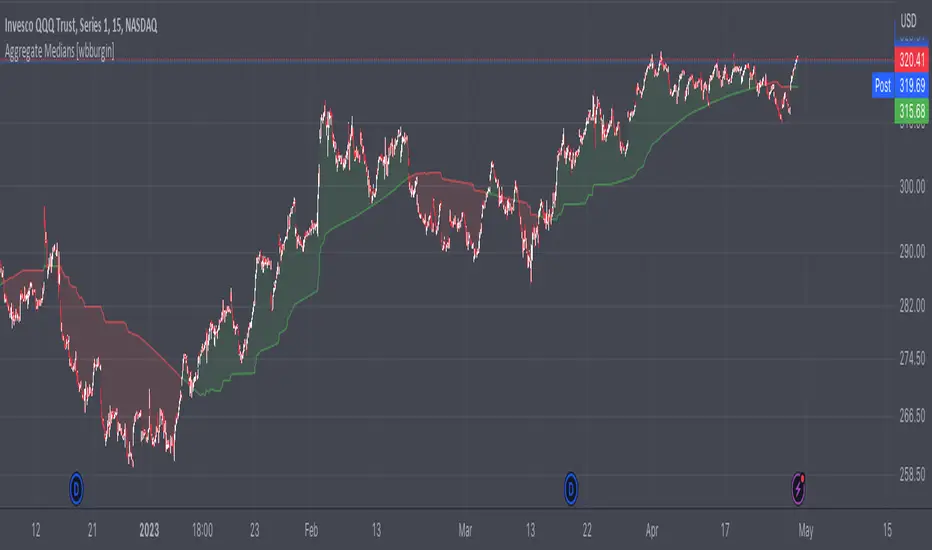
Aggregate Medians [wbburgin]This indicator recursively finds the average of all high/low medians under your chosen length. This can be very, very helpful for analyzing trends where a moving average or a normal median would produce a bunch of false signals.
Settings:
The "Length" setting is the maximum median that you want the algorithm to add into the sum. The "Start at Period" setting is the the minimum median that you want the algorithm to take into account. Starting at a higher period means that the faster, more sensitive medians of lower lengths are not included, and will smooth out your curve.
I haven't seen many recursive algorithms on TradingView so feel free to use this script as inspiration for any of your ideas. In theory, you can essentially replace the median function with any other function - a moving average, a supertrend, or anything else.
The start must be lower than the length, because this is a sum from the start to the length of all medians in between.
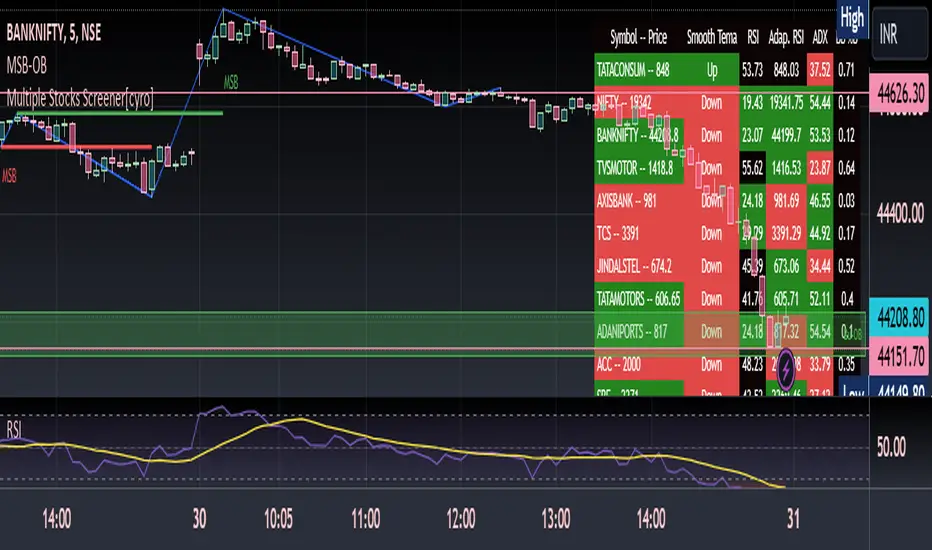
Multiple Indicators ScreenerThis is a stock screener that incorporates open source code by QuantNomad, with the addition of slow and fast EMA pullback and crossover functions. It is designed for intraday scalping and quick trades, using 1, 3, and 5 minute candles. The RSI, Supertrend, and ADX indicators help to confirm trade setups, and the use of discount, premium, and equilibrium zones can improve results. With the ability to screen 40 stocks, the screener ensures that no quick action is missed. ]
Disclaimer
It is important to note that any trade initiated using this screener should be well researched, as the creator is not responsible for any profit or loss incurred.
PSAR-Support ResistanceParabolic Support Resistance -PSAR SR is based on the Dynamic Reversal Points of Price. This indicator eliminates the false signals of regular Parabolic SAR (Stop and Reverse). The Price of previous SAR Reversal point is plotted as Support and Resistance. The idea is to trade only after the previous reversal point is crossed and a new candle formation above / below the support resistance lines.
Price moves sideways in between the S/R Lines mostly.
Buy and Sell Signals are based on normal P-SAR settings however this S/R must be considered. Please be aware that the indicator cannot be used as a stand alone. Please make required confirmations before going into action.
Disclaimer: Please use it at your own Risk.

CVD - Cumulative Volume Delta (Chart)█ OVERVIEW
This indicator displays cumulative volume delta (CVD) as an on-chart oscillator. It uses intrabar analysis to obtain more precise volume delta information compared to methods that only use the chart's timeframe.
The core concepts in this script come from our first CVD indicator , which displays CVD values as plot candles in a separate indicator pane. In this script, CVD values are scaled according to price ranges and represented on the main chart pane.
█ CONCEPTS
Bar polarity
Bar polarity refers to the position of the close price relative to the open price. In other words, bar polarity is the direction of price change.
Intrabars
Intrabars are chart bars at a lower timeframe than the chart's. Each 1H chart bar of a 24x7 market will, for example, usually contain 60 bars at the lower timeframe of 1min, provided there was market activity during each minute of the hour. Mining information from intrabars can be useful in that it offers traders visibility on the activity inside a chart bar.
Lower timeframes (LTFs)
A lower timeframe is a timeframe that is smaller than the chart's timeframe. This script utilizes a LTF to analyze intrabars, or price changes within a chart bar. The lower the LTF, the more intrabars are analyzed, but the less chart bars can display information due to the limited number of intrabars that can be analyzed.
Volume delta
Volume delta is a measure that separates volume into "up" and "down" parts, then takes the difference to estimate the net demand for the asset. This approach gives traders a more detailed insight when analyzing volume and market sentiment. There are several methods for determining whether an asset's volume belongs in the "up" or "down" category. Some indicators, such as On Balance Volume and the Klinger Oscillator , use the change in price between bars to assign volume values to the appropriate category. Others, such as Chaikin Money Flow , make assumptions based on open, high, low, and close prices. The most accurate method involves using tick data to determine whether each transaction occurred at the bid or ask price and assigning the volume value to the appropriate category accordingly. However, this method requires a large amount of data on historical bars, which can limit the historical depth of charts and the number of symbols for which tick data is available.
In the context where historical tick data is not yet available on TradingView, intrabar analysis is the most precise technique to calculate volume delta on historical bars on our charts. This indicator uses intrabar analysis to achieve a compromise between simplicity and accuracy in calculating volume delta on historical bars. Our Volume Profile indicators use it as well. Other volume delta indicators in our Community Scripts , such as the Realtime 5D Profile , use real-time chart updates to achieve more precise volume delta calculations. However, these indicators aren't suitable for analyzing historical bars since they only work for real-time analysis.
This is the logic we use to assign intrabar volume to the "up" or "down" category:
• If the intrabar's open and close values are different, their relative position is used.
• If the intrabar's open and close values are the same, the difference between the intrabar's close and the previous intrabar's close is used.
• As a last resort, when there is no movement during an intrabar and it closes at the same price as the previous intrabar, the last known polarity is used.
Once all intrabars comprising a chart bar are analyzed, we calculate the net difference between "up" and "down" intrabar volume to produce the volume delta for the chart bar.
█ FEATURES
CVD resets
The "cumulative" part of the indicator's name stems from the fact that calculations accumulate during a period of time. By periodically resetting the volume delta accumulation, we can analyze the progression of volume delta across manageable chunks, which is often more useful than looking at volume delta accumulated from the beginning of a chart's history.
You can configure the reset period using the "CVD Resets" input, which offers the following selections:
• None : Calculations do not reset.
• On a fixed higher timeframe : Calculations reset on the higher timeframe you select in the "Fixed higher timeframe" field.
• At a fixed time that you specify.
• At the beginning of the regular session .
• On trend changes : Calculations reset on the direction change of either the Aroon indicator, Parabolic SAR , or Supertrend .
• On a stepped higher timeframe : Calculations reset on a higher timeframe automatically stepped using the chart's timeframe and following these rules:
Chart TF HTF
< 1min 1H
< 3H 1D
<= 12H 1W
< 1W 1M
>= 1W 1Y
Specifying intrabar precision
Ten options are included in the script to control the number of intrabars used per chart bar for calculations. The greater the number of intrabars per chart bar, the fewer chart bars can be analyzed.
The first five options allow users to specify the approximate amount of chart bars to be covered:
• Least Precise (Most chart bars) : Covers all chart bars by dividing the current timeframe by four.
This ensures the highest level of intrabar precision while achieving complete coverage for the dataset.
• Less Precise (Some chart bars) & More Precise (Less chart bars) : These options calculate a stepped LTF in relation to the current chart's timeframe.
• Very precise (2min intrabars) : Uses the second highest quantity of intrabars possible with the 2min LTF.
• Most precise (1min intrabars) : Uses the maximum quantity of intrabars possible with the 1min LTF.
The stepped lower timeframe for "Less Precise" and "More Precise" options is calculated from the current chart's timeframe as follows:
Chart Timeframe Lower Timeframe
Less Precise More Precise
< 1hr 1min 1min
< 1D 15min 1min
< 1W 2hr 30min
> 1W 1D 60min
The last five options allow users to specify an approximate fixed number of intrabars to analyze per chart bar. The available choices are 12, 24, 50, 100, and 250. The script will calculate the LTF which most closely approximates the specified number of intrabars per chart bar. Keep in mind that due to factors such as the length of a ticker's sessions and rounding of the LTF, it is not always possible to produce the exact number specified. However, the script will do its best to get as close to the value as possible.
As there is a limit to the number of intrabars that can be analyzed by a script, a tradeoff occurs between the number of intrabars analyzed per chart bar and the chart bars for which calculations are possible.
Display
This script displays raw or cumulative volume delta values on the chart as either line or histogram oscillator zones scaled according to the price chart, allowing traders to visualize volume activity on each bar or cumulatively over time. The indicator's background shows where CVD resets occur, demarcating the beginning of new zones. The vertical axis of each oscillator zone is scaled relative to the one with the highest price range, and the oscillator values are scaled relative to the highest volume delta. A vertical offset is applied to each oscillator zone so that the highest oscillator value aligns with the lowest price. This method ensures an accurate, intuitive visual comparison of volume activity within zones, as the scale is consistent across the chart, and oscillator values sit below prices. The vertical scale of oscillator zones can be adjusted using the "Zone Height" input in the script settings.
This script displays labels at the highest and lowest oscillator values in each zone, which can be enabled using the "Hi/Lo Labels" input in the "Visuals" section of the script settings. Additionally, the oscillator's value on a chart bar is displayed as a tooltip when a user hovers over the bar, which can be enabled using the "Value Tooltips" input.
Divergences occur when the polarity of volume delta does not match that of the chart bar. The script displays divergences as bar colors and background colors that can be enabled using the "Color bars on divergences" and "Color background on divergences" inputs.
An information box in the lower-left corner of the indicator displays the HTF used for resets, the LTF used for intrabars, the average quantity of intrabars per chart bar, and the number of chart bars for which there is LTF data. This is enabled using the "Show information box" input in the "Visuals" section of the script settings.
FOR Pine Script™ CODERS
• This script utilizes `ltf()` and `ltfStats()` from the lower_tf library.
The `ltf()` function determines the appropriate lower timeframe from the selected calculation mode and chart timeframe, and returns it in a format that can be used with request.security_lower_tf() .
The `ltfStats()` function, on the other hand, is used to compute and display statistical information about the lower timeframe in an information box.
• The script utilizes display.data_window and display.status_line to restrict the display of certain plots.
These new built-ins allow coders to fine-tune where a script’s plot values are displayed.
• The newly added session.isfirstbar_regular built-in allows for resetting the CVD segments at the start of the regular session.
• The VisibleChart library developed by our resident PineCoders team leverages the chart.left_visible_bar_time and chart.right_visible_bar_time variables to optimize the performance of this script.
These variables identify the opening time of the leftmost and rightmost visible bars on the chart, allowing the script to recalculate and draw objects only within the range of visible bars as the user scrolls.
This functionality also enables the scaling of the oscillator zones.
These variables are just a couple of the many new built-ins available in the chart.* namespace.
For more information, check out this blog post or look them up by typing "chart." in the Pine Script™ Reference Manual .
• Our ta library has undergone significant updates recently, including the incorporation of the `aroon()` indicator used as a method for resetting CVD segments within this script.
Revisit the library to see more of the newly added content!
Look first. Then leap.

VF-ST-EMA-CPRVolatility and Fibonacci table helps to identify support and resistance for the day/week. Similarly, the CPR (Central Pivot Range) table helps to identify the support and resistance for the day/week. Additionally use SUpertrend and EMA to identify trends.
Disclaimer:
This indicator is for educational or study purposes. There is no recommendation to buy or sell any scrip here. Take your own risks and rewards and you are only
responsible for any outcome after using this indicator.

Multi PivotsThis script is meant for day traders. It's based on the CPR concepts. The pivots plots based on the timeframe, means less that 15minuts it will plot daily pivots, less that daily tf, it plots weekly and then monthly. It also includes Camarillas, ADR levels, Fibonacci levels based on last 500 candles, Fib pivots, Pivot zones, developing pivot, Vwap, Dashboard shows RSI,ADX,Vwap,SuperTrend and day price difference. Options available to plot Day HighLow, Initial Balance levels as well. There is option to show running CPR which highlights virgin CPR. It can plot next day pivots as well
I dont own any of codes or ideas in the script. Codes are taken from different scripts and altered based on the requirements. Kudos to all the great pinecoders who provided their codes as public which helps everyone. Thanks

Attrition Scalper v2.0Green/Red Arrowed Buy/Sell signals are just simple buy sell signals based on SuperTrend, VWAP, Bollinger, Linear Regression
Purple Arrowed Buy/Sell Signals happen when the price/candle cross over or under the yellow outer lines (4.236 fib lines) It's extremely rare and hard for price to stay above these lines therefore we can usually and comfortably buy/sell it, a key information here though when price pumps or dumps super fast and hard to the point of crossing these borders, the trend might also be extremely strong and continous so even if the price temporarily goes back inside the borders as the lines expand over time price can continue riding or crossing these lines back again and continue the uptrend/downtrend, therefore crossing these outer borders doesn't necessarilly and always mean a reversal is due.
When analyzing the instrument you're trading the important factors for support/resistance areas are usually the outer lines like i said previously it's super hard for price to be outside these and will almost always get back inside quickly. The Middle thicker green/red line which is Variable Index Dynamic Average should also be a nice pivot line for major support and resistance . All the other lines are also important dynamic support/resistance lines.
Their Importance Order
1- Outer Yellow Line (4.236 Fibs)
2- Thicker Middle Green/Red Line (VIDYA)
3- Thinner Upper/Lower Green/Red Line (VIDYA +3, VIDYA -3)
4- The Rest Of The Lines (Fib Lines)
You can use this indicator in any market condition in any market to determine key support/resistance levels, use it for mean reversion through price expanding to outside of the most outer line therefore being overbought/oversold basically using the purple buy/sell signals or only follow the normal buy/sell signals or use it in confluence with each other. You can also use this indicator in confluence with your own manual technical analysis or other indicators/strategies you are already using and are comfortable with.
A good part is the support/resistance lines from timeframe to timeframe pictures the whole situation quite well, you can use lower timeframe to find your entry/exit positions and higher timeframe to find your key support/resistance points, they all should be somewhat in confluence from timeframe to timeframe anyways. My recommendation would be to look at 1HR, 4HR and 1D charts for swing trading and 5-15 Min for quick scalping/day trading
You should still probably at least take a look to higher timeframes so that you don't get burned when you realize there is a huge resistance line at price XXXXX on the 4 hour chart but you're expecting it to go above it on the 5 minute chart, it can go above it temporarily but we analyze everything on a closing basis so it most likely won't close above it. Again don't take a position or FOMO when price breaks a support/resistance line, we're looking for a CLOSE above/below them and a retest to see if S/R flip happened would even be better.
Sometimes the most outer line won't be the 4.236 (Yellow) lines as when it gets quite volatile the Thinner Upper/Lower Green/Red Lines (VIDYA +3, VIDYA-3) might cross them to be the most outer line, in this case i have observed that the trend is extremely strong this time price almost always doesn't go above or below the VIDYA line but can stay outside of the Yellow 4.236 Fib line for an extended amount of time (price will still get back inside the channel relatively quickly, just not as fast as the normal condition)
With Proper Risk Management and Discipline this indicator can be of great use to you as it's surprisingly successful especially at mean reversion and pointing out the support/resistance lines, they are so much more successful than your average MA/EMA lines.


Range Detector Indicator [Misu]█ This indicator shows an upper and lower band based on Highs and Lows.
Depending on this, the indicator interprets a ranging market, an uptrend or a downtrend.
█ Usages:
The purpose of this indicator is to identify when the price is ranging.
It's also used to identify changes in trends, breaking points, and trend reversals.
But it can also be used to show resistance or support levels.
█ Features:
> Price Action Change Alerts
> Price Action Change Labels
> Color Bars
> Show Bands
█ Parameters:
Deviation: A parameter used to calculate pivots.
Depth: A parameter used to calculate pivots.
Activate Range Detection: Check the box to activate range detection.
Band% Offset: A factor that is used to vary the bands offset.


Ultimate IndicatorThis is a combination of all the price chart indicators I frequently switch between. It contains my day time highlighter (for day trading), multi-timeframe long-term trend indicator for current commodity in the bottom right, customizable trend EMA which also has multi-timeframe drawing capabilities, VWAP, customizable indicators with separate settings from the trend indicator including: EMA, HL2 over time, Donchian Channels, Keltner Channels, Bollinger Bands, and Super Trend. The settings for these are right below the trend settings and can have their length and multiplier adjusted. All of those also have multi-timeframe capabilities separate from the trend multi-time settings.
The Day Trade Highlight option will draw faint yellow between 9:15-9:25, red between 9:25-9:45, yellow between 9:45-10:05. There will be one white background at 9:30am to show the opening of the market. while the market is open there will be a very faint blue background. For the end of the day there will be yellow between 15:45-15:50, red between 15:50-16:00, and yellow between 16:00-16:05. During the night hours, there is no coloring. The purpose of this highlight is to show the opening / closing times of the market and the hot times for large moves.
The indicators can also be colored in the following ways:
1. Simple = Makes all colors for the indicator Gray
2. Trend = Will use the Donchian Channels to get the short-trend direction and by default will color the short-term direction as Blue or Red. Unless using Super Trend, the Donchian Channel is used to find short-term trend direction.
3. Trend Adv = Will use the Donchian Channels to get the short-trend direction and by default will color the short-term direction as Blue or Red. Unless using Super Trend, the Donchian Channel is used to find short-term trend direction. If there is a short-term up-trend during a long-term down-trend, the Blue will become Navy. If short-term down-trend during long-term up-trend, the Red will be Brown.
4. Squeeze = Compares the Bollinger Bands width to the Keltner Channels width and will color based on relative squeeze of the market: Teal = no squeeze. Yellow = little squeeze. Red = decent squeeze. White = huge squeeze. if you do not understand this one, try drawing the Bollinger Bands while using the Squeeze color option and it should become more apparent how this works. I also recommend leaving the length and multiplier to the default 20 and 2 if using this setting and only changing the timeframe to get longer/shorter lengths as I've seen that changing the length or multiplier can more or less make it not work at all.
Along with the indicator settings are options to draw lines/labels/fills for the indicator. I enjoy having only fills for a cleaner look.
The Labels option will show Buy/Sell signals when the short-term trend flips to agree with the long-term trend.
The Trend Bars option will do the same as the Labels option but instead will color the bars white when a Buy/Sell option is given.
The Range Bars option shows will color a bar white when the Close of a candle is outside of a respective ranging indicator option (Bollinger or Keltner).
The Trend Bars will draw white candles no matter which indicator selection you make (even "Off"). However, Range Bars will only draw white when either Bollinger or Keltner are selected.
The Donchian Channels and Super Trend are trending indicators and should be used during trending markets. I like to use the MACD in conjunction with these indicators for possibly earlier entries.
The Bollinger Bands and Keltner Channel are ranging indicators and should be used during ranging markets. I like to use the RSI in conjunction with these indicators and will use 60/40 for overbought and oversold areas rather than 70/30. During a range, I wait for an overbought or oversold indication and will buy/sell when it crosses back into the middle area and close my position when it touches the opposite band.
I have a MACD/RSI combination indicator if you'd like that as well :D
As always, trade at your own risk. This is not some secret indicator that will 100% win. As always, the trades you see in the picture use a 1:1.5 or 1:2 risk to reward ratio, for today (August 8, 2022) it won 5/6 times with one trade still open at the end of the day. Manage your account correctly and you'll win in the long term. Hit me up with any questions or suggestions. Happy Trading!

Customizable Pivot Support/Resistance Zones [MyTradingCoder]This script uses the standard pivot-high/pivot-low built-in methods to identify pivot points on the chart as a base calculation for the zones. Rather than displaying basic lines, it displays a zone from the original pivot point to the closest part of the available body on the same candle. The script comes in handy by utilizing Pinescripts available input.source() function to allow for an external indicators output value to be used within the indicator. Make sure to read all of the TOOLTIPS in the indicator settings menu to get a full understanding of what each setting does, and how it can affect the results that end up on the chart.
By enabling the custom filter in the indicator settings, you will notice you have the ability to filter out zones using an external indicator such as an RSI. Maybe you only want zones to be calculated/drawn when the RSI is overbought or oversold, or maybe you only want the zones to calculate/draw if the Supertrend is green or red. The list of possible filters that you can implement is too many to count. Feel free to play around with the indicator however you like, and configure something that you find to be the most useful for your trading.
On top of everything listed above, the indicator has pre-programmed built-in alertconditions so that you can potentially automate trading, or get a notification to your cell phone when a zone is being touched/broken.

MASIG#2this indicator founded from easy combined
1.EMA
2.ATR/Supertrend
3.ADX/DI+DI-
4.MACD
5.Dochian
6.OBV
and show by line label and background

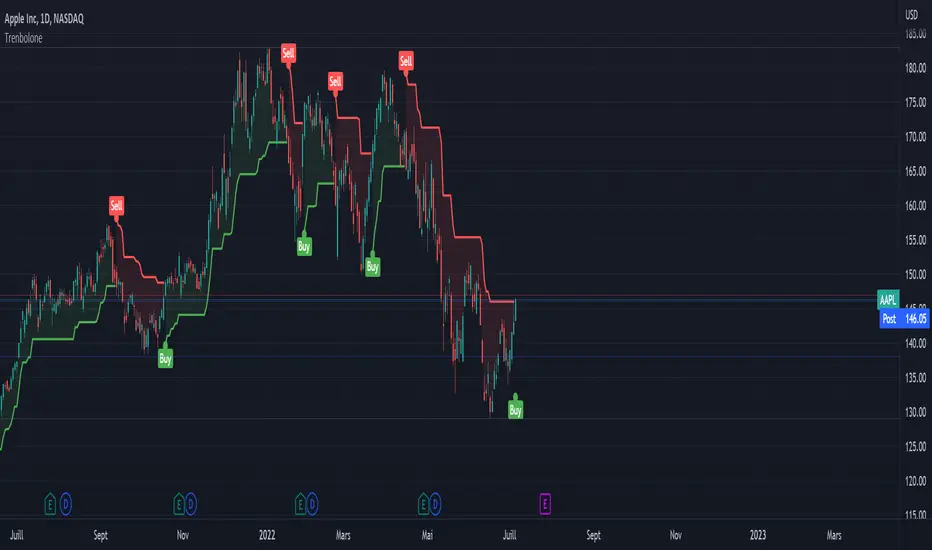
Halftrend22A popular trend indicator based on ATR. Similar to the SuperTrend but uses a different trend's identification logic.
I am publishing a disclosed code without license. Remember that in the future you may see a lot of paid IO scripts called BuySellScalper, Trend Trader Karan, Trend Trader and etc (by other authors) which will be based on this script. I found the same script on Ebay for $10 with a free shipping. Beware, always check and follow one Russian wisdom: "Do not pay for something you can get for free".
Haf Trend + 3 Ema
Ema 1
ema2
ema3

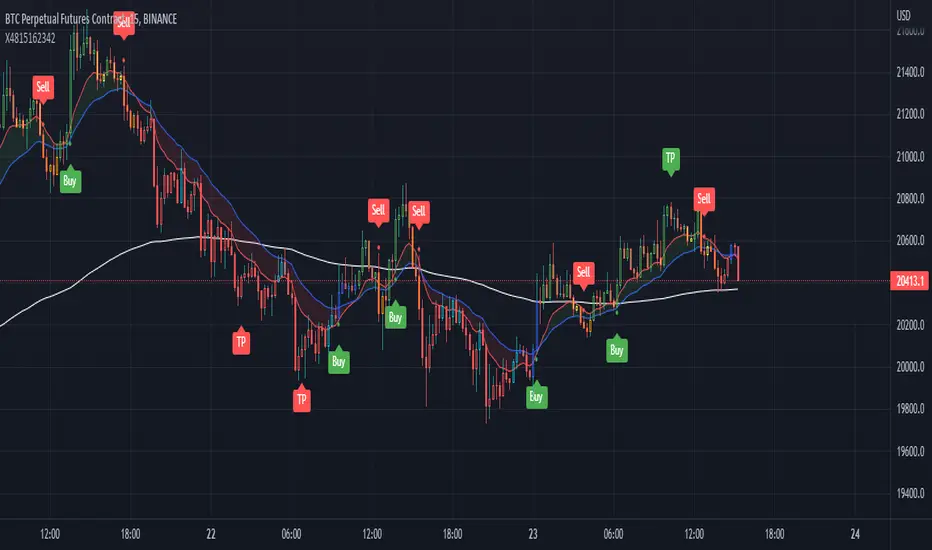
Super Combo TF15 Perfect (CDC+SuperTrend+ATR+EMA) by X4815162342Thank you for opensource code script
this script mix 4 indicator
1.ATR
2.SuperTrend
3.EMA 175 or 200
4.CDC Actionzone by piriya33
this great for TF 15 min Future and Spot
How to Use
------- Future ------
Short and Long by Buy and Sell Ribbon
You can take profit when see TP ribbon or SL when trend change
------- Spot --------
Green Candle Sign is Buy
Red Candle Sign is Sell
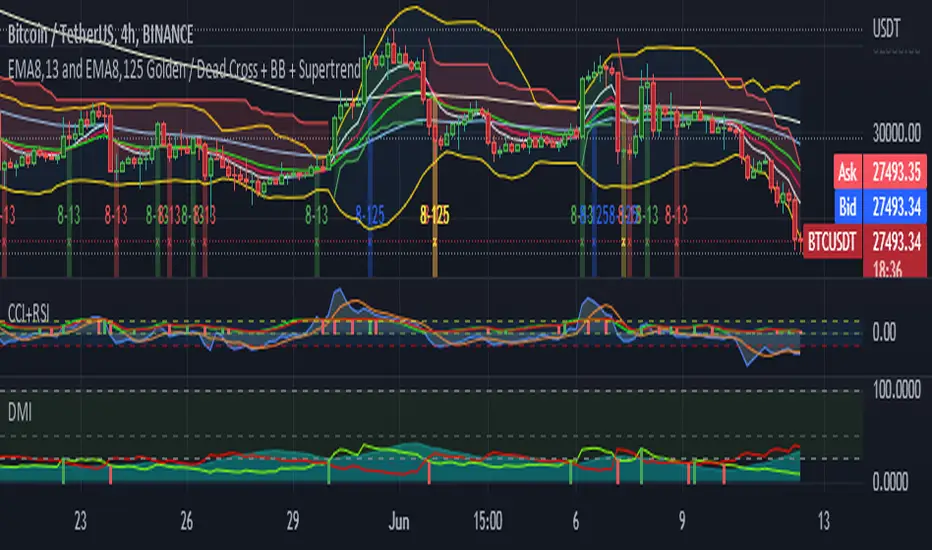
5EMA(8,13,21,55,125) w/ EMA8-13 + EMA8-125 GC/DC Signal-by TerryThis Script are Combined 5 EMAs Indicator with Golden / Death Cross EMA 8 -13 and EMA 8 - 125 within Green or Red Column Line as Default Signal. This Indicator also combined with Ballinger Band and Super Trend Channel.
If you have like this Indicator, please add to your favorite Indicator, and If You Don't, Don't be like a man without woman :) ... God Bless You All
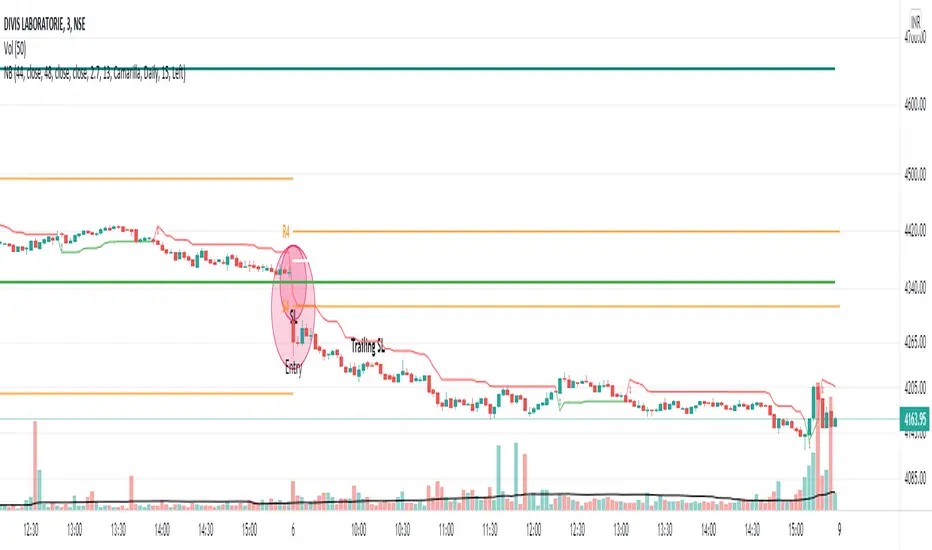
NoBrain BreakoutUse 3min. Time frame.
Buy Stock Selection:-
When Close Price Cross Monthly Standard Pivot R1 & Monthly Standard Pivot R1 is Greater than Previous Day High( PDH ) Or Close.
Price must be Above 44 MA ,48 EMA & Vwap
***Buy When 3min Candle closed Above Camarilla R4 or Monthly Standard Pivot R1 whichever is High.
Sell Stock Selection:-
When Close Price Cross Monthly Standard Pivot S1 & Monthly Standard Pivot S1 is Less than Previous Day Low( PDL ) Or Close.
Price must be Below 44 MA ,48 EMA & Vwap
***Sell When 3min Candle closed Below Camarilla S4 or Monthly Standard Pivot S1 whichever is Low.
Trading time for
1st wave 9.30am to 10.45am.
2nd wave 12.45pm to 2.45pm.
(Based on NSE/ BSE India)
Indicators:-
1) Pivot Points Standard - Time Frame monthly.only select R1
2) Pivot Points Camarilla- Only select R4.
3) SMA 44
4) EMA 48
5) Vwap
6) For Trailing Stop Loss use SuperTrend- Length-13 Factor-2.7 or Length-15 Factor-3 (3min Timeframe)
MTF MACD (PPO) [TANHEF]Mult-Timeframe Moving Average Convergence Divergence (MACD) and Percentage Price Oscillator (PPO) indicator that allows for viewing of 1 to 5 different Timeframes.
Brief Summary
The primary benefit of multi-timeframe indicators is getting better entries and confirmation from viewing multiple time frames at once, which can often get overlooked.
MACD shouldn't be only used by itself, it is a lot more consistent when applied in the same direction as the trend as well as multiple other things including support, resistance, and volume improve the outcomes of the MACD results.
Personally, I look for good entries on higher and lower time frames (multiple timeframes must agree with the buying or selling). For example, if a higher timeframe looks like a good long entry (MACD line is crossing up and below the zero line), then the lower timeframes should be checked to ensure they are not oversold or overextended (the MACD line must be low or below the zero), once the lower and higher timeframes are in agreeance an entry can be made.
What is Moving Average Convergence Divergence (MACD)?
Moving average convergence divergence (MACD) is a trend-following momentum indicator that shows the relationship between two moving averages of the price. The MACD is calculated by subtracting the 26-period exponential moving average (EMA) from the 12-period EMA.
What is the Percentage Price Oscillator (PPO)?
The PPO is identical to the MACD indicator, except the PPO measures percentage difference between two EMAs, while the MACD measures absolute (or dollar) difference. The PPO has the advantage of being comparable to other assets with different prices, whereas MACD readings are not comparable. For example, regardless of the asset's price, a PPO result of 10 means the short-term average is 10% above the long-term average.
A signal line can be displayed on Timeframe, including:
- MACD & Signal Line crosses (Green when MACD above Signal Line and Red when MACD below Signal Line)
- Histogram Direction (fast and slow EMA gap)
- SuperTrend for identifying trend direction (green for uptrend, red for downtrend)
- EMA Trend for identifying trend direction (above EMA = up trend and green, below EMA = down trend and red)
Cross Dots and Potential cross dots
- Green Dot, is displayed when the MACD crosses the Signal Line
- Red Dot, is displayed when the MACD crosses the Signal Line
- Yellow Dot. Potential cross up (green dot) on next bar. Displayed when if the same distance a MACD moves on a bar is applied to the next bar will cause a MACD and Signal Line Cross. This is calculated by checking if the value change of one bar is added to the current MACD value would lead to a cross on the next bar, the it is a potential up dot.
- Purple Dot. Potential cross down (red dot) on next bar. Displayed when if the same distance a MACD moves on a bar is applied to the next bar will cause a MACD and Signal Line Cross. This is calculated by checking if the value change of one bar is added to the current MACD value would lead to a cross on the next bar, the it is a potential down dot.
Best Fit Settings
- Can be applied to the MACD, Signal Line, and Histogram to re-scale (stretch) to fit them within the space of the +2 and -2 range that each timeframe is provided on this indicator.
- The lookback distance value is used to lookback a certain distance to ensure everything scaled to fit well.
Labels are displayed on the right of the indicators, including:
- a label identifying 'line indicator' is currently being displayed
- the Timeframe corresponding to each MACD or PPO indicator
- the MACD or PPO of each Timeframe

Intraday JXMODI CrossCombination of two strategy.
MA Cross strategy + RSI strategy to decide whether the stock/crypto is currently overbought/oversold.
RSI alert when change from bull to bear, and vice verse.
Useful for quick entry and exit trade.
Whenever RSI Black color line Cross Red color MA line , Trend Changes.
For Bull side Trade on High of that candle & Stoploss Low of that candle in which Cross Occurs.(Green Shadow)
For Bear side Trade on Low of that candle & Stoploss High of that candle in which Cross occurs.(Red Shadow)
For more confirmation use SuperTrend etc indicators.

Compound IndicatorThis is an indicator finds end points of short term market trends. this is a combination of many indicators such as
1. Volume change oscillator
2. Money flow index (MFI)
3. Momentum Oscillator (MOM)
4. Stochastic Indicator
6. Relative Strength Indicator (RSI)
7. Relative volatility index (RVI)
8. Balance of power (BOP)
9. Small moving average (SMA)
10. Exponential moving average (EMA)
11. Parabolic SAR
12. Super trend indicator
this script forms a compound indicator after analysing movements of those indicators through different time frames and measure its co-relation and variance with the price action. buy doing that, indicator in a position to identify short term market reversals and presented.

NazhoThis is a simple scalping strategy that works for all time frames... I have only tested it on FOREX
It works by checking if the price is currently in an uptrend and if it crosses the 20 EMA .
If it crosses the 20 EMA and its in and uptrend it will post a BUY SIGNAL.
If it crosses the 20 EMA and its in and down it will post a SELL SIGNAL.
The red line is the highest close of the previous 8 bars --- This is resistance
The green line is the lowest close of the previous 8 bars -- This is support
+SuperTrend
