RSI Standard Deviation | viResearchRSI Standard Deviation | viResearch
The "RSI Standard Deviation" indicator, developed by viResearch, introduces a new approach to combining the Relative Strength Index (RSI) with a standard deviation measure to offer a more dynamic view of market momentum. By applying standard deviation to the RSI values, this indicator refines the traditional RSI, providing a more precise and adaptive way to measure overbought and oversold conditions. This unique combination allows traders to better understand the underlying volatility in RSI movements, leading to more informed decisions in trending and ranging markets.
Technical Composition and Calculation:
The core of the "RSI Standard Deviation" lies in calculating the RSI based on user-defined input parameters and then applying standard deviation to these RSI values. This method enhances the sensitivity of the RSI, making it more responsive to market volatility.
RSI Calculation:
RSI Length (len): The script computes the Relative Strength Index over a customizable length (default: 21), offering a traditional measure of momentum in the market. The RSI tracks the speed and change of price movements, oscillating between 0 and 100 to indicate overbought and oversold conditions.
Standard Deviation Applied to RSI:
Standard Deviation Length (sdlen): The script calculates the standard deviation of the RSI values over a user-defined period (default: 35). This standard deviation represents the volatility in RSI movements, adding a new layer of analysis to traditional RSI.
Upper (u) and Lower (d) Bands:
The standard deviation values are used to create upper and lower bands around the RSI, offering an adaptive range that expands or contracts based on market volatility. This helps traders identify moments when the market is more likely to reverse or continue its trend.
Trend Identification:
Uptrend (L): The script identifies an uptrend when the RSI moves above the lower band and stays above the midline (50). This indicates that the market is gaining upward momentum, potentially signaling a long position.
Downtrend (S): A downtrend is identified when the RSI moves below 50, suggesting a weakening market and a potential short position.
Features and User Inputs:
The "RSI Standard Deviation" script offers various customization options, enabling traders to tailor it to their specific needs and strategies:
RSI Length: Traders can adjust the length of the RSI calculation to control how quickly the indicator responds to price movements.
Standard Deviation Length: Adjusting the standard deviation length allows users to control the sensitivity of the upper and lower bands, fine-tuning the indicator’s responsiveness to market volatility.
Source Input: The script can be applied to different price sources, offering flexibility in how it calculates RSI and standard deviation values.
Practical Applications:
The "RSI Standard Deviation" indicator is particularly useful in volatile markets, where traditional RSI may produce false signals due to rapid price movements. By adding a standard deviation measure, traders can filter out noise and better identify trends.
Key Uses:
Trend Following: The standard deviation bands provide a clearer view of momentum shifts in the RSI, allowing traders to follow the trend more confidently.
Volatility Assessment: The indicator dynamically adjusts to market volatility, making it easier to assess when the market is overbought or oversold and when a trend reversal is likely.
Signal Confirmation: By comparing the RSI to the adaptive standard deviation bands, traders can confirm signals and avoid false entries during periods of high volatility.
Advantages and Strategic Value:
The "RSI Standard Deviation" offers several advantages:
Enhanced Precision: The combination of RSI and standard deviation results in a more refined momentum indicator that adapts to market conditions.
Noise Reduction: The standard deviation bands help filter out short-term market noise, making it easier to identify significant trend changes.
Dynamic Volatility Awareness: By using standard deviation, the indicator adjusts its bands based on real-time volatility, providing more accurate overbought and oversold signals.
Summary and Usage Tips:
The "RSI Standard Deviation" is a powerful tool for traders looking to enhance their RSI analysis with volatility measures. For optimal performance, traders should experiment with different RSI and standard deviation lengths to suit their trading timeframe and strategy. Whether used to follow trends or confirm momentum signals, the "RSI Standard Deviation" provides a reliable and adaptive solution for modern trading environments.
标准差(StdDev)

Inverted SD Dema RSI | viResearchInverted SD Dema RSI | viResearch
The "Inverted SD Dema RSI" developed by viResearch introduces a new approach to trend analysis by combining the Double Exponential Moving Average (DEMA), Standard Deviation (SD), and Relative Strength Index (RSI). This unique indicator provides traders with a tool to capture market trends by integrating volatility-based thresholds. By using the smoothed DEMA along with standard deviation, the indicator offers improved responsiveness to price fluctuations, while RSI thresholds offer insight into overbought and oversold market conditions.
At the core of the "Inverted SD Dema RSI" is the combination of DEMA and standard deviation for a more nuanced view of market volatility. The use of RSI further aids in detecting price extremes and potential trend reversals.
DEMA Calculation (sublen): The Double Exponential Moving Average (DEMA) smoothes out price data over a user-defined period, reducing lag compared to traditional moving averages. This provides a clearer representation of the market's overall direction.
Standard Deviation Calculation (sublen_2): The standard deviation of the DEMA is used to define the upper (u) and lower (d) bands, highlighting areas where price volatility may signal a change in trend. These dynamic bands help traders gauge price volatility and potential breakouts or breakdowns.
RSI Calculation (len): The script applies the Relative Strength Index (RSI) to the smoothed DEMA values, allowing traders to detect momentum shifts based on a modified data set. This provides a more accurate reflection of market strength when combined with the DEMA.
Thresholds: The RSI is compared to user-defined thresholds (70 for overbought and 55 for oversold conditions). These thresholds help in identifying potential market reversals, especially when the price breaks outside of the calculated standard deviation bands.
Uptrend (L): An uptrend signal is generated when the RSI exceeds the upper threshold (70) and the price is not above the upper standard deviation band, indicating that there may be room for further price appreciation.
Downtrend (S): A downtrend signal occurs when the RSI falls below the lower threshold (55), indicating that the price may continue to decline.
The "Inverted SD Dema RSI" offers a wide range of customizable settings, allowing traders to adjust the indicator based on their trading style or market conditions.
DEMA Length (sublen): Controls the period used to smooth the price data, impacting the sensitivity of the DEMA to recent price movements.
Standard Deviation Length (sublen_2): Defines the length over which the standard deviation is calculated, helping traders control the width of the upper and lower bands.
RSI Length (len): Adjusts the period used for the RSI calculation, providing flexibility in determining overbought and oversold conditions.
RSI Thresholds: Traders can define their own levels for detecting trend reversals, with default values of 70 for an uptrend and 55 for a downtrend.
The "Inverted SD Dema RSI" is particularly well-suited for traders looking to capture trends while accounting for volatility and momentum. By using a smoothed DEMA as the foundation, it effectively filters out noise, making it ideal for detecting reliable trends in volatile markets.
Key Uses:
Trend Following: The indicator’s combination of DEMA, standard deviation, and RSI helps traders follow trends more effectively by reducing noise and identifying key momentum shifts.
Volatility Filtering: The use of standard deviation bands provides a dynamic measure of volatility, ensuring that traders are aware of potential breakouts or breakdowns in the market.
Momentum Detection: The inclusion of RSI ensures that the indicator is not only focused on trend direction but also on the strength of the underlying momentum, helping traders avoid entering trades during weak trends.
The "Inverted SD Dema RSI" provides several key advantages over traditional trend-following indicators:
Reduced Lag: The use of DEMA ensures faster trend detection, reducing the lag associated with simple moving averages.
Noise Reduction: The integration of standard deviation helps filter out irrelevant price movements, making it easier to identify significant trends.
Momentum Awareness: The addition of RSI provides valuable insight into the strength of trends, helping traders avoid false signals during periods of weak momentum.
The "Inverted SD Dema RSI" offers a powerful blend of trend-following and momentum detection, making it a versatile tool for modern traders. By integrating DEMA, standard deviation, and RSI, the indicator provides a comprehensive view of market trends and volatility. Traders are encouraged to experiment with different settings for the DEMA length, standard deviation, and RSI thresholds to fine-tune the indicator for their specific trading strategies. Whether used for trend confirmation, volatility assessment, or momentum analysis, the "Inverted SD Dema RSI" offers a valuable tool for traders seeking a comprehensive approach to market analysis.

Z-Score AggregatorOverview:
This indicator is designed to take multiple other indicators as inputs, calculate their respective Z-scores, and then aggregate these Z-scores to provide a comprehensive measure. By transforming the inputs into Z-scores, this indicator standardizes the data, enabling a more accurate comparison across different indicators, each of which may have different scales and distributions.
This indicator is beneficial for Mean-Reversion style trading and investing as it standardizes indicators and lets them work together in one system.
The Z-score, which represents how many standard deviations an element is from the mean, is a crucial statistical tool in this process. It allows the indicator to normalize the varying data points, ensuring that each indicator's contribution to the aggregate score is proportional to its deviation from the average performance.
Inputs:
Z-score length: How far Back it will take into account the inputs
Number Of Sources: This is to set the number of inputs the indicator uses so it calculates them properly and uses only the number of indicators you want.
Source Inputs: 1-10 inputs (no need to use them all as long as you set the number of used indicators beforehand).
Note:
There are three indicators used in this example which are CCI, RSI and Sharpe Ratio. The indicator calculates their individual Z-scores and takes an average. Because Number Of Sources is set to 3 it only uses the first 3 indicators in use.

VPSA - Volume Price Spread AnalysisDear Analysts and Traders,
I am pleased to present the latest version of my indicator, based on the logic of analyzing spread and volume. In this version, the indicator examines spread and volume using min-max normalization. The statistical value is captured through Z-Score standardization, and I have added configurable alerts based on the normalized values of spread, volume, and the sigmas for these variables.
Theory and Evolution of the Indicator
The normalization function used in this program allows for the comparison of two values with different ranges on a single chart. The values that reach the highest within the examined range are assigned a value of one. As in previous versions, I have adopted a bar chart where the wider bar represents volume and the narrower bar represents spread. I believe that using normalization is the most intuitive approach, as the standardization in the earlier sVPSA version could cause confusion. This was due to smaller bars for higher actual values and negative bars, which required additional reliance on actual volume data and significant proficiency in using the indicator. These were limitations stemming from the computational aspect of these issues. As in the previously mentioned script, I also used Z-Score standardization here, which serves as a measure of deviation from the mean. This is visualized in the script as the color of the bars, which in the default configuration are as follows: below one sigma - blue; above one sigma up to two sigmas - green; above two sigmas up to three sigmas - red; and above three sigmas - fuchsia. Additionally, I applied an exponential moving average in this indicator to minimize the influence of older candles on the mean. The indicator has been enhanced with configurable alerts, allowing for substantial control over the conditions triggering them. The alerts enable the definition of normalized variable values and sigma values. Furthermore, the program allows for the definition of logical dependencies for these conditions.
Summary
The program I have developed is a synthesis of the most important and useful functions from the indicators I previously created. The indicator is a standalone and powerful tool that facilitates effective analysis of the spread-volume relationship, which is one of the fundamental methods of analysis according to the Wyckoff and VSA methodologies. The alerts introduced in this version provide extensive possibilities for controlling the dynamics of any market.
Should you encounter any errors or have suggestions regarding the indicator, please feel free to contact me.
I wish you successful analyses! All the best!
CatTheTrader

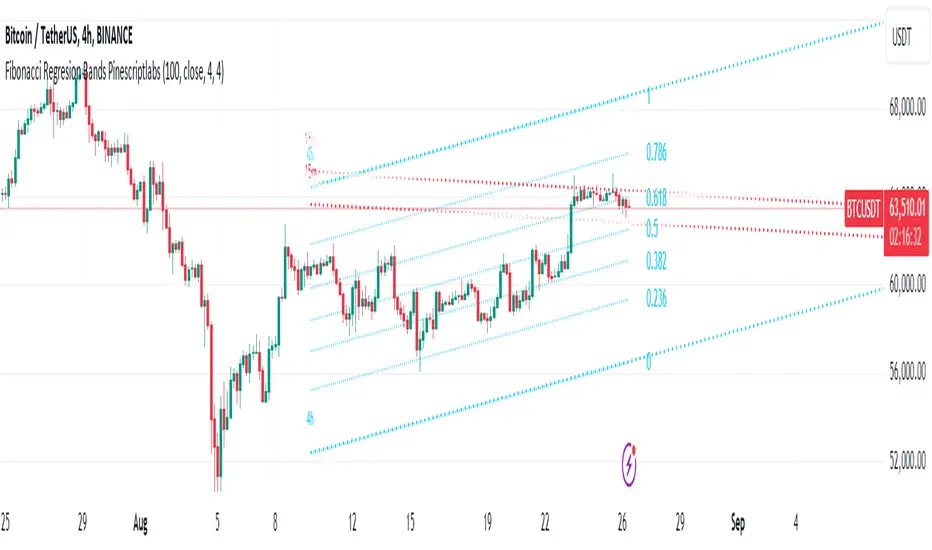
Fibonacci Linear Regression Bands[Pinescriptlabs]🎯 This script is designed to draw Fibonacci-based linear regression bands.
It calculates and draws a linear regression channel and its Fibonacci levels across different time frames (5m, 15m, 30m, and 4h).
📊 How to use it?
🔍 Multidimensional Analysis
This strategy allows you to view the market from a multidimensional perspective, integrating long-term trends with short-term price action. By doing so, you can dynamically adjust your trades based on market developments, moving between time frames as needed. This not only enables you to capture large movements within the primary trend but also to exploit smaller fluctuations.
⏳ Time Frame Interaction
4-Hour Time Frame with Regression Channel: By using a regression channel on a broader time frame (like 4 hours), you gain a perspective on the dominant trend. This provides you with a solid foundation to evaluate the general market direction. In this scenario, you might deactivate the Fibonacci levels to avoid cluttering the visualization, focusing solely on the regression channel that shows you the prevailing trend.
Lower Time Frames with Regression and Fibonacci: You can activate the regression lines and Fibonacci levels on lower time frames (like 5m, 15m, or 30m) to obtain more precise signals. Here, Fibonacci levels will help you identify potential entry and exit points within the broader time frame.
🚩 Reversal Zone Identification
If the price breaks the regression channel on a lower time frame and approaches a key Fibonacci level, this could indicate a potential reversal.
🎯 Multiple Scenarios
By using different combinations of regression channels and Fibonacci levels across various time frames, you can create trading scenarios. For example, you could be in a long position on the 4-hour time frame while simultaneously trading within a lower time frame, taking advantage of bounces at Fibonacci levels.
🎯 Confluence Zone Identification
Zones where regression lines and Fibonacci levels coincide become areas of confluence. These zones represent points where a strong price reaction is likely to occur. If a Fibonacci retracement aligns with the upper or lower edge of a regression channel, this point acts as a significant support or resistance level.
⚙️ Input Configuration?
Activate/Deactivate Regression Lines: Click on the squares under "Linear Settings" to activate or deactivate the regression line in different time frames. If a square is colored, the regression line for that time frame is activated.
Show/Hide Fibonacci: Check or uncheck the boxes under "Fibonacci Settings" to show or hide Fibonacci levels in the selected time frames.
Fibonacci Color: Click on the color box under "Fibonacci Color" to select a new color for the Fibonacci levels.
Español:
🎯 Este script está diseñado para dibujar bandas de regresión lineal basadas en Fibonacci.
Calcula y dibuja un canal de regresión lineal y sus niveles de Fibonacci en diferentes marcos de tiempo (5m, 15m, 30m y 4h).
📊 ¿Cómo usarlo?
🔍 Análisis Multidimensional
Esta estrategia te permite ver el mercado desde una perspectiva multidimensional, integrando las tendencias a largo plazo con la acción del precio a corto plazo. Al hacerlo, puedes ajustar dinámicamente tus operaciones según la evolución del mercado, moviéndote entre marcos de tiempo según sea necesario. Esto no solo te permite captar movimientos grandes dentro de la tendencia principal, sino también explotar fluctuaciones más pequeñas
⏳ Interacción entre Marcos Temporales
Marco de Tiempo de 4 Horas con Canal de Regresión: Al utilizar un canal de regresión en un marco temporal más amplio (como 4 horas), obtienes una perspectiva sobre la tendencia dominante. Esto te da una base sólida para evaluar la dirección general del mercado. En este escenario, podrías desactivar los niveles de Fibonacci para evitar sobrecargar la visualización, enfocándote solo en el canal de regresión que muestra la tendencia predominante.
Marcos Temporales Menores con Regresión y Fibonacci: Puedes activar las líneas de regresión y los niveles de Fibonacci en marcos temporales menores (como 5m, 15m o 30m) para obtener señales más precisas. Aquí, los niveles de Fibonacci te ayudarán a identificar posibles puntos de entrada y salida dentro del marco temporal más amplio.
🚩 Identificación de Zonas de Reversión
Si el precio rompe el canal de regresión en un marco de tiempo menor y se aproxima a un nivel clave de Fibonacci, esto podría indicar una posible reversión.
🎯 Multiplicidad de Escenarios
Al usar diferentes combinaciones de canales de regresión y niveles de Fibonacci en varios marcos de tiempo, puedes crear escenarios de trading. Por ejemplo, podrías estar en una posición larga en el marco temporal de 4 horas, mientras que simultáneamente operas en un marco temporal menor aprovechando los rebotes en los niveles de Fibonacci.
🎯 Identificación de Zonas de Confluencia
Las zonas donde las líneas de regresión y los niveles de Fibonacci coinciden se convierten en áreas de confluencia. Estas zonas representan puntos donde es probable que ocurra una fuerte reacción del precio. Si un retroceso de Fibonacci se alinea con el borde superior o inferior de un canal de regresión, este punto actúa como un soporte o resistencia significativo.
⚙️ ¿Configuración de Inputs?
Activar/Desactivar Líneas de Regresión: Haz clic en los cuadrados bajo "Linear Settings" para activar o desactivar la línea de regresión en diferentes marcos temporales. Si un cuadrado está coloreado, la línea de regresión para ese marco temporal está activada.
Mostrar/Ocultar Fibonacci: Marca o desmarca las casillas bajo "Fibonacci Settings" para mostrar u ocultar los niveles de Fibonacci en los marcos temporales seleccionados.
Color de Fibonacci: Haz clic en el cuadro de color bajo "Fibonacci Color" para seleccionar un nuevo color para los niveles de Fibonacci.
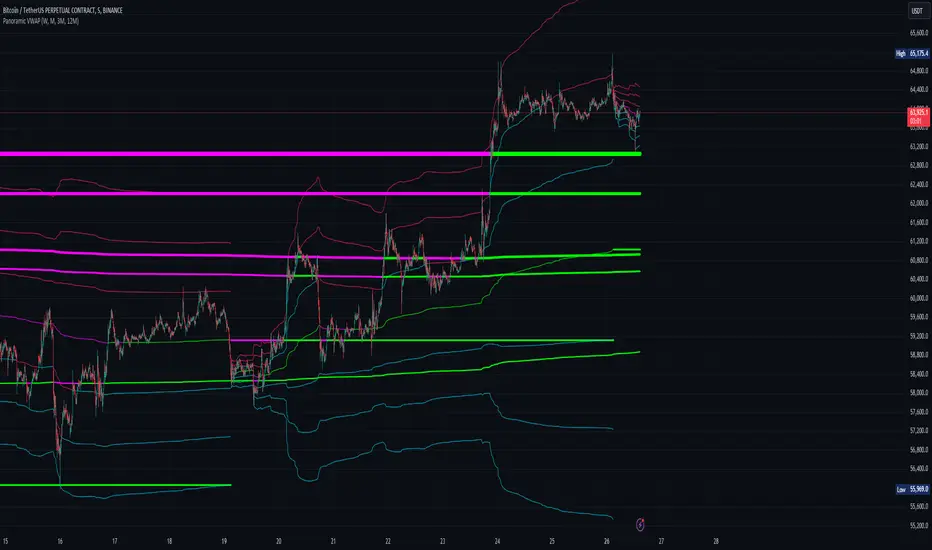
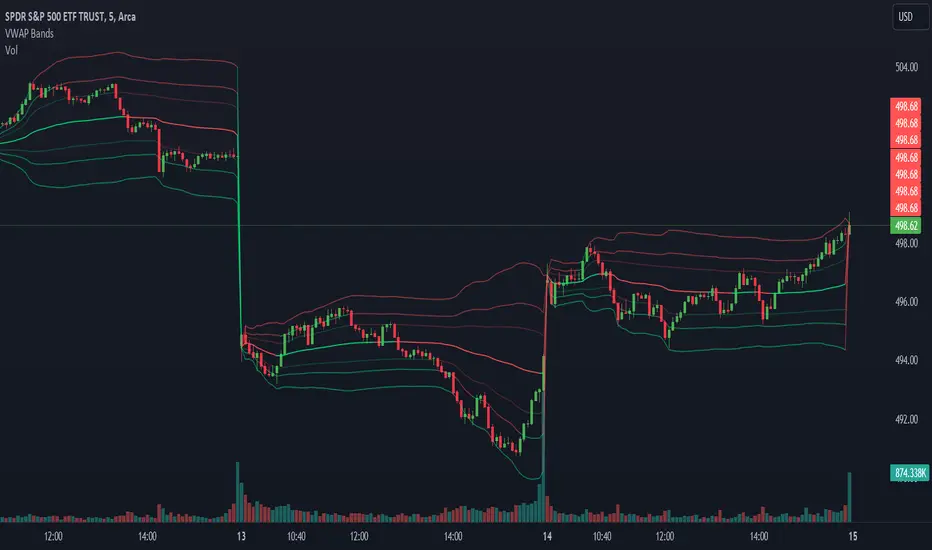
Panoramic VWAP### Panoramic VWAP Indicator Overview
The Panoramic VWAP indicator provides a way to display up to four Volume Weighted Average Price (VWAP) lines on a chart, each anchored to different timeframes. This indicator also includes options for displaying standard deviation bands and close lines, offering a comprehensive view of price action across multiple time horizons.
### Key Features
Quad VWAPs : The indicator allows for the display of four VWAP lines simultaneously. Each line can be set to a different timeframe, enabling traders to analyze market conditions across various periods on a single chart.
Standard Deviation Bands : Users can enable bands around each VWAP line, which represent standard deviations or percentage levels from the VWAP. These bands help in assessing volatility and identifying potential overbought or oversold conditions.
Close Lines : The indicator includes an option to show close lines, marking the price's closing level relative to the VWAP. This feature is useful for examining how the market closes in relation to VWAP, which can be important for understanding trend strength or potential reversals.
### How It Looks
VWAP Lines : Multiple VWAP lines are displayed, each reflecting different timeframes. The lines change color depending on whether the price is above or below the VWAP, indicating bullish or bearish momentum.
Bands : Optional bands around the VWAP lines provide a visual indication of volatility, with the potential to identify overbought or oversold areas.
Close Lines : These lines represent the price's closing level relative to the VWAP and can be displayed to add further context to the analysis.
### How to Use It
Trend Analysis :
- Price above a VWAP line indicates bullish momentum .
- Price below a VWAP line suggests bearish momentum .
Support and Resistance :
- VWAP lines often act as dynamic support and resistance. Price approaching a VWAP line from above may find support, while approaching from below may encounter resistance.
Volatility Assessment :
- Bands around the VWAP lines can signal areas of potential reversal. Upper bands may indicate overbought conditions, while lower bands may indicate oversold conditions.
Multiple Timeframe Analysis :
- The ability to display VWAPs from different timeframes simultaneously allows for the identification of confluence zones, where multiple VWAP levels align, indicating potentially significant support or resistance levels.
Customization :
- The indicator settings are customizable, allowing users to choose which VWAP lines, bands, and close lines to display, along with adjustments for visual preferences like line thickness and colors.
### Practical Application
Intraday Trading : Traders can use the VWAPs and bands to identify potential entry and exit points during the trading day based on price interactions with these levels.
Swing Trading : Monitoring VWAP lines across different timeframes can help identify key levels where price might reverse or gain momentum, aiding in decisions about holding or exiting positions.
Long-Term Analysis : VWAP lines on higher timeframes can serve as dynamic support or resistance levels, providing context for long-term trend analysis and investment decisions.
The Panoramic VWAP indicator allows for a detailed analysis of price trends and levels across multiple timeframes, combining VWAPs, standard deviation bands, and close lines in a single, customizable tool.
Fear/Greed Zone Reversals [UAlgo]The "Fear/Greed Zone Reversals " indicator is a custom technical analysis tool designed for TradingView, aimed at identifying potential reversal points in the market based on sentiment zones characterized by fear and greed. This indicator utilizes a combination of moving averages, standard deviations, and price action to detect when the market transitions from extreme fear to greed or vice versa. By identifying these critical turning points, traders can gain insights into potential buy or sell opportunities.
🔶 Key Features
Customizable Moving Averages: The indicator allows users to select from various types of moving averages (SMA, EMA, WMA, VWMA, HMA) for both fear and greed zone calculations, enabling flexible adaptation to different trading strategies.
Fear Zone Settings:
Fear Source: Select the price data point (e.g., close, high, low) used for Fear Zone calculations.
Fear Period: This defines the lookback window for calculating the Fear Zone deviation.
Fear Stdev Period: This sets the period used to calculate the standard deviation of the Fear Zone deviation.
Greed Zone Settings:
Greed Source: Select the price data point (e.g., close, high, low) used for Greed Zone calculations.
Greed Period: This defines the lookback window for calculating the Greed Zone deviation.
Greed Stdev Period: This sets the period used to calculate the standard deviation of the Greed Zone deviation.
Alert Conditions: Integrated alert conditions notify traders in real-time when a reversal in the fear or greed zone is detected, allowing for timely decision-making.
🔶 Interpreting Indicator
Greed Zone: A Greed Zone is highlighted when the price deviates significantly above the chosen moving average. This suggests market sentiment might be leaning towards greed, potentially indicating a selling opportunity.
Fear Zone Reversal: A Fear Zone is highlighted when the price deviates significantly below the chosen moving average of the selected price source. This suggests market sentiment might be leaning towards fear, potentially indicating a buying opportunity. When the indicator identifies a reversal from a fear zone, it suggests that the market is transitioning from a period of intense selling pressure to a more neutral or potentially bullish state. This is typically indicated by an upward arrow (▲) on the chart, signaling a potential buy opportunity. The fear zone is characterized by high price volatility and overselling, making it a crucial point for traders to consider entering the market.
Greed Zone Reversal: Conversely, a Greed Zone is highlighted when the price deviates significantly above the chosen moving average. This suggests market sentiment might be leaning towards greed, potentially indicating a selling opportunity. When the indicator detects a reversal from a greed zone, it indicates that the market may be moving from an overbought condition back to a more neutral or bearish state. This is marked by a downward arrow (▼) on the chart, suggesting a potential sell opportunity. The greed zone is often associated with overconfidence and high buying activity, which can precede a market correction.
🔶 Why offer multiple moving average types?
By providing various moving average types (SMA, EMA, WMA, VWMA, HMA) , the indicator offers greater flexibility for traders to tailor the indicator to their specific trading strategies and market preferences. Different moving averages react differently to price data and can produce varying signals.
SMA (Simple Moving Average): Provides an equal weighting to all data points within the specified period.
EMA (Exponential Moving Average): Gives more weight to recent data points, making it more responsive to price changes.
WMA (Weighted Moving Average): Allows for custom weighting of data points, providing more flexibility in the calculation.
VWMA (Volume Weighted Moving Average): Considers both price and volume data, giving more weight to periods with higher trading volume.
HMA (Hull Moving Average): A combination of weighted moving averages designed to reduce lag and provide a smoother curve.
Offering multiple options allows traders to:
Experiment: Traders can try different moving averages to see which one produces the most accurate signals for their specific market.
Adapt to different market conditions: Different market conditions may require different moving average types. For example, a fast-moving market might benefit from a faster moving average like an EMA, while a slower-moving market might be better suited to a slower moving average like an SMA.
Personalize: Traders can choose the moving average that best aligns with their personal trading style and risk tolerance.
In essence, providing a variety of moving average types empowers traders to create a more personalized and effective trading experience.
🔶 Disclaimer
Use with Caution: This indicator is provided for educational and informational purposes only and should not be considered as financial advice. Users should exercise caution and perform their own analysis before making trading decisions based on the indicator's signals.
Not Financial Advice: The information provided by this indicator does not constitute financial advice, and the creator (UAlgo) shall not be held responsible for any trading losses incurred as a result of using this indicator.
Backtesting Recommended: Traders are encouraged to backtest the indicator thoroughly on historical data before using it in live trading to assess its performance and suitability for their trading strategies.
Risk Management: Trading involves inherent risks, and users should implement proper risk management strategies, including but not limited to stop-loss orders and position sizing, to mitigate potential losses.
No Guarantees: The accuracy and reliability of the indicator's signals cannot be guaranteed, as they are based on historical price data and past performance may not be indicative of future results.

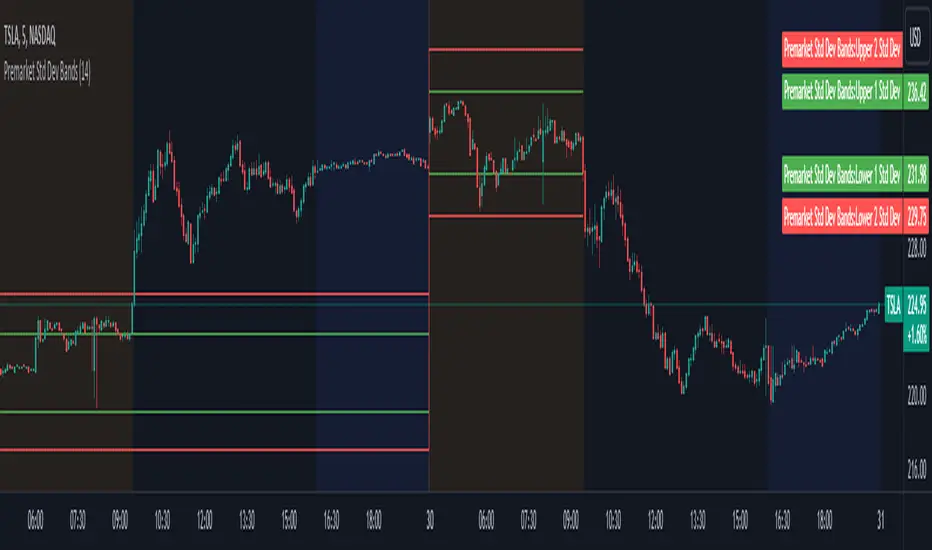
Premarket Std Dev BandsOverview
The Premarket Std Dev Bands indicator is a powerful Pine Script tool designed to help traders gain deeper insights into the premarket session's price movements. This indicator calculates and displays the standard deviation bands for premarket trading, providing valuable information on price volatility and potential support and resistance levels during the premarket hours.
Key Features
Premarket Focus: Specifically designed to analyze price movements during the premarket session, offering unique insights not available with traditional indicators.
Customizable Length: Users can adjust the averaging period for calculating the standard deviation, allowing for tailored analysis based on their trading strategy.
Standard Deviation Bands: Displays both 1 and 2 standard deviation bands, helping traders identify significant price movements and potential reversal points.
Real-Time Updates: Continuously updates the premarket open and close prices, ensuring the bands are accurate and reflective of current market conditions.
How It Works
Premarket Session Identification: The script identifies when the current bar is within the premarket session.
Track Premarket Prices: It tracks the open and close prices during the premarket session.
Calculate Premarket Moves: Once the premarket session ends, it calculates the price movement and stores it in an array.
Compute Averages and Standard Deviation: The script calculates the simple moving average (SMA) and standard deviation of the premarket moves over a specified period.
Plot Standard Deviation Bands: Based on the calculated standard deviation, it plots the 1 and 2 standard deviation bands around the premarket open price.
Usage
To utilize the Premarket Std Dev Bands indicator:
Add the script to your TradingView chart.
Adjust the Length input to set the averaging period for calculating the standard deviation.
Observe the plotted standard deviation bands during the premarket session to identify potential trading opportunities.
Benefits
Enhanced Volatility Analysis: Understand price volatility during the premarket session, which can be crucial for making informed trading decisions.
Support and Resistance Levels: Use the standard deviation bands to identify key support and resistance levels, aiding in better entry and exit points.
Customizable and Flexible: Tailor the averaging period to match your trading style and strategy, making this indicator versatile for various market conditions.
VWAP Bands [UAlgo]The "VWAP Bands " indicator is designed to provide traders with valuable insights into market trends and potential support/resistance levels using Volume Weighted Average Price (VWAP) bands. This indicator integrates the core concepts of VWAP with additional trend analysis features, making it a versatile tool for both range trading and trend-following strategies.
The VWAP bands are plotted based on the standard deviation multipliers, creating upper and lower bands around the VWAP. These bands serve as dynamic support and resistance levels. When the price approaches these bands, traders can anticipate potential reversals or continuations of the current trend. Additionally, the indicator provides visual cues for trend strength and potential trend changes, helping traders make informed decisions in various market conditions.
🔶 Settings
Source (Data Source): The data source for VWAP calculations. The default setting is the typical price (HLC3), which is the average of the high, low, and close prices.
Length: The number of bars used in the VWAP calculation. This determines the lookback period for the indicator.
Standard Deviation Multiplier: The multiplier applied to the standard deviation to create the primary upper and lower VWAP bands. This setting controls the distance of the bands from the VWAP.
Secondary Standard Deviation Multiplier: The multiplier applied to the standard deviation to create the secondary upper and lower VWAP bands, providing additional levels of support and resistance.
Display Trend: A toggle to enable or disable the display of the trend analysis feature. When enabled, the indicator highlights trend strength and potential trend changes.
Display Trend Crossovers: A toggle to enable or disable the display of trend crossover signals. When enabled, the indicator plots shapes to indicate where trend switches are likely occurring.
🔶 Calculations
The calculations behind the "VWAP Bands " indicator begin with determining the Volume Weighted Average Price (VWAP), which provides a comprehensive view of the average price of an asset, weighted by trading volume. This gives a more accurate representation of the asset's true average price over a specified period.
The first step in this process involves summing the trading volume over a chosen period, typically represented by the length parameter. Simultaneously, the product of the price (usually an average of the high, low, and close prices) and the trading volume is calculated and summed. By dividing this cumulative price-volume product by the total volume, we obtain the VWAP value. This VWAP serves as the central anchor around which the price action oscillates.
To enhance the utility of VWAP, we introduce standard deviation calculations. Standard deviation measures the extent of price dispersion from the VWAP, providing insight into price volatility. By calculating the variance (which involves the squared deviations of price) and then taking its square root, we derive the standard deviation. This helps in understanding how far prices typically stray from the VWAP.
With the VWAP and standard deviation in hand, we then establish upper and lower bands by adding and subtracting multiples of the standard deviation from the VWAP. These bands act as dynamic support and resistance levels, adapting to changes in market volatility. The primary bands, set by the first standard deviation multiplier, are augmented by secondary bands defined by a larger multiplier, offering additional layers of potential support and resistance.
It also integrates trend analysis, highlighting areas where the price action suggests a strong or weak trend. This is achieved by overlaying colored zones above and below the bands, indicating the strength and direction of the trend. When the price crosses these bands, it signals potential trend changes, aiding traders in making timely decisions.
🔶 Disclaimer
The "VWAP Bands " indicator is provided for educational and informational purposes only. It is not intended as financial advice and should not be construed as such.
Trading involves significant risk and may not be suitable for all investors. Before using this indicator or making any investment decisions, it is important to conduct thorough research and consider your financial situation.

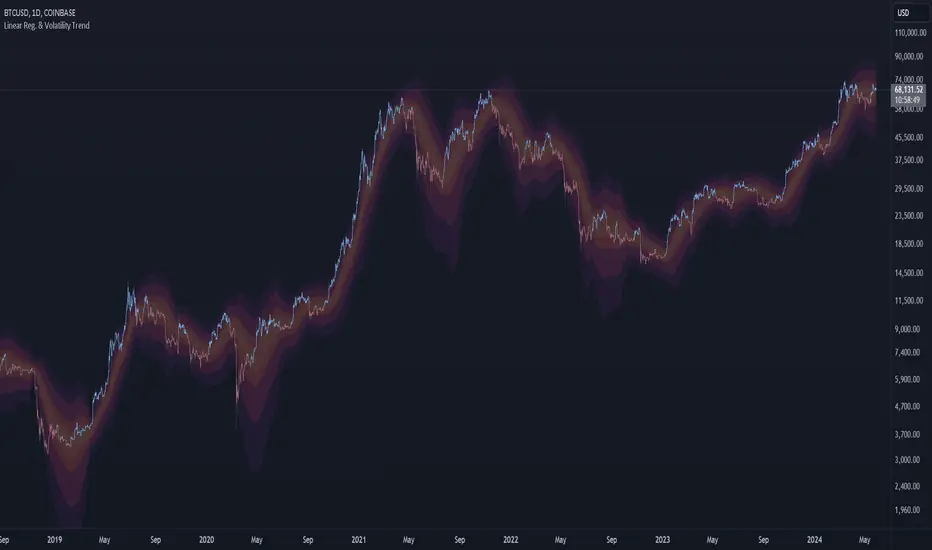
Trend Maestro - Linear Regression & Volatility BandsTrend Maestro - Linear Regression & Volatility Bands
Description:
The "Trend Maestro - Linear Regression & Volatility Bands" indicator is meticulously designed to provide traders with a clear understanding of market trends through the application of linear regression techniques and enhanced market data visualization. This tool is essential for traders looking to interpret long-term trends and market stability. Here's how the indicator functions and what makes it a unique addition to your trading toolkit:
1. Linear Regression Calculation:
At the heart of this indicator lies the linear regression calculation, which identifies the primary trend direction over a specified period. It does this by computing a line of best fit through the closing prices, helping to smooth out price fluctuations and highlight the prevailing trend direction. Users have the flexibility to adjust both the length of the regression and the offset period, enabling them to tailor the indicator's responsiveness to different market conditions.
2. Visualization Through Volatility Bands:
The volatility bands, plotted at half, one, two, and three standard deviations around the linear regression line, serve primarily as a visualization tool rather than a basis for investment decisions.
These bands:
Measure the dispersion of price from the trend line, providing a graphical representation of volatility.
Help traders visually assess the market's stability and the reliability of the current trend, with broader bands indicating higher volatility and narrower bands suggesting more stability.
3. Customization Features:
The indicator offers customization options including toggle switches for bar color and the display of SD bands, enhancing visual clarity. These settings allow traders to personalize the display according to their visual preferences and analysis requirements.
By incorporating these elements, the "Trend Maestro - Linear Regression & Volatility Bands" indicator offers a framework for understanding market trends through both quantitative calculations and qualitative visual aids. This makes it a valuable tool for those looking to make informed decisions based on longer-term market observations.
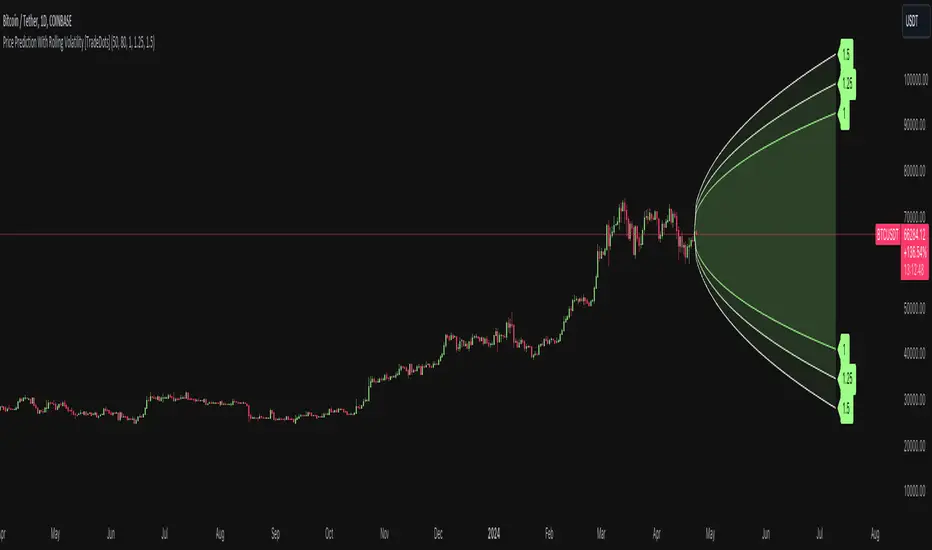
Price Prediction With Rolling Volatility [TradeDots]The "Price Prediction With Rolling Volatility" is a trading indicator that estimates future price ranges based on the volatility of price movements within a user-defined rolling window.
HOW DOES IT WORK
This indicator utilizes 3 types of user-provided data to conduct its calculations: the length of the rolling window, the number of bars projecting into the future, and a maximum of three sets of standard deviations.
Firstly, the rolling window. The algorithm amasses close prices from the number of bars determined by the value in the rolling window, aggregating them into an array. It then calculates their standard deviations in order to forecast the prospective minimum and maximum price values.
Subsequently, a loop is initiated running into the number of bars into the future, as dictated by the second parameter, to calculate the maximum price change in both the positive and negative direction.
The third parameter introduces a series of standard deviation values into the forecasting model, enabling users to dictate the volatility or confidence level of the results. A larger standard deviation correlates with a wider predicted range, thereby enhancing the probability factor.
APPLICATION
The purpose of the indicator is to provide traders with an understanding of the potential future movement of the price, demarcating maximum and minimum expected outcomes. For instance, if an asset demonstrates a substantial spike beyond the forecasted range, there's a significantly high probability of that price being rejected and reversed.
However, this indicator should not be the sole basis for your trading decisions. The range merely reflects the volatility within the rolling window and may overlook significant historical price movements. As with any trading strategies, synergize this with other indicators for a more comprehensive and reliable analysis.
Note: In instances where the number of predicted bars is exceedingly high, the lines may become scattered, presumably due to inherent limitations on the TradingView platform. Consequently, when applying three SD in your indicator, it is advised to limit the predicted bars to fewer than 80.
RISK DISCLAIMER
Trading entails substantial risk, and most day traders incur losses. All content, tools, scripts, articles, and education provided by TradeDots serve purely informational and educational purposes. Past performances are not definitive predictors of future results.
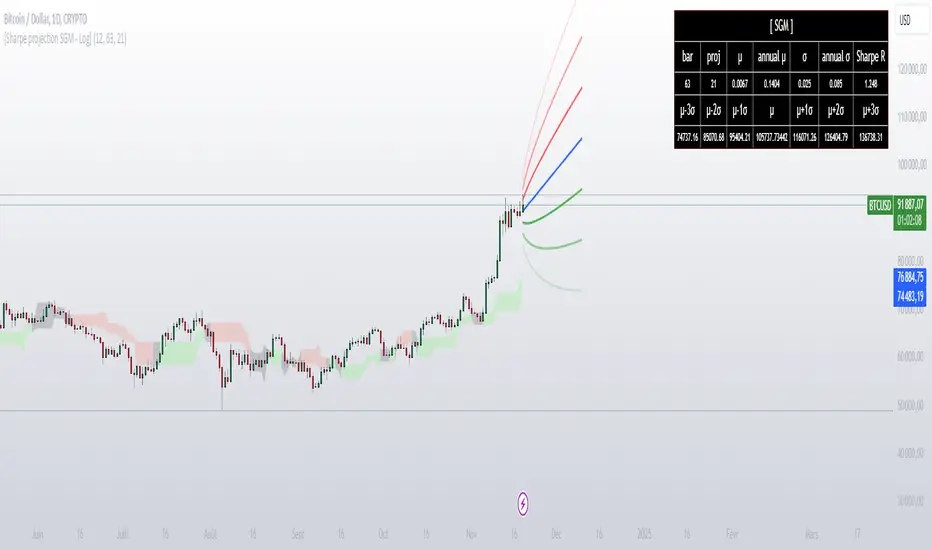
[Sharpe projection SGM]Dynamic Support and Resistance: Traces adjustable support and resistance lines based on historical prices, signaling new market barriers.
Price Projections and Volatility: Calculates future price projections using moving averages and plots annualized standard deviation-based volatility bands to anticipate price dispersion.
Intuitive Coloring: Colors between support and resistance lines show up or down trends, making it easy to analyze quickly.
Analytics Dashboard: Displays key metrics such as the Sharpe Ratio, which measures average ROI adjusted for asset volatility
Volatility Management for Options Trading: The script helps evaluate strike prices and strategies for options, based on support and resistance levels and projected volatility.
Importance of Diversification: It is necessary to diversify investments to reduce risks and stabilize returns.
Disclaimer on Past Performance: Past performance does not guarantee future results, projections should be supplemented with other analyses.
The script settings can be adjusted according to the specific needs of each user.
The mean and standard deviation are two fundamental statistical concepts often represented in a Gaussian curve, or normal distribution. Here's a quick little lesson on these concepts:
Average
The mean (or arithmetic mean) is the result of the sum of all values in a data set divided by the total number of values. In a data distribution, it represents the center of gravity of the data points.
Standard Deviation
The standard deviation measures the dispersion of the data relative to its mean. A low standard deviation indicates that the data is clustered near the mean, while a high standard deviation shows that it is more spread out.
Gaussian curve
The Gaussian curve or normal distribution is a graphical representation showing the probability of distribution of data. It has the shape of a symmetrical bell centered on the middle. The width of the curve is determined by the standard deviation.
68-95-99.7 rule (rule of thumb): Approximately 68% of the data is within one standard deviation of the mean, 95% is within two standard deviations, and 99.7% is within three standard deviations.
In statistics, understanding the mean and standard deviation allows you to infer a lot about the nature of the data and its trends, and the Gaussian curve provides an intuitive visualization of this information.
In finance, it is crucial to remember that data dispersion can be more random and unpredictable than traditional statistical models like the normal distribution suggest. Financial markets are often affected by unforeseen events or changes in investor behavior, which can result in return distributions with wider standard deviations or non-symmetrical distributions.
Trend Analysis with Standard Deviation by zdmre This script analyzes trends in financial markets using standard deviation.
The script works by first calculating the standard deviation of a security's price over a specified period of time. The script then uses this standard deviation to identify potential trend reversals.
For example, if the standard deviation of a security's price is high, this could indicate that the security is overvalued and due for a correction. Conversely, if the standard deviation of a security's price is low, this could indicate that the security is undervalued and due for a rally.
The script can be used to analyze any security, including stocks, bonds, and currencies. It can also be used to analyze different time frames, such as daily, weekly, and monthly.
How to Use the Script
To use the script, you will need to specify the following parameters:
Time frame: The time frame you want to analyze.
Standard deviation: The standard deviation you want to use.
Once you have specified these parameters, the script will calculate the standard deviation of the security's price over the specified time frame. The script will then use this standard deviation to identify potential trend reversals.
#DYOR

VWAP SpiderThe VWAP Spider indicator enhances the conventional Volume Weighted Average Price (VWAP) analysis by anchoring it to the first candle and incorporating an extensive series of standard deviation (SD) lines, extending up to +8 SDs with additional half-step increments. This configuration provides a more suitable set of lines for identifying support and resistance, distinguishing it from existing VWAP and SD indicators. Its design, featuring color gradients for fills and distinct labels for each line, aims to improve the utility and user experience.
Optimal Timeframes:
It is recommended for use on weekly or monthly resolutions to ensure all price and volume history is included.
Distinctive Features:
The indicator includes a more extensive array of SD lines than typically found in VWAP indicators, enhancing the depth of market analysis.
The visual presentation is optimized with color gradients and clear labeling, facilitating ease of use and integration into trading strategies.
Practical Use of the VWAP Spider:
SD Lines as Support and Resistance : Observe the interactions between the price and the SD lines closely. These can serve as dynamic support and resistance indicators, influencing trading decisions.
Analyzing Historical Price Action : Investigate how the price has historically interacted with the SD lines. Identify which lines have frequently acted as support and resistance in the past, as they will often continue to be revisited.
Strategic Application : Leverage insights from the interactions between price and SD lines to fine-tune entry and exit points. For example, a rebound from an SD line may suggest a strong entry point, while breaching an SD line could indicate a potential exit.
This indicator is freely available and open-source on TradingView for all. It is designed to help traders enhance their market analysis and strategic decision-making.

BTC Spread Indicator"Hot potato, Bitcoin style!
In the dynamic world of cryptocurrency, keeping an eye on price movements across different exchanges can be as exhilarating as a game of hot potato. By calculating the average Bitcoin price across major exchanges, we can then dive deeper to identify the spreads between this global average and the prices on individual exchanges. This analysis reveals who's currently 'holding the potato'—or dealing with higher prices—and predicts who might be next. It's a fun, yet insightful way to visualize market volatility and trading opportunities. Let's see where the potato lands next!"

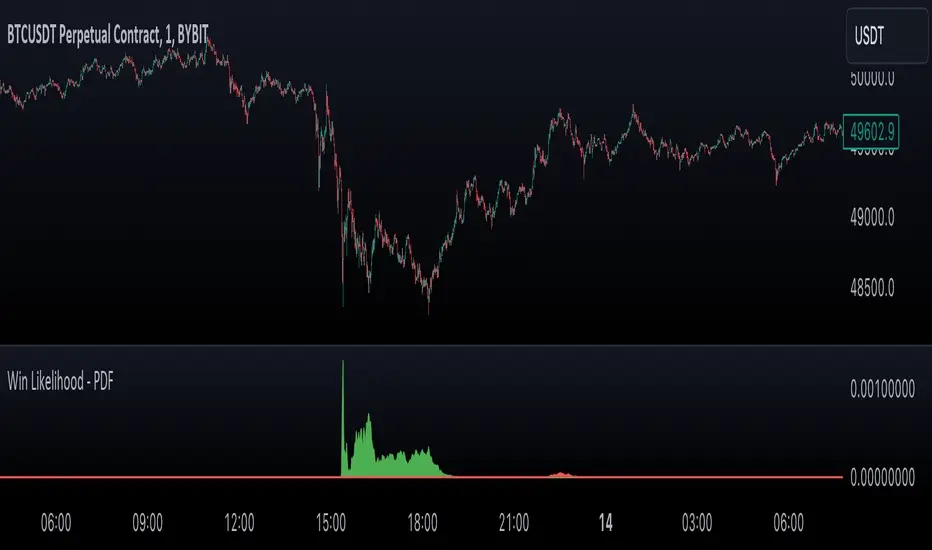
Likelihood of Winning - Probability Density FunctionIn developing the "Likelihood of Winning - Probability Density Function (PDF)" indicator, my aim was to offer traders a statistical tool to quantify the probability of reaching target prices. This indicator, grounded in risk assessment principles, enables users to analyze potential outcomes based on the normal distribution, providing insights into market dynamics.
The tool's flexibility allows for customization of the data series, lookback periods, and target settings for both long and short scenarios. It features a color-coded visualization to easily distinguish between probabilities of hitting specified targets, enhancing decision-making in trading strategies.
I'm excited to share this indicator with the trading community, hoping it will enhance data-driven decision-making and offer a deeper understanding of market risks and opportunities. My goal is to continuously improve this tool based on user feedback and market evolution, contributing to more informed trading practices.
This indicator leverages the "NormalDistributionFunctions" library, enabling easy integration into other indicators or strategies. Users can readily embed advanced statistical analysis into their trading tools, fostering innovation within the Pine Script community.
VWAP Bands @shrilssVWAP Bands Integrates VWAP with standard deviation bands to provide traders with insights into potential support and resistance levels based on volume dynamics. VWAP is a key metric used by institutional traders to gauge the average price a security has traded at throughout the trading day, taking into account both price and volume.
This script calculates the VWAP for each trading session and overlays it on the price chart as a solid line. Additionally, it plots multiple standard deviation bands around the VWAP to indicate potential areas of price extension or contraction. These bands are derived from multiplying the standard deviation of price by predetermined factors, offering traders a visual representation of potential price ranges.
Implied Volatility and Historical VolatilityThis indicator provides a visualization of two different volatility measures, aiding in understanding market perceptions and actual price movements. Remember to combine it with other technical analysis tools and risk management strategies for informed trading decisions. The two measures of volatility:
Implied Volatility: Based on the standard deviation of recent price changes, it represents the market's expectation of future volatility.
Historical Volatility: Measured by the daily high-low range as a percentage of the closing price, it reflects the actual volatility experienced recently. It is intended to be used along side the Mean and Standard Deviation Lines indicator.
Inputs:
Period (Days): Defines the number of past bars used to calculate both types of volatility.
Calculations:
Interpretation:
Comparing the lines: Divergence between the lines can indicate potential mispricing:
If the Implied Volatility is higher than the Historical Volatility, the market might be overestimating future volatility.
Conversely, if the Implied Volatility is lower, the market might be underestimating future volatility.
Monitoring trends: Track changes in both lines over time to identify potential shifts in volatility expectations or actual market behavior.
Limitations:
Assumes normality in price distribution, which may not always hold true.
Historical Volatility only reflects past behavior, not future expectations.
Consider other factors like market sentiment and news events for comprehensive volatility analysis.

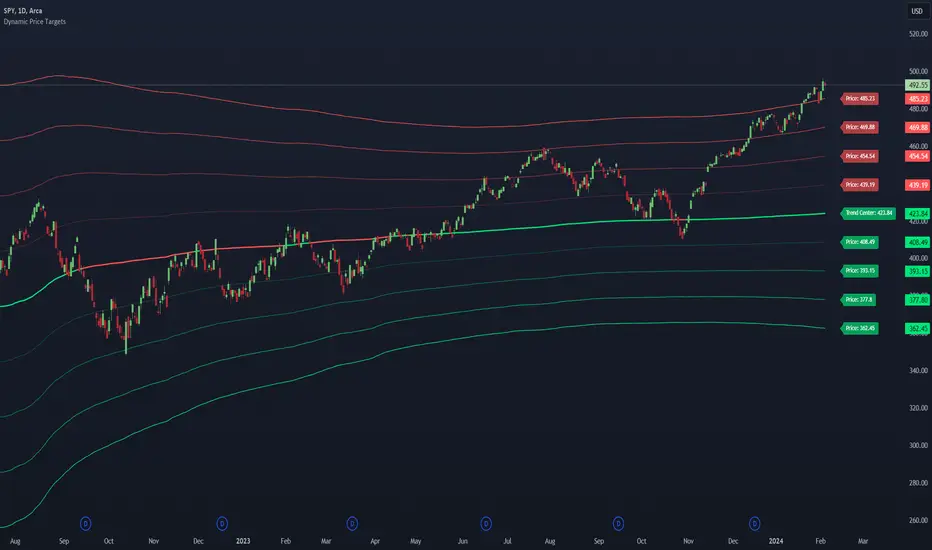
Dynamic Price Targets @shrilssDynamic Price Targets is a designed to provide traders with a comprehensive view of dynamic price levels based on Volume Weighted Moving Average (VWMA) and standard deviation. This script allows users to identify potential support and resistance zones, aiding in strategic decision-making during market analysis.
The script calculates the VWMA of a chosen price source over a specified length, establishing a dynamic baseline for market trends. The standard deviation is then used to derive multiple upper and lower targets, each representing a certain deviation from the VWMA. These levels are color-coded for clarity, with upper targets displayed in shades of red and lower targets in shades of green.
Modern Portfolio TheoryModern Portfolio Theory
The indicator is designed to apply the principles of Modern Portfolio Theory, a financial theory developed by Harry Markowitz. MPT aims to maximize portfolio returns for a given level of risk by diversifying investments.
User Inputs:
Users can customize various parameters, including the bar scale, risk-free rate, and the start year for the portfolio. Additionally, users can assign weights to different assets (symbols) in the portfolio.
Asset Selection:
Users can choose up to 10 different symbols (assets) for the portfolio. The script supports a variety of symbols, including cryptocurrencies such as BTCUSD and ETHUSD.
Weights and Allocation:
Users can assign weights to each selected asset, determining its percentage allocation in the portfolio. The script calculates the total portfolio weight to ensure it equals 100%. If total portfolio weight is lower then 100% you will see orange color with additional cash % bellow
If total portfolio weight is bigger then 100% you will see red big % warning.
Warning: (Total Weight must be 100%)
Cash Mode:
Risk and Return Calculation:
The script calculates the daily returns and standard deviation for each selected asset. These metrics are essential for assessing the risk and return of each asset, as well as the overall portfolio.
Scatter Plot Visualization:
The indicator includes a scatter plot that visualizes the risk-return profile of each asset. Each point on the plot represents an asset, and its position is determined by its risk (X-axis) and return (Y-axis).
Portfolio Optimization:
The script calculates the risk and return of the overall portfolio based on the selected assets and their weights. Based on the selected assets and their weights user can create optimal portfolio with preferable risk and return.
It then plots the portfolio point on the scatter plot, indicating its risk-return profile.
Additional Information:
The indicator provides a table displaying information about each selected asset, including its symbol, weight, and total portfolio weight. The table also shows the total portfolio weight and, if applicable, the percentage allocated to cash.
Visualization and Legend:
The script includes visual elements such as a legend, capital allocation line (CAL), and labels for risk-free rate and key information. This enhances the overall understanding of the portfolio's risk and return characteristics.
User Guidance:
The script provides informative labels and comments to guide users through the interpretation of the scatter plot, risk-return axes, and other key elements.
Interactivity:
Users can interact with the indicator on the TradingView platform, exploring different asset combinations and weightings to observe the resulting changes in the portfolio's risk and return.
In summary, this Pine Script serves as a comprehensive tool for traders and investors interested in applying Modern Portfolio Theory principles to optimize their portfolio allocations based on individual asset characteristics, risk preferences, and return

Z-score changeAs a wise man once said that:
1. beginners think in $ change
2. intermediates think in % change
3. pros think in Z change
Here is the "Z-score change" indicator that calculates up/down moves normalized by standard deviation (volatility) displayed as bar chart with 1,2 and 3 stdev levels.

CARNAC Elasticity IndicatorThe CARNAC Elasticity Indicator (EI) is a technical analysis tool designed for traders and investors using TradingView. It calculates the percentage deviation of the current price from an Exponential Moving Average (EMA) and helps traders identify potential overbought and oversold conditions in a financial instrument.
Key Features:
EMA Length: Users can customize the length of the Exponential Moving Average (EMA) used in the calculations by adjusting the "EMA Length" parameter in the indicator settings.
Percentage Deviation: The indicator calculates the percentage deviation of the current price from the EMA. Positive values indicate prices above the EMA, while negative values indicate prices below the EMA.
Maximum Deviations: The indicator tracks the maximum positive (above EMA) and negative (below EMA) percentage deviations over time, allowing traders to monitor extreme price movements.
Bands: Upper and lower bands are displayed on the indicator chart at 100 and -100, respectively. Additionally, dashed middle bands at 50 and -50 provide reference points for moderate deviations.
Dynamic Color Coding: The indicator uses dynamic color coding to highlight the current percentage deviation. It turns red for values above 50 (indicating potential overbought conditions), green for values below -50 (indicating potential oversold conditions), and purple for values in between.
How to Use:
Overbought Conditions: Watch for the percentage deviation to cross above 50, indicating potential overbought conditions. This might be a signal to consider selling or taking profits.
Oversold Conditions: Look for the percentage deviation to cross below -50, signaling potential oversold conditions. This could be an opportunity to consider buying or entering a long position.
Historical Extremes: Keep an eye on the upper and lower bands (100 and -100) to identify historical extremes in percentage deviation.
The CARNAC Elasticity Indicator can be a valuable tool for traders seeking to identify potential trend reversals and assess the strength of price movements. However, it should be used in conjunction with other technical analysis tools and risk management strategies for comprehensive trading decisions.

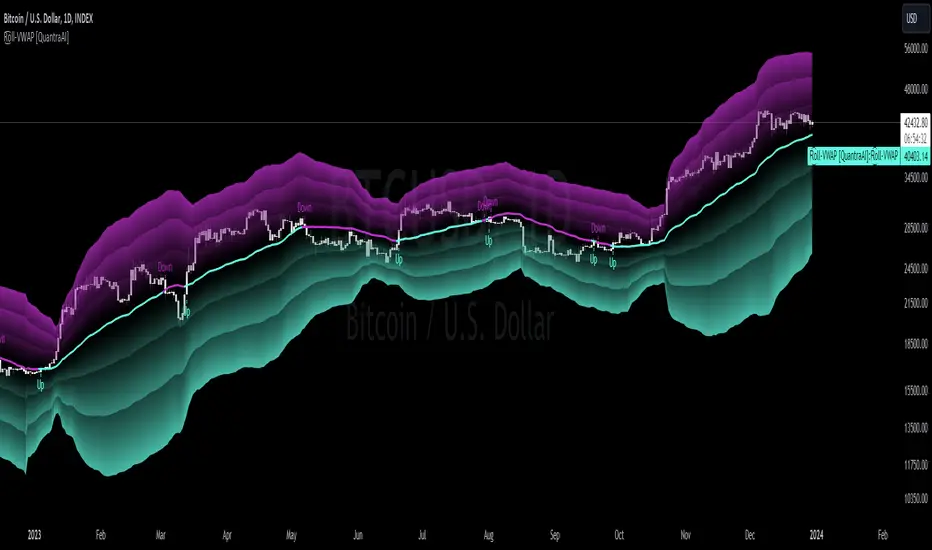
Rolling VWAP [QuantraSystems]Rolling VWAP
Introduction
The Rolling VWAP (R͜͡oll-VWAP) indicator modernizes the traditional VWAP by recalculating continuously on a rolling window, making it adept at pinpointing market trends and breakout points.
Its dual functionality includes both the dynamic rolling VWAP and a customizable anchored VWAP, enhanced by color-coded visual cues, thereby offering traders valuable flexibility and insight for their market analysis.
Legend
In the Image you can see the BTCUSD 1D Chart with the R͜͡oll-VWAP overlay.
You can see the individually activatable Standard Deviation (SD) Bands and the main VWAP Line.
It also features a Trend Signal which is deactivated by default and can be enabled if required.
Furthermore you can find the coloring of the VWAP line to represent the Trend.
In this case the trend itself is defined as:
Close being greater than the VWAP line -> Uptrend
Close below the VWAP line -> Downtrend
Notes
The R͜͡oll-VWAP can be used in a variety of ways.
Volatility adjusted expected range
This aims to identify in which range the asset is likely to move - according to the historical values the SD Bands are calculated and thus their according probabilities displayed.
Trend analysis
Trending above or below the VWAP shows up or down trends accordingly.
S/R Levels
Based on the probability distribution the 2. SD often works as a Resistance level and either mid line or 1. SD lines can act as S/R levels
Unsustainable levels
Based on the probability distributions a SD level of beyond 2.5, especially 3 and higher is hit very seldom and highly unsustainable.
This can either mean a mean reversion state or a momentum slowdown is necessary to get back to a sustainable level.
Please note that we always advise to find more confluence by additional indicators.
Traders are encouraged to test and determine the most suitable settings for their specific trading strategies and timeframes.
Methodology
The R͜͡oll-VWAP is based on the inbuilt TV VWAP.
It expands upon the limitations of having an anchored timeframe and thus a limited data set that is being reset constantly.
Instead we have integrated a rolling nature that continuously calculates the VWAP over a customizable lookback.
To also keep the base utility it is possible to use the anchored timeframes as well.
Furthermore the visualization has been improved and we added the coloring of the main VWAP line according to the Trend as stated above.
The applicable Trend signals are also part of that.
The parameter settings and also the visualizations allow for ample customizations by the trader.
For questions or recommendations, please feel free to seek contact in the comments.