Firex Data Trade 5* SetupIdentifies Boring, Quiet, No Supply / No Demand candles. "
+ "Highlights potential 5★ setups for trading confirmation when price breaks candle highs/lows. "
+ "Helps traders spot low-volume turning points and breakout opportunities
波动率

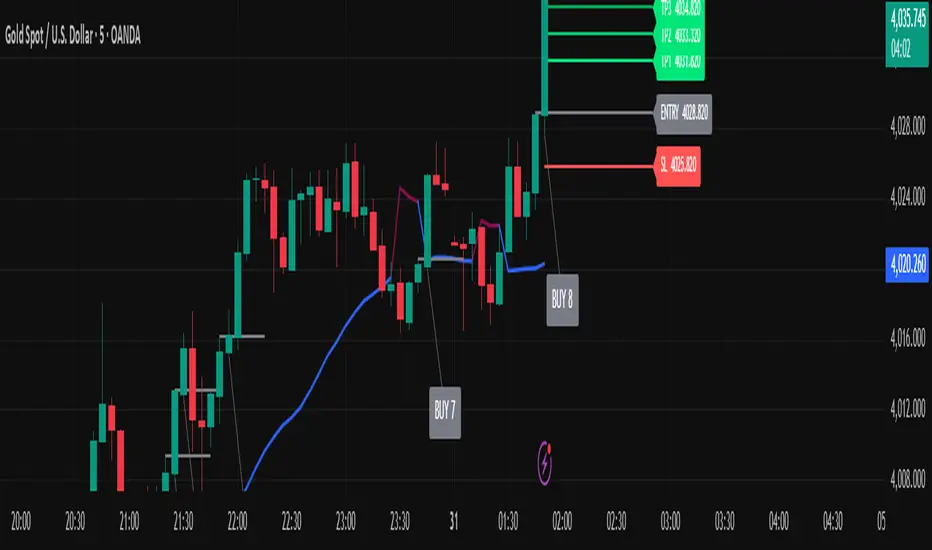
Daniel.Yer Volume Breakout Signal🧠 Summary – Daniel.Yer Volume Breakout Signal
The indicator only works on time frames of minutes.
An indicator that detects high-volume breakouts after the market opens and highlights potential entry zones.
Based on sampling the opening volume window and comparing it to the session’s volume peak.
Visually marks preparation areas (colored background) and plots BUY/SELL triangles for confirmation candles.
Includes real-time alert conditions for leading tickers: SPY, AAPL, MSFT, META, AMD, TSLA, NVDA, PLTR, GOOG, and AMZN.
Optimized for day trading — provides actionable alerts even when the user is offline.

Volume Weighted Keltner ChannelThis indicator provides a customizable implementation of Keltner Channels (KC), a volatility-based envelope designed to identify trend direction and potential reversal or breakout zones. It allows deep control over its core components and calculation methods.
Key Features:
Customizable Components: This implementation allows for full control over the channel's construction:
Basis Line: Choose from a wide range of moving average types (e.g., EMA, SMA, WMA) for the central line.
Volatility Bands: Select the volatility measure used to construct the bands: Average True Range (ATR), True Range (TR), or bar Range (High-Low).
Volume Weighting: An option (Volume weighted) allows for volume to be incorporated into the calculation of both the basis moving average and the selected volatility measure (e.g., creating a Volume-Weighted ATR). This makes the channel more responsive to moves backed by high market participation.
Logarithmic Scaling: The indicator includes an optional 'Normalize' mode that calculates the channel on a logarithmic scale. This creates bands that represent a constant percentage distance from the basis, making it a suitable tool for analyzing long-term trends in exponential markets.
Multi-Timeframe (MTF) Engine: The indicator includes an MTF conversion block. When a Higher Timeframe (HTF) is selected, advanced options become available: Fill Gaps handles data gaps, and Wait for timeframe to close prevents repainting by ensuring the indicator only updates when the HTF bar closes.
Integrated Alerts: Includes a full set of built-in alerts for the source price crossing over or under the upper band, lower band, and the central basis line.
DISCLAIMER
For Informational/Educational Use Only: This indicator is provided for informational and educational purposes only. It does not constitute financial, investment, or trading advice, nor is it a recommendation to buy or sell any asset.
Use at Your Own Risk: All trading decisions you make based on the information or signals generated by this indicator are made solely at your own risk.
No Guarantee of Performance: Past performance is not an indicator of future results. The author makes no guarantee regarding the accuracy of the signals or future profitability.
No Liability: The author shall not be held liable for any financial losses or damages incurred directly or indirectly from the use of this indicator.
Signals Are Not Recommendations: The alerts and visual signals (e.g., crossovers) generated by this tool are not direct recommendations to buy or sell. They are technical observations for your own analysis and consideration.

KCB Strategy [Ncentry]This strategy is a strong trend breaking strategy based on the Keltner channel.
Optimized for the bitcoin okx exchange chart.
Crypto Futures Basis Tracker (Annualized)🧩 What is Basis Arbitrage
Basis arbitrage is a market-neutral trading strategy that exploits the price difference between a cryptocurrency’s spot and its futures markets.
When futures trade above spot (called contango), traders can buy spot and short futures, locking in a potential yield.
When futures trade below spot (backwardation), the reverse applies — short spot and go long futures.
The yield earned (or cost paid) by holding this position until expiry is called the basis. Expressing it as an annualized percentage allows comparison across different contract maturities.
⚙️ How the Indicator Works
This tool calculates the annualized basis for up to 10 cryptocurrency futures against a chosen spot price.
You select one spot symbol (e.g., BITSTAMP:BTCUSD) and up to 10 futures symbols (e.g., DERIBIT:BTCUSD07X2025, DERIBIT:BTCUSD14X2025, etc.).
The script automatically computes the days-to-expiry (DTE) and the annualized basis for each future.
A table displays for each contract: symbol, expiry date, DTE, last price, and annualized basis (%) — making it easy to compare the forward curve across maturities.
⚠️ Risks and Limitations
While basis arbitrage is often considered low-risk, it’s not risk-free:
Funding and financing costs can erode returns, especially when borrowing or using leverage.
Exchange or counterparty risk — if one leg of the trade fails (e.g., exchange default, margin liquidation), the hedge breaks.
Execution and timing risk — the basis can tighten or invert before both legs are opened.
Liquidity differences — thin futures may have large bid-ask spreads or slippage.
Use this indicator for analysis and monitoring, not as an automated trading signal.
Disclaimer: Please remember that past performance may not be indicative of future results. Due to various factors, including changing market conditions, the strategy may no longer perform as well as in historical backtesting. This post and the script don't provide any financial advice.

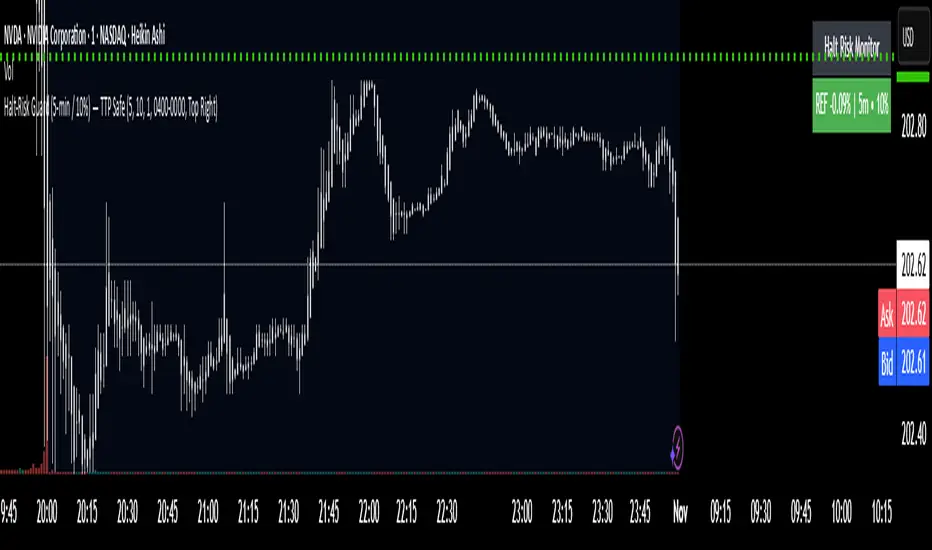
Halt-Risk Guard (5-min / 10%) — TTP Safe🛑 Halt-Risk Guard (5-min / 10%) — TTP Safe
Stay clear of halts, invalidations, and over-extended moves.
🔍 Overview
The Halt-Risk Guard helps traders avoid sudden invalidations by monitoring price velocity over the past X minutes (default: 5 min) and flagging when moves exceed a configurable threshold (default: 10%).
Originally built to meet Trade The Pool (TTP) risk-management rules — where even non-halted 10% moves can void trades — this tool provides a clear, visual warning system and optional entry blocker.
⚙️ Key Features
✅ Halt-Risk Detection – Calculates both reference-based and swing-based (high↔low) percentage change over the chosen lookback period.
✅ TTP Safe Mode – “Swing mode” captures extreme volatility spikes that may invalidate trades even when the market stays open.
✅ Entry Blocker (optional) – Automatically greys candles and dims the background during risky conditions to prevent impulsive entries.
✅ Customisable Positioning – Move the on-chart info box to any corner of your chart (Top Left / Top Right / Bottom Left / Bottom Right).
✅ Clean Alerts –
⚠️ At/Above Threshold
✅ Back to Safe
⛔ Entry Blocker Active
✅ Visual Table Display – Compact dashboard shows current % move, lookback window, and threshold with intuitive green/red status.
✅ Strategy-Ready Output – A hidden 0/1 plot lets you block or filter trades in automated systems.
⚡ How It Works
Monitors the selected symbol using your chosen computation timeframe (recommended 1-minute).
Evaluates either:
REF mode: Close-to-close change over the lookback window.
SWING mode: High-to-low range within the same window.
If the move ≥ Threshold %, the script highlights a halt-risk condition and optionally activates the entry blocker.
🎨 Recommended Settings
Lookback: 5 minutes
Threshold: 10 %
Swing mode: ON (TTP-safe)
Computation timeframe: 1 minute
Entry blocker: ON
Dim background: ON
🧠 Use Cases
TTP and other prop-firm evaluations enforcing price-movement limits.
Volatility-based scalping systems to avoid chasing extended candles.
Strategy filters for algorithmic entries (e.g. pause trading during halt-risk windows).
⚠️ Disclaimer
This tool provides visual and alert-based guidance only. It does not guarantee compliance with any specific firm’s rules or eliminate trading risk. Always verify thresholds and rules with your broker or evaluation provider.

GB · Set upUp & Confirmation (Lower Pane)The GB Set-Up & Confirmation Indicator transforms raw momentum into a clear, color-coded decision framework for intraday scalping.
It’s the heartbeat monitor of 0DTE trading — revealing when momentum quietly shifts and when it explodes into confirmation.
Milliseconds Ahead: Confirm-on-Prior mode mimics predictive confirmation, letting traders catch reversals before the lag candle.
Noise-Adaptive: Near-zero band filtering reduces false breaks from micro volatility.
Visual Precision: Dual markers and labeled confirmations remove hesitation in execution.
Configurable Latency: Sensitivity presets + fine-tune ensure adaptability from SPX 1-min charts to QQQ 5-min momentum waves.
Platform: Designed for lower-pane deployment beneath the main price chart.
Primary Use: Time-sensitive momentum confirmation for 0DTE SPX/SPY/QQQ scalps.
Typical Workflow:
Wait for Early (Set-Up) triangle near the zero band → signals momentum shift.
Enter on the Confirmed triangle (or one candle prior if using “Confirm on Prior”).
Exit when opposite signal fires or wave color fades (momentum exhaustion).
Complementary Indicators: Pairs seamlessly with GB TMA Overlay, GB ORB Shading, or Phoenix Fire Confluence for full-stack entry validation.
Adaptive Sensitivity Presets
- Aggressive: reacts early to momentum pulses (scalp mode).
- Balanced: optimized for intraday consistency.
- Strict: waits for full trend maturity (swing mode).

Adaptive AI Polar Oscillator [by Oberlunar]Adaptive AI Oscillator blends trading signals with two order-flow style oscillators and a lightweight online-learning model to keep it reactive, adaptive and computationally feasible.
What it is
A lightweight Multi Layer Perceptron (neural net) updates online on every bar, so it keeps adapting as conditions change.
An adaptive collector that fuses features like Price (close, ohlc4, etc...), a selectable (but not used in the original implementation) Moving Average (EMA/SMA/WMA/RMA/HMA/DEMA/TEMA), RSI, the classic volume datafeeds, plus two “OberPolar” oscillators computed above and below the current integral area price.
What you see
White line — the model’s denormalised forecast (in price units).
Colored price line — actual price, shown aqua when forecast ≥ price (“golden” bias) and red when forecast < price (“death” bias).
Why it helps
Combines heterogeneous information (trend, momentum, participation, regional buy/sell pressure) into a single adaptive forecast.
Online learning reduces regime staleness versus fixed-parameter indicators.
The aqua/red bias offers a quick, visual state for discretionary decisions.
How it works (intuitive)
Each AI input is standardised (z-score) with optional clamping to mitigate outliers.
A rolling window of recent values feeds a 2-layer AI to predict one step ahead.
After each bar closes, the model compares forecast vs. reality and nudges its weights (SGD with momentum, L2, optional gradient clipping).
The forecast is de-standardised back to price units and plotted as the white line.
Reading guide
Crossovers between forecast and price often mark potential bias flips.
Persistent aqua → model perceives supportive/positive conditions.
Persistent red → model perceives headwinds/negative conditions.
Complex Strategy — Oscillator Trendline Break
Connect the first pivot in the fading bias with the first pivot in the new bias, then trade the break of that line in the direction of the new bias.
Idea in one line
Use the Adaptive AI Oscillator (green = bullish bias, red = bearish). When bias flips, build a line across the oscillator pivots that “span” the transition; the break of that line times the entry.
Long setup (mirror for shorts)
Bias transition : a bearish (red) regime is ongoing, then the oscillator turns bullish (green).
Anchor pivots : take the first MIN in red just before/around the flip and the first MAX in green after the flip. Draw a trendline L through these two oscillator values (time–value line).
Trigger : enter LONG on the close that breaks above L —optional confirmations: price above your MA, non-decreasing volume, no immediate supply zone overhead.
Risk : stop below the last oscillator swing low or below a retest of L; first target at 1R–1.5R or at the opposite bias zone; trail under successive oscillator higher lows.
Short setup
Bias turns from green (bullish) to red (bearish).
Connect the first MAX in green to the first MIN in red → line L.
Enter SHORT on a close below L ; stop above the last oscillator swing high; symmetric targets/trailing.
Complex Strategy #2 — Bias-Pivot Breakout with Exit on Line Failure
Connect two pivots of the same bias to build a dynamic barrier; trade the breakout in the bias direction and exit when that line later fails.
Long play (mirror for shorts)
Build the line. During a green (bullish) phase, mark the first two local MAX of the oscillator. Connect them to form the yellow resistance line L (extend it right). If a new, clearer MAX appears before a break, re-anchor using the two most recent highs.
Entry trigger. Go LONG on a close above L (the “Break and LONG” in the image). Optional filters: price above your MA, rising volume, no immediate overhead level.
Risk. Initial stop: below the last oscillator swing low or below the retest of L . Position size for 1–2R baseline.
Exit. Close the long when the oscillator later breaks back below L (the “Break and LONG exit”), or on a bias flip to red, or at a fixed target/trailing under higher lows.
Short play (symmetric)
In a red phase, connect the first two local MIN to form support line L .
Enter SHORT on a close below L ; stop above the last oscillator swing high; exit on a break back above L or on a flip to green.
Notes
Require a minimum slope/spacing between pivots to avoid flat/noisy lines.
Re-anchor the line if fresher pivots emerge before a valid break.
Use with your regime filter (MA slope, higher-timeframe bias) to reduce whipsaws.
Complex Strategy #3 — Lateral Box & Zero-Slope Breakout
An easy way to understand sideways phases and the next price direction: draw two zero-slope lines (flat upper/lower bounds) across the oscillator’s lateral area; when a strong break occurs, trade in the direction of that break.
How to use it
Identify a lateral area on the oscillator (flat, low-variance region). Place a flat upper line on tops and a flat lower line on bottoms (slope ≈ 0).
Wait for a decisive break : close outside the band with expansion (range/true range rising, or a wide candle).
• Break up → bias for LONG .
• Break down → bias for SHORT .
Why it helps
Flat lines isolate congestion; the next impulsive move is often revealed by which side is broken with force.
It filters noise inside the range and focuses attention on the transition from balance → imbalance.
Practical filters (optional)
Require minimum bar body/ATR on the breakout candle to avoid false breaks .
Confirm with your regime filter (e.g., price above/below your MA) or a quick retest that holds.
Invalidate the signal if the price immediately returns inside the band on the next bar.
General Operational notes
If new pivots form before a break, re-anchor the line with the most recent qualifying pair (keeps the structure fresh).
Ignore very shallow lines (near-flat): require a minimum slope or angle to avoid noise.
Combine with your bias filter (e.g., MA slope/regime) to reduce false starts.
Limits & good practice
Adaptive models can react to noise; treat signals as context within a risk-managed plan.
No model predicts the future—this summarises evolving conditions compactly.
— Oberlunar 👁 ★

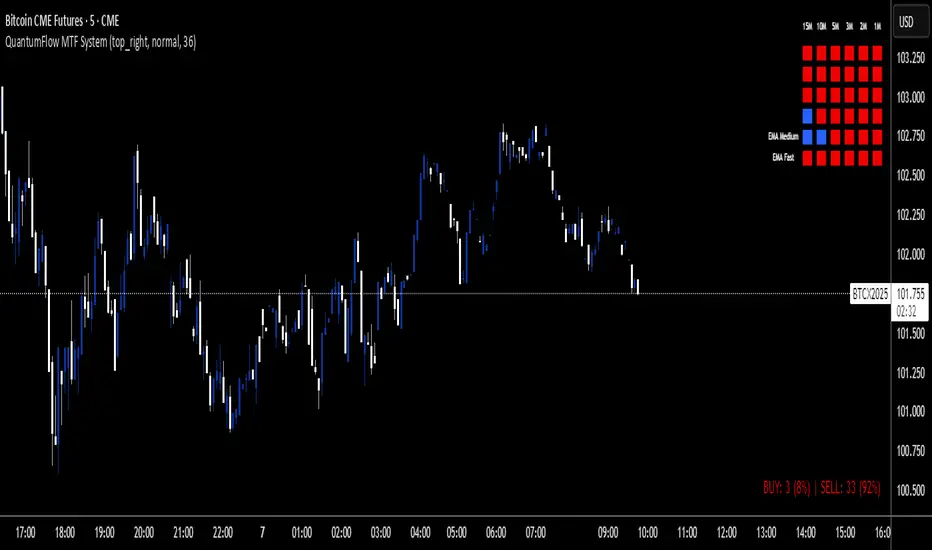
QuantumFlow MTF SystemQuantumFlow MTF System © 2025
Multi-Timeframe Directional Flow & Volatility Alignment Engine
QuantumFlow MTF System is designed to synchronize volatility- and trend-based signals from multiple timeframes into a single, structured view of market flow.
Concept
The system evaluates confirmed Supertrend directions from several lower timeframes, then aggregates them into normalized bullish/bearish values. These values are combined with dual-layer EMA momentum filters to verify directional strength. The resulting matrix provides a precise snapshot of alignment across short- to medium-term market structures.
Unlike classical ATR-based systems, QuantumFlow employs multiple ATR layers with multiple deviation factors that have been extensively tested over the years.
This multi-ATR framework acts as an adaptive volatility filter, allowing each asset class to respond dynamically to its intrinsic volatility profile.
The result is a robust and consistent analytical engine capable of adapting to varying market conditions across assets and timeframes.
How It Works
- Confirmed Multi-Timeframe Supertrend:
Each timeframe calculates a close-confirmed Supertrend direction, preventing repainting and ensuring signal reliability.
- Multi-ATR Volatility Model:
Several ATR instances with distinct deviation multipliers define volatility thresholds that adjust sensitivity across market conditions.
- Dual EMA Structure:
Two independent EMA layers act as momentum validators to confirm or filter each Supertrend direction.
- Flow Totals Engine:
The script sums all directional states into a real-time ratio of bullish vs bearish conditions, visualized through color-coded totals.
- Adaptive Alerts:
Optional thresholds allow traders to receive alerts when directional imbalance reaches predefined intensity levels.
Use Cases
- Identify when multiple timeframes align in the same trend direction.
- Quantify the relative dominance of bullish or bearish pressure.
- Filter trades using adaptive multi-ATR volatility filters per asset type.
- Confirm entries by validating multi-timeframe directional consensus.
Chart Display
QuantumFlow displays a structured table showing the state of each analyzed timeframe and the current flow balance. Works seamlessly on any instrument and timeframe.
This invite-only indicator provides a systematic way to analyze directional flow alignment using a multi-ATR volatility engine combined with momentum synchronization across multiple timeframes.
---
Author’s Instructions:
To request access, please contact the author privately through the TradingView profile.
Volatility Resonance CandlesVolatility Resonance Candles visualize the dynamic interaction between price acceleration, volatility, and volume energy.
They’re designed to reveal moments when volatility expansion and directional momentum resonate — often preceding strong directional moves or reversals.
🔬 Concept
Traditional candles display direction and range, but they miss the energetic structure of volatility itself.
This indicator introduces a resonance model, where ATR ratio, price acceleration, and volume intensity combine to form a composite signal.
* ATR Resonance: compares short-term vs. long-term volatility
* Acceleration: captures the rate of price change
* Volume Energy: reinforces the move’s significance
When these components align, the candle color “resonates” — brighter, more intense candles signal stronger volatility–momentum coupling.
⚙️ Features
* Adaptive Scaling
Normalizes energy intensity dynamically across a user-defined lookback period, ensuring consistency in changing market conditions.
* Power-Law Transformation
Optional non-linear scaling (gamma) emphasizes higher-energy events while keeping low-intensity noise visually subdued.
* Divergence Mode
When enabled, colors can invert to highlight energy divergence from candle direction (e.g., bearish pressure during bullish closes).
* Customizable Styling
Full control over bullish/bearish base colors, transparency scaling, and threshold sensitivity.
🧠 Interpretation
* Bright / High-Intensity Candles → Strong alignment of volatility and directional energy.
Often signals the resonant phase of a move — acceleration backed by volatility expansion and volume participation.
* Dim / Low-Intensity Candles → Energy dispersion or consolidation.
These typically mark quiet zones, pauses, or inefficient volatility.
* Opposite-Colored Candles (if divergence mode on) → Potential inflection zones or hidden stress in the trend structure.
⚠️ Disclaimer
This script is for educational purposes only.
It does not constitute financial advice, and past performance is not indicative of future results. Always do your own research and test strategies before making trading decisions.

Murrey Math SMA up to 32s Murrey Math SMA up to 32s is a highly advanced Pine Script v5 indicator that combines Murrey Math Lines (MML) with a customizable moving average (MA) — including a non-repainting Rolling VWAP (RVWAP) — and dynamic color-coded support/resistance bands up to 1/32 subdivisions. It projects octave-based geometric price levels (like Gann) centered on your chosen MA, with adaptive scaling, angle-based trend coloring, and absolute/extended MML bands. Includes 1/8, 1/16, and 1/32 grid lines, shaded zones, labels, and a live increment display.Core FeaturesFeature
Description
MA Types
SMA, VWMA, VWAP, Period VWAP, RVWAP (rolling VWAP over fixed or adaptive time window)
Murrey Math Grid
Auto-scaled 0/8 to 8/8 + extensions (±3/8), with 1/16 & 1/32 subdivisions
Dynamic Coloring
Bands colored by MA slope angle (bullish/bearish) or absolute MML shift
RVWAP Engine
Non-repainting volume-weighted average over user-defined or adaptive time steps
Wick Filtering
Optional ignore wicks for cleaner MML framing
Resolution Support
Works with higher timeframe data via request.security()
Key Use Cases Use Case
How to Use
1. Precision Support & Resistance
Treat 4/8 (mid) as pivot, 0/8 & 8/8 as extremes. Price often reverses or accelerates at these levels.
2. Mean Reversion Trades
Buy near 0/8–1/8 (oversold), sell near 7/8–8/8 (overbought) when MA is flat or sloping mildly.
3. Trend Continuation
When MA angle > threshold and price breaks 5/8, expect move to 8/8. Confirm with volume.
4. Breakout Entries
Watch for close beyond 8/8 or 0/8 + MA angle steep → strong momentum breakout.
5. Scalping with 1/32 Grid
Use 1/32 lines as micro-targets in ranging markets or after news spikes.
6. Volume-Weighted Fair Value
RVWAP = true average price paid over time → anchor for institutional fair value.
Visual Layout (MA-Centered)
+3/8 ───┐
+2/8 ───┤ ← Strong resistance
+1/8 ───┤
8/8 ███┤ ← Overbought (red zone)
7/8 ───┤
6/8 ███┤
5/8 ───┤
4/8 ███┤ ← Midline (pivot)
3/8 ───┤
2/8 ███┤
1/8 ───┤
0/8 ███┤ ← Oversold (green zone)
-1/8 ───┤
-2/8 ───┤
-3/8 ───┘
Shaded: 0/8–1/8 (buy), 7/8–8/8 (sell), 3/8–5/8 (neutral/consolidation)
MA Line: Orange (RVWAP) or hidden
Labels: Bottom, 1/4, Mid, 3/4, Top (offset to the right)
Table: Shows current Increment size
Best For Swing & scalp traders on stocks, forex, crypto
Volume-based strategies (RVWAP shines in high-volume moves)
Gann/Murrey Math enthusiasts wanting automation + modern MA anchoring

Uptrick: Volume Weighted BandsIntroduction
This indicator, Uptrick: Volume Weighted Bands, overlays dynamic, volume-informed trend channels directly on the chart. By fusing price and volume data through volume-weighted and exponential moving averages, the script forms a core trend line with adaptive bandwidth controlled by volatility. It is designed to help traders identify trend direction, breakout entries, and extended conditions that may warrant take-profits or pullback re-entries.
Overview
The Volume Weighted Bands system is built around a trend line calculated by averaging a Volume Weighted Moving Average (VWMA) and an Exponential Moving Average (EMA), both over a configurable lookback period. This hybrid trend baseline is then smoothed further and expanded into dynamic upper and lower bands using an Average True Range (ATR) multiplier. These bands adapt with market volatility and shift color based on prevailing price action, helping traders quickly identify bullish, bearish, or neutral conditions.
Originality and Unique Features
This script introduces originality by blending both price and volume in the core trend calculation, a technique that is more responsive than traditional moving average bands. Its multi-mode visualization (cloud, single-band, or line-only), combined with selective buy/sell signals, makes it flexible for discretionary and algorithmic strategies alike. Optional modules for take-profit signals based on z-score deviation and RSI slope, as well as buy-back detection logic with cooldown filters, offer practical tools for managing trades beyond simple entries.
Explanation of Inputs
Every user input in this script is included to give the trader control over behavior and visual presentation:
Trend Length (len): Defines the lookback window for both the VWMA and EMA, controlling the sensitivity of the core trend baseline. A lower value makes the bands more reactive, while a higher value smooths out short-term noise.
Extra Smoothing (smoothLen): Applies an additional EMA to the blended VWMA/EMA average. This second-level smoothing ensures the central trend line reacts gradually to shifts in price.
Band Width (ATR Multiplier) (bandMult): Multiplies the ATR to create the width of the upper and lower bands around the trend line. Larger values widen the bands, capturing more volatility, while smaller values narrow them.
ATR Length (atrLen): Sets the length of the ATR used in calculating band width and signal offsets. Longer values produce smoother band boundaries.
Show Buy/Sell Signals (showSignals): Toggles the primary crossover/crossunder entry signals, which are labeled when the close crosses the upper or lower band.
Visual Mode (visualMode): Allows selection between three display modes:
--> Cloud: Shows both bands and the central trend line with a shaded background.
--> Single Band: Displays only the active (upper or lower) band depending on trend state, with gradient fill to price.
--> Line Only: Shows only the trend line for a minimal visual profile.
Take Profit Signals (enableTP): Enables a z-score-based profit-taking signal system. Signals occur when price deviates significantly from the trend line and RSI confirms exhaustion.
TP Z-Score Threshold (tpThreshold): Sets the z-score deviation required to trigger a take-profit signal. Higher values reduce the frequency of signals, focusing on more extreme moves.
Re-Entries (enableBuyBack): Enables logic to signal when price reverts into the band after an initial breakout, suggesting a possible re-entry or pullback setup.
Buy Back Cooldown (bars) (buyBackCooldown): Defines a minimum bar count before a new buy-back signal is allowed, preventing rapid retriggering in choppy conditions.
Buy Offset and Sell Offset: Hidden inputs used to vertically adjust the placement of the Buy ("𝓤𝓹") and Sell ("𝓓𝓸𝔀𝓷") labels relative to the bands. These use ATR units to maintain proportionality across different instruments and timeframes.
Take-Profit Signal Module
The take-profit module uses a z-score of the distance between price and the trend line to detect extended conditions. In bullish trends, a signal appears when price is well above the band and RSI indicates exhaustion; the opposite applies for bearish conditions. A boolean flag is used to prevent retriggering until RSI resets. These signals are plotted with minimalist “X” markers near recent highs or lows, based on whether the market is extended upward or downward.
Re-Entry Logic
The re-entry system identifies instances where price momentarily dips or spikes into the opposite band but closes back inside, implying a continuation of the prevailing trend. This module can be particularly useful for traders managing entries after brief pullbacks. A built-in cooldown period helps filter out noise and prevents signal overloading during fast markets. Visual markers are shown as upward or downward arrows near the relevant candle wicks.
How to Use This Indicator
The basic usage of this indicator follows a directional, signal-driven approach. When a buy signal appears, it suggests entering a long position. The recommended stop loss placement is below the lower band, allowing for some breathing space to accommodate natural volatility. As the position progresses, take partial profits—typically 10% to 15% of the position—each time a take-profit signal (marked with an "X") is shown on the chart.
An optional feature is the buy-back signal, which can be used to re-enter after partial exits or missed entries. Utilizing this can help reduce losses during false breakouts or trend reversals by scaling in more gradually. However, it also means that in strong, clean trends, the full position may not be captured from the start, potentially reducing the total return. It is up to the trader to decide whether to enter fully on the initial signal or incrementally using buy-backs.
When a sell signal appears, the strategy advises fully exiting any long positions and immediately switching to a short position. The short trade follows the same logic: place your stop loss above the upper band with some margin, and again, take partial profits at each take-profit signal.
Visual Presentation and Signal Labels
All signals are plotted with clean, minimal labels that avoid clutter, and are color-coded using a custom palette designed to remain clear across light and dark chart themes. Bullish trends are marked in teal and bearish trends in magenta. Candles and wicks are also colored accordingly to align price action with the detected trend state. Buy and sell entries are marked with "𝓤𝓹" and "𝓓𝓸𝔀𝓷" labels.
Summary
In summary, the Uptrick: Volume Weighted Bands indicator provides a versatile, visually adaptive trend and volatility tool that can serve multiple styles of trading. Through its integration of price, volume, and volatility, along with modular take-profit and buy-back signaling, it aims to provide actionable structure across a range of market conditions.
Disclaimer
This indicator is for educational purposes only. Trading involves risk, and past performance does not guarantee future results. Always test strategies before applying them in live markets.

Volatility Dashboard (ATR-Based)Here's a brief description of what this indicator does:
- This measures volatility of currents based on ATR (Average True Range) and plots them against the smoothed ATR baseline (SMA of ATR for the same periods).
- It categorizes the market as one of the three regimes depending on the above-mentioned ratio:
- High Volatility (ratio > 1.2)
- Normal Volatility (between 0.8 and 1.2),
|- Low Volatility (ratio < 0.8, green)
- For each type of trading regime, Value Area (VA) coverage to use: for example: 60-65% in high vol trade regimes, 70% in normal trade regimes, 80-85% in low trade regimes
* What you’ll see on the chart:
- Compact dashboard in the top-right corner featuring:
- ATR (present, default length 20)
- ATR Avg (ATR baseline)
- The volatility regime identified based on the color-coded background and the coverage recommended for the VA.
Important inputs that can be adjusted:
- ATR Length (default 20) - “High/Low volatility thresholds” (default values: 1.2 – The VA coverage recommendations for each scheme (text) Purpose: - Quickly determine whether volatility is above/below average and adjust the coverage of the Value Area.
If you're using this for the GC1! Use 14 ATR Length, For ES or NQ Use Default Setting(20)

AMF PG Strategy v2.3AMF PG Strategy v2.3
1. Core Philosophy: Filtered and Volatility-Aware Trend Following
"AMF PG Strategy" is an advanced trend-following system designed to adapt to the dynamic nature of modern markets. The strategy's core philosophy is not just to follow the trend but also to wait for the right conditions to enter the market.
This is not a "black box." It is a rules-based framework that gives the user full control over various market filters. By requiring multiple conditions to be met simultaneously, the strategy aims to filter out low-quality signals and focus only on high-probability trend opportunities.
2. Core Engine: AMF PG Trend Following
At the heart of the strategy is a proprietary, volatility-aware trend-following mechanism called AMF PG (Praetorian Guard). This engine operates as follows:
Dynamic Bands: Creates a dynamic upper and lower band around the price that is constantly recalculated. The width of these bands is not fixed; It dynamically adjusts based on recent market volatility, volume flow, and price expansion. This adaptive structure allows the strategy to adapt to both calm and high-volatility markets.
Entry Signals: A buy signal is triggered when the price rises above the upper band. A sell signal is triggered when the price falls below the lower band. However, these signals are executed only when all the active filters described below give the green light.
Trailing Stop-Loss: When a position is entered, the opposite band automatically acts as a trailing stop-loss level. For example, when a buy position is opened, the lower band follows the price as a stop-loss. This allows for profit retention and trend continuation.
3. Multi-Layered Filter System: Understanding the Market
The power of this strategy comes from its modular filter system, which allows the user to filter market conditions based on their own analysis. Each filter can be enabled or disabled individually in the settings:
Filter 1: Trend Strength (ADX Filter): This filter confirms whether there is a strong trend in the market. It uses the ADX (Average Directional Index) indicator and only allows trades if the ADX value is above a certain threshold. This helps avoid trading in weak or directionless markets. It also confirms the direction of the trend by checking the position of the DMI (+DI and -DI) lines.
Filter 2: Sideways Market (Chop Index Filter): This filter determines whether the market is excessively choppy or directionless. Using the Chop Index, this filter aims to protect against fakeouts by blocking trades when the market is highly indecisive.
Filter 3: Market Structure (Hurst Exponent Filter): This is one of the strategy's most advanced filters. It analyzes the current market behavior using the Hurst Exponent. This mathematical tool attempts to determine whether a market tends to trend (permanent), tends to revert to the mean (anti-permanent), or moves randomly. This filter ensures that signals are generated only when market structure supports trending trades.
4. Risk Management: Maximum Drawdown Protection
This strategy includes a built-in capital protection mechanism. Users can specify the percentage of their capital they will tolerate to decline from its peak. If the strategy's capital reaches this set drawdown limit, the protection feature is activated, closing all open positions and preventing new trades from being opened. This acts as an emergency brake to protect capital against unexpected market conditions.
5. Automation Ready: Customizable Webhook Alerts
The strategy is designed for traders who want to automate their signals. From the Settings menu, you can configure custom alert messages in JSON format, compatible with third-party automation services (via Webhooks).
6. Strategy Backtest Information
Please note that past performance is not indicative of future results. The published chart and performance report were generated on the 4-hour timeframe of the BTCUSD pair with the following settings:
Test Period: January 1, 2016 - October 31, 2025
Default Position Size: 15% of Capital
Pyramiding: Closed
Commission: 0.0008
Slippage: 2 ticks (Please enter the slippage you used in your own tests)
Testing Approach: The published test includes 423 trades and is statistically significant. It is strongly recommended that you test on different assets and timeframes for your own analysis. The default settings are a template and should be adjusted by the user for their own analysis.

Sector Relative StrengthThis indicator measures a stock's Real Relative Strength against its sector benchmark, helping you identify stocks that are outperforming or underperforming their sector peers.
The concept is based on the Real Relative Strength methodology popularized by the r/realdaytrading community.
Unlike traditional relative strength calculations that simply compare price ratios, this indicator uses a more sophisticated approach that accounts for volatility through ATR (Average True Range), providing a normalized view of true relative performance.
Key Features
Automatic Sector Detection
Automatically detects your stock's sector using TradingView's built-in sector classification
Maps to the appropriate SPDR Sector ETF (XLK, XLF, XLV, XLY, XLP, XLI, XLE, XLU, XLB, XLC)
Supports all 20 TradingView sectors
Sector ETF Mappings
The indicator automatically compares your stock against:
Technology: XLK (Technology Services, Electronic Technology)
Financials: XLF (Finance sector)
Healthcare: XLV (Health Technology, Health Services)
Consumer Discretionary: XLY (Retail Trade, Consumer Services, Consumer Durables)
Consumer Staples: XLP (Consumer Non-Durables)
Industrials: XLI (Producer Manufacturing, Industrial Services, Transportation, Commercial Services)
Energy: XLE (Energy Minerals)
Utilities: XLU
Materials: XLB (Non-Energy Minerals, Process Industries)
Communications: XLC
Default: SPY (for Miscellaneous or unclassified sectors)
Customizable Settings
Comparison Mode: Choose between automatic sector comparison or custom symbol
Length: Adjustable lookback period (default: 12)
Smoothing: Apply moving average to reduce noise (default: 3)
Visual Clarity
Green line: Stock is outperforming its sector
Red line: Stock is underperforming its sector
Zero baseline: Clear reference point for performance
Clean info box: Shows which ETF you're comparing against
How It Works
The indicator calculates relative strength using the following methodology:
Rolling Price Change: Measures the price movement over the specified length for both the stock and its sector ETF
ATR Normalization: Uses Average True Range to normalize for volatility differences
Power Index: Calculates the sector's strength relative to its volatility
Real Relative Strength: Compares the stock's performance against the sector's power index
Smoothing: Applies a moving average to reduce single-candle spikes
Formula:
Power Index = (Sector Price Change) / (Sector ATR)
RRS = (Stock Price Change - Power Index × Stock ATR) / Stock ATR
Smoothed RRS = SMA(RRS, Smoothing Length)


Volatility Cones **Volatility Cones - Interactive**
This indicator visualizes volatility cones based on historical or manual volatility and projects them up to 252 trading days into the future.
**Features:**
- Automatic start at the first trading day of the year (customizable)
- Volatility calculation from historical data or manual input
- Display of ±1σ, ±2σ, and ±3σ bands
- Projection of expected price movements based on volatility
**Use Case:**
Ideal for options traders and risk management to assess expected price movements over different time horizons.

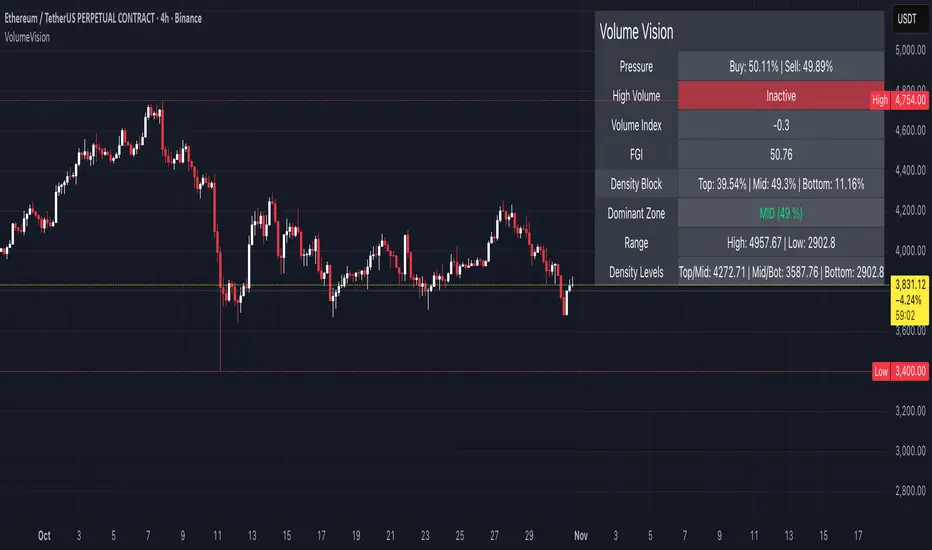
Volume VisionVolume Vision is a precision volume-analysis system that exposes how trading activity is distributed inside the current market range.
It divides the active price structure into three live zones — Top, Middle, and Bottom — and measures where real participation is concentrated.
This creates a dynamic “volume map” that allows you to instantly see whether the market is being driven by accumulation, distribution, or equilibrium.
At the heart of the indicator is a fully original implementation of the FGI — a proprietary composite metric designed to read market emotion and internal pressure.
It transforms several hidden components — volume, volatility, dominance, and directional momentum — into one unified curve of sentiment.
FGI values around 30 typically reflect phases of fear, capitulation, and potential accumulation.
Values near 80 mark conditions of greed, overextension, and possible distribution.
Observing these boundaries helps detect when the market is preparing to shift from compression to expansion or from euphoria to cooling.
Core Functions
Density Zones: Splits recent price movement into Top / Mid / Bottom areas, quantifying volume within each.
Dominant Zone: Highlights where the major share of liquidity currently resides.
Pressure Meter: Shows the balance between buy and sell volume in real time.
Volume Index: Normalizes present volume activity against its historical range to spot abnormal behaviour.
FGI Reading: Custom sentiment curve ranging from fear (≈ 30) to greed (≈ 80).
Alerts: Optional signals for High Volume and Rising Volume moments.
Dashboard: Compact on-chart table that summarizes all key readings without cluttering the view.
Interpretation Guide
When FGI drops near 30, the market often forms accumulation bases or bottom structures.
When FGI climbs toward 80, momentum usually reaches its limit and profit-taking or distribution begins.
A dominant Top zone with strong sell pressure indicates distribution, while Bottom dominance with buy pressure suggests accumulation.
Mid-zone dominance with neutral FGI reflects balance — a state of indecision before the next move.
Watch for volume spikes accompanied by FGI shifts: these often precede major impulse starts or ends.
Style: non-repainting core, minimal visuals, real-time clarity.
Created for traders who need to see where the energy is flowing, not just what price is printing.
by MahaTrend
Zscore correlation volatility Demi vie IlkerThis is an all-in-one "regime" dashboard for pairs trading. It's designed to stop you from taking bad mean-reversion trades by first identifying if the market conditions are stable.
It answers two key questions:
1. "Is this a good time to trade a mean-reversion strategy?" (The Regime Filter)
2. "If yes, how fast should I expect the trade to work?" (The Half-Life)
## 📈 Key Features
This script runs four main calculations at once:
1. The Price Z-Score (Blue Line)
This is your primary entry signal. It shows you how "cheap" (e.g., -2.0) or "expensive" (e.g., +2.0) the spread is relative to its short-term history (z_len).
2. The Regime Background (Green / Red)
This is the most important part. It acts as a "traffic light" for your trading:
• 🟢 GREEN (Stable Regime): It's safe to look for mean-reversion trades. This means both the correlation and volatility filters are stable.
• 🔴 RED (Unstable Regime): DO NOT trade mean-reversion. The relationship between the assets is broken. Any signal is likely a trap.
3. The Regime Filters (Your "Guards")
These two filters determine the background color:
• Correlation Z-Score (Purple Line): It measures the stability of the correlation. If this purple line drops below the red threshold (corr_z_threshold), it means the correlation has broken down, and the background turns RED.
• Volatility Ratio (Orange Line): It compares the volatility of the two assets. If one asset suddenly becomes much more volatile than the other (deviating from its average ratio), the background turns RED.
4. The Half-Life Dashboard (Top-Right Table)
This is your "speedometer." Based on an Ornstein-Uhlenbeck model, it calculates the average time (in bars) it takes for the spread to revert 50% of the way back to its mean.
• HL: 13.86 periods: You can expect it to take ~14 bars to go from a Z-Score of 2.0 to 1.0.
• N/A (Divergent): A critical warning. The math shows the spread is currently diverging and has no tendency to revert.
## 💡 How to Use This Indicator
Setup (Required):
1. Load a spread chart (e.g., type MES/MNQ or MGC/SIL into the TradingView search).
2. Add this indicator to the spread chart.
3. Go into the indicator's Settings (⚙).
4. In the "Inputs" tab, you must enter the two individual tickers:
• Symbol 1 Ticker: MGC
• Symbol 2 Ticker: SIL
(This is so the script can calculate the Correlation and Volatility filters).
Trading Signals
1. Mean-Reversion Signals
• BUY Signal (Green Triangle ▲): Appears only if the background is GREEN and the Price Z-Score (blue line) crosses below the -2.0 band.
• SELL Signal (Red Triangle ▼): Appears only if the background is GREEN and the Price Z-Score (blue line) crosses above the +2.0 band.
• EXIT: Your target is a reversion back to the 0 line. The Half-Life value gives you an idea of how long to wait.
2. Divergence Warning Signals
• Blue/Fuchsia Triangles (▲ / ▼): These appear at the exact moment the background turns RED. They warn you that the "stable" regime is broken and a new "divergence" or "trend" regime may be starting. This is a signal to stay out or manage any existing positions.
This tool is designed to add a layer of quantitative, risk-management logic to a standard Z-Score strategy. It helps you trade only when the statistics are in your favor.
Golden Ladder – Louay Joha (Wave & Gann Hi/Lo + ATR R-Levels)Overview
Golden Ladder is a momentum-and-structure tool that detects three-bar ladder waves and filters them with a Gann Hi/Lo regime guide (SMA-based). When a valid wave aligns with the current Hi/Lo bias and passes optional market filters (ADX, RSI, and proximity to recent extremes), the script prints BUY/SELL n labels (n = wave index) and draws a complete Entry / SL / TP1–TP4 ladder using ATR-based risk units (R) or fixed caps—configured for clarity and consistency. The script also keeps the chart clean: the last trade remains fully drawn while historical groups are trimmed to compact “ENTRY-only” stubs.
Why these components together (originality)
Three-bar ladder captures short-term momentum structure (progressively higher highs/lows for buys; the reverse for sells).
Gann Hi/Lo (SMA of highs/lows with a directional state) acts as a regime filter, reducing counter-trend ladders.
ATR-based R ladder turns signals into an actionable plan: a volatility-aware SL and TP1–TP4 that scale across instruments/timeframes.
Smart Entry filters (ADX strength, RSI extremes, and distance from recent top/bottom using ATR buffers) seek to avoid low-quality, stretched entries.
Slim history keeps only a short ENTRY stub for prior groups, so the signal you just got is always the most readable.
This is not a mere mashup; each layer constrains the others to produce fewer, clearer setups.
How it works (high-level logic)
Regime (Gann Hi/Lo):
Compute SMA(high, HPeriod) and SMA(low, LPeriod).
Direction state HLv flips when the close crosses above/below its track; one unified Hi/Lo guide is plotted.
Ladder signal (structure + confirmation):
BUY ladder: three consecutive green bars with rising highs and rising lows and HLv == +1.
SELL ladder: mirror conditions with HLv == -1.
Signals evaluate intrabar and are controlled by Smart Entry filters (ADX/RSI/extreme checks).
Risk ladder (R-based or capped):
Default: risk = ATR(atr_len) × SL_multiple and TPs in R.
Optional fixed caps by timeframe (e.g., M1/M5) using USD per point.
Longs: SL = entry – risk; TPi = entry + (Ri × risk).
Shorts: SL = entry + risk; TPi = entry – (Ri × risk).
All levels auto-reflow to the right as bars print.
Chart hygiene:
The latest trade shows ENTRY/SL/TP1–TP4 fully.
Older trades are automatically trimmed (only a short ENTRY line remains, with optional label).
Alerts:
BUY – Smart Entry (Tick) & SELL – Smart Entry (Tick) fire on live-qualified signals.
You can connect alerts to your automation, respecting your broker’s risk controls.
Inputs (English summary of UI)
Label settings: label size; ATR-based vs fixed-tick offsets; leader line width/transparency; horizontal label shift.
Gann Hi/Lo: HIGH Period (HPeriod), LOW Period (LPeriod).
Market filters: ADX (length, smoothing, minimum), RSI (length + caps), recent extremes (lookback + ATR buffer).
Entry/SL/TP Levels: TP1–TP4 (R), label right-shift, show last-trade prices on labels.
Fixed SL Caps: per-timeframe caps (M1/M5) via USD per point.
How to use
Apply on your instrument/timeframe; tune H/L periods and filters to your market (e.g., XAUUSD on M1/M5).
Favor signals aligned with the Hi/Lo regime; tighten filters (higher ADX, stricter RSI caps) to reduce noise.
Choose ATR-Risk or fixed caps depending on your preferences.
The drawing policy ensures the most recent trade remains front-and-center.
Notes & limitations
Signals can evaluate intrabar; MA-based context is inherently lagging.
ATR-based ladders adapt to volatility; extreme spikes can widen risk.
This is a technical analysis tool, not financial advice.