Call Put Relative Strength Call–Put Relative Strength compares the premium movement of a selected Call Option (CE) against a selected Put Option (PE) to reveal the underlying market’s bullish strength.
It calculates a clean ratio:
RS = CE / PE – 1
When Calls are gaining strength faster than Puts, the RS turns positive — signaling bullish momentum.
A smoothing moving average adds clarity and filters intraday noise.
This is a powerful tool for intraday traders who want to quickly identify whether buyers or sellers are dominating the market.
How to Use
1) Select CE and PE Symbols
Open indicator settings → manually enter:
Call Option (CE)
Put Option (PE)
Use same strike + same expiry.
2) Interpret RS
RS > 0 (Green) → Calls stronger → Bullish bias
RS < 0 (Red) → Puts stronger → Bearish bias
3) Use RS MA for Trend Confirmation
RS MA rising (Green) → Strength increasing
RS MA falling (Red) → Strength weakening
RS MA flat (Gray) → Market neutral
4) Best Use Cases
Intraday trend confirmation
Scalping CE trades
Avoiding false long entries
Tracking CE/PE rotation strength
Works best on 1m–10m charts
波动率

Session Volume Profile Sniffer: HVN & Rejection ZonesA simple tool built for traders who rely on intraday volume structure.
What this script does
This script tracks volume distribution inside a selected session and highlights two key price levels:
High Volume Nodes (HVNs) — areas where price spent time building heavy participation.
Low Volume Nodes (LVNs) — thin zones where price moved quickly with very little interest.
Instead of plotting a full profile, this tool gives you the exact rejection-level lines you usually hunt manually.
Why these levels matter
HVN → price tends to react, stall, or flip direction
LVN → price often rejects strongly since liquidity is thin
Rejection patterns around these areas give clean entry signals
Positioning trades around HVN/LVN helps filter noise in choppy sessions
This script removes the trouble of drawing profiles, counting bins, or guessing node levels. Everything is calculated inside the session you choose.
How the detection works
Inside your session window, the script:
1. Tracks each tick-based price bucket
2. Accumulates raw volume for every bucket
Identifies:
HVNs = buckets with volume above a tier
LVNs = buckets with volume below a tier
3. Prints each level as a single clean line
4. Generates:
Long signal → bounce from LVN
Short signal → rejection from HVN
Built-in exits use ATR-based conditions for quick testing.
Features
Session-based volume mapping
HVN + LVN levels drawn automatically
Entry triggers based on rejection
ATR exits for experimental backtests
Clean, minimal visual output
Best use cases
Intraday futures
Index scalping
FX sessions (London / NY)
Crypto sessions (user-timed)
Anyone who trades around volume structure
Adjustable settings
Session window
Volume bin size
HVN multiplier
LVN multiplier
Enable/disable zone lines
This keeps it flexible enough for both scalpers and slow-paced intraday setups.
Important note
This script is built for study + idea testing.
It is not intended as a final system.
Once you identify how price behaves around these nodes, you can blend this tool into your own setup.

KC Multi-TF ATR TableThis indicator is a comprehensive risk management tool designed to help traders gauge market volatility and determine rational Take Profit (TP) and Stop Loss (SL) levels. It allows you to analyze both the current timeframe and higher timeframes (15m, 1H, 4H, Daily) at a single glance.
Key Features:
Multi-Timeframe (MTF) Dashboard:
Displays ATR (Average True Range) values for fixed periods: 15 Minutes, 1 Hour, 4 Hours, and Daily, alongside your current chart timeframe.
Allows you to monitor whether general market volatility is expanding or contracting from a single panel.
Auto TP & SL Calculation:
Lists potential Long and Short targets for each timeframe based on your custom ATR multipliers.
Logic:
Buy TP: Close Price + (ATR x TP Multiplier)
Buy SL: Close Price - (ATR x SL Multiplier)
(Inverted logic applies for Sell setups.)
Dynamic On-Chart Lines:
Draws the calculated TP and SL levels directly on the chart for the current timeframe.
Lines extend 10 bars into the future, providing a visual reference for how close the price is to your targets.
Full Customization:
Calculation: You can adjust the ATR period and TP/SL multipliers to fit your strategy.
Visuals: Table position, text size, and all colors (buy, sell, background) can be personalized via the settings menu.
How to Use:
Trend Following: If ATR values on higher timeframes are increasing, it may indicate a strengthening trend.
Risk Management: Check the SL levels in the table before entering a trade to adjust your stop loss dynamically based on volatility.
Scalping: Use the on-chart lines as dynamic targets during support/resistance breakouts.

Bollinger Bands Forecast with Signals (Zeiierman)█ Overview
Bollinger Bands Forecast with Signals (Zeiierman) extends classic Bollinger Bands into a forward-looking framework. Instead of only showing where volatility has been, it projects where the basis (midline) and band width are likely to drift next, based on recent trend and volatility behavior.
The projection is built from the measured slopes of the Bollinger basis, the standard deviation (or ATR, depending on the mode), and a volatility “breathing” component. On top of that, the script includes an optional projected price path that can be blended with a deterministic random walk, plus rejection signals to highlight failed band breaks.
█ How It Works
⚪ Bollinger Core
The script first computes standard Bollinger Bands using the selected Source, Length, and Multiplier:
Basis = SMA(Source, Length)
Band width = Multiplier × StDev(Source, Length)
Upper/Lower = Basis ± Width
This remains the “live” (non-forecast) structure on the chart.
⚪ Trend & Volatility Slope Estimation
To project forward, the indicator measures directional drift and volatility drift using linear regression differences:
Basis slope from the Bollinger basis
StDev slope from the Bollinger deviation
ATR slope for ATR-based projection mode
These slopes drive the forecast bands forward, reflecting the market’s recent directional and volatility regime.
⚪ Projection Engine (Forecast Bands)
At the last bar, the indicator draws projected basis, upper, and lower lines out to Forecast Bars. The projected basis can be:
Trend (straight linear projection)
Curved (ease-in/out transition toward projected endpoints)
Smoothed (extra smoothing on projected basis/width)
⚪ Price Path Projection + Optional Random Walk
In addition to projecting the bands, the script can draw a price forecast path made of a small number of zigzag swings.
Each swing targets a point offset from the projected basis by a multiple of the projected half-width (“width units”).
Decay gradually reduces swing size as the forecast deepens.
The Optional Random Walk Blend adds a deterministic drift component to the zigzag path. It’s not true randomness; it’s a stable pseudo-random sequence, so the drawing doesn’t jump around on refresh, while still adding “natural” variation.
⚪ Rejection Signals
Signals are based on failed attempts to break a band:
Bear Signal (Down): price tries to push above the upper band, then falls back inside, while still closing above the basis.
Bull Signal (Up): price tries to push below the lower band, then returns back inside, while still closing below the basis.
█ How to Use
⚪ Forward Support/Resistance Corridors
Treat the projected upper/lower bands as a future volatility envelope, not a guarantee:
The upper projection ≈ is likely a resistance level if the regime persists
The lower projection ≈ is likely a support level if the regime persists
Best used for trade planning, targets, and “where price could travel” under similar conditions.
⚪ Regime Read: Trend + Volatility
The projection shape is informative:
Rising basis + expanding width → trend with increasing volatility (needs wider stops / more caution)
Flat basis + compressing width → contraction regime (often precedes expansion)
⚪ Signals for Mean-Reversion / Failed Breakouts
The rejection markers are useful for fade-style setups:
A Down signal near/after upper-band failure can imply rotation back toward the basis.
An Up signal near/after lower-band failure can imply snap-back toward the basis.
With MA filtering enabled, signals are constrained to align with the broader bias, helping reduce chop-driven noise.
█ Related Publications
Donchian Predictive Channel (Zeiierman)
█ Settings
⚪ Bollinger Band
Controls the live Bollinger Bands on the chart.
Source – Price used for calculations.
Length – Lookback period; higher = smoother, lower = more reactive.
Multiplier – Bandwidth; higher = wider bands, lower = tighter bands.
⚪ Forecast
Controls the forward projection of the Bollinger Bands.
Forecast Bars – How far into the future the bands are projected.
Trend Length – Lookback used to estimate trend and volatility slopes.
Forecast Band Mode – Defines projection behavior (linear, curved, breathing, ATR-based, or smoothed).
⚪ Price Forecast
Controls the projected price path inside the bands.
ZigZag Swings – Number of projected oscillations.
Amplitude – Distance from basis, measured in bandwidth units.
Decay – Shrinks swings further into the forecast.
⚪ Random-Walk
Adds controlled randomness to the price path.
Enable – Toggle random-walk influence.
Blend – Strength of randomness vs. zigzag.
Step Size – Size of random steps (band-width units).
Decay – Reduces randomness as the forecast deepens.
Seed – Changes the (stable) random sequence.
⚪ Signals
Controls rejection/mean-reversion signals.
Show Signals – Enable/disable signal markers.
MA Filter (Type/Length) – Filters signals by trend direction.
-----------------
Disclaimer
The content provided in my scripts, indicators, ideas, algorithms, and systems is for educational and informational purposes only. It does not constitute financial advice, investment recommendations, or a solicitation to buy or sell any financial instruments. I will not accept liability for any loss or damage, including without limitation any loss of profit, which may arise directly or indirectly from the use of or reliance on such information.
All investments involve risk, and the past performance of a security, industry, sector, market, financial product, trading strategy, backtest, or individual's trading does not guarantee future results or returns. Investors are fully responsible for any investment decisions they make. Such decisions should be based solely on an evaluation of their financial circumstances, investment objectives, risk tolerance, and liquidity needs.

Ghost Protocol: Smart Money HUD [Ash_TheTrader]👻 GHOST PROTOCOL: The Institutional HUD
"Stop trading blind. Start seeing where the Smart Money is hiding."
Most indicators lag. They tell you what happened. Ghost Protocol tells you what is happening right now by combining two powerful concepts: Volume Absorption (Whale Defense) and Kinematic Physics (Price Velocity).
This is not just an indicator; it is a complete Heads-Up Display (HUD) for scalpers and day traders on NQ, ES, Gold, and Crypto.
🧠 The Concept: Why It Works
Retail traders lose money for two reasons:
Selling into a bottom (where Whales are absorbing orders).
Buying a fake breakout (where price lacks the energy to continue).
Ghost Protocol solves both by visualizing the invisible battle between aggressive orders (Retail) and passive limit orders (Institutions).
🛠️ The 3 Core Features
1. The "Ghost Walls" (Reversal Detector) 🛡️
What it is: Detects when massive volume hits the market but Price fails to progress. This is Absorption. A "Whale" is using a Limit Order Wall to absorb panic selling or FOMO buying.
The Visual:
🟢 Green Ghost Bubble + Beam: Buyers are absorbing sellers. (Bullish Wall).
🔴 Red Ghost Bubble + Beam: Sellers are absorbing buyers. (Bearish Wall).
Sticky Tech: The bubbles "stick" to the wicks perfectly, regardless of zoom level.
2. The "Velocity Terminal" (Breakout Validator) 🚀
What it is: A Physics Engine for price. It calculates Jerk (Change in Acceleration). Standard breakouts often fail, but a breakout with high "Jerk" (Surge) rarely comes back.
The Visual:
🟣 Plasma Purple Candle: Valid Breakout. Price is moving with high physical energy. Safe to follow.
⚪ Grey/Dull Candle: Fakeout. Price broke a level but lacks energy. The move is likely a trap.
3. The Smart Money Dashboard 💻
A sleek, "Classy" panel in the bottom right corner.
Monitors both engines simultaneously:
GHOST WALL: Scans for Reversals (Buy/Sell Walls).
VELOCITY: Scans for Momentum (Surge/Fakeout).
🎯 How to Trade This Script
Strategy A: The "Whale Reversal" (Scalping)
Step 1: Wait for price to push hard into a level.
Step 2 : A Ghost Wall (Ghost Icon 👻) appears.
Step 3 : A vertical Neon Beam lights up the background.
Action: Take the reversal immediately. Place stop loss just behind the bubble.
Strategy B: The "Physics Breakout" (Trend Following)
Step 1: Price breaks a key resistance or support level.
Step 2: Look at the candle color.
If it is Plasma Purple: ENTER. The physics engine confirms true momentum.
If it is Grey: WAIT. It is likely a fakeout designed to trap you.
⚙️ Settings & Customization
Bubble Distance: Adjust how close the Ghost bubbles sit to the candles.
Sensitivity: Tune the "Jerk Threshold" for the physics engine.
Visuals: Toggle the Background Beams, Dashboard size, and Neon colors to fit your dark/light mode setup.
Created by @Ash_TheTrader Trade with the Whales, not against them.
SPX 0DTE Structured Chaos: UnHinged SPX 0DTE Structured Chaos: UnHinged ⚠️ v7.0 is an intraday momentum indicator designed exclusively for SPX 0DTE trading. It evaluates trades using price momentum, VWAP alignment, ADX trend strength, pivots, opening-range breakout levels, and gamma regime conditions, triggering signals only when confidence thresholds are met. ATR-based trailing stops and VWAP filters manage exits, and optional debug tables provide clear insight into the scoring behind each trade.

AlgoIndex NQ/MNQ FuturesAlgoIndex Futures v3.15 - NQ/MNQ (10-Minute RTH)
This strategy is specifically tailored for trading CME Nasdaq futures - NQ and MNQ, including continuous symbols such as NQ1!/MNQ1!. It is optimized for a 10-minute chart during U.S. Regular Trading Hours (RTH), utilizing session settings defined in the Inputs. This strategy is not intended for other futures contracts or markets.
Core Concept
The strategy employs an ATR-based trend-band model similar to Supertrend for identifying directional mechanism changes in NQ/MNQ. Trade signals are evaluated at the bar close, incorporating session and time-based safety techniques to mitigate lower-quality trading opportunities near session boundaries.
Recommended Use (Optimized Defaults)
The default input parameters are fine-tuned for NQ/MNQ on the 10-minute chart. Users are encouraged to utilize these defaults initially and to make incremental adjustments to one variable at a time to understand the impact on the strategy's performance, trading frequency, and risk profile.
Configurable Inputs
- Take Profit / Stop Loss Settings:
- Enable Stop Loss and define Stop Loss (Points)
- Enable Take Profit and define Take Profit (Points)
- Enable Trailing Stop and set both Trailing Stop (Points) and Trailing Offset (Points)
- Time Avoidance Filter:
- Enable Time Avoidance
- Avoid First X Minutes
- Avoid Last X Minutes
- Display Avoidance Zones (visual overlay)
- Session Filter and End-of-Day Management:
- Enable Session Filter
- Define Trading Session (default: 09:30-16:00)
- Select Session Timezone
- Option to Close Positions at Session End
- Specify EOD Close Minutes Before (default: 20)
- Safety Controls:
- Option to Close Before Holidays (when enabled, this feature allows the strategy to flatten positions prior to holiday or early close conditions)
- Automation Settings (Optional):
- Ticker Override (optional)
- Define Contracts (position size)
- Strategy Configuration:
- Trade Direction: Both / Long Only / Short Only
- Visual Configuration:
- Option to Show Buy/Sell Signals
- Highlight Trend Zones
- Display Info Table
- Customizable Bull/Bear Colors
Alerts and Automation (Optional)
This strategy can generate order-fill alert payloads for hooking into webhook-based automation solutions. Keep in mind to validate your alert type and your bridge/broker configuration during Replay and paper trading. Note that reversals may trigger two sequential actions (e.g., exit followed by new entry).
Backtest Notes (Optional)
For more precise historical fill data, consider enabling TradingView’s Bar Magnifier in Strategy Properties. Always apply consistent assumptions for commission and slippage when comparing backtest results.
Disclaimer
This script is intended for informational and educational purposes only and does not constitute investment advice. Trading futures carries significant risk and may result in losses that exceed the initial deposit. Backtested results are hypothetical and do not guarantee future performance.

Momentum Turtle Swing StrategyMomentum Breakout Swing Tool — Overview
This indicator is built for traders who like breakout-style swing entries with a simple, disciplined structure. It blends trend context + momentum confirmation to highlight moments when price is more likely to continue rather than chop.
Core idea
Focus on directional expansion: it looks for points where price starts moving decisively after a period of structure building.
Signals are filtered so they appear primarily when the market is showing a clear directional bias, not when it’s indecisive.
Confirmation concept
Uses a trend context filter to stay aligned with the dominant market direction.
Adds a momentum sanity check so signals are less likely to trigger when strength is fading.
Position logic (unique signals)
Designed to keep signals clean and non-spammy: it produces distinct entry markers instead of repeated triggers in the same direction.
The internal flow treats market states as “in-trade / out-of-trade” to keep the chart readable.
Exit philosophy
Exits are based on a reactive market reference (to adapt when momentum cools or structure shifts), rather than fixed targets.
The goal is to stay in the move while it’s healthy and step aside when conditions degrade.
Best conditions
Works best in markets with clear swings and breakout continuation behavior.
Less effective in tight ranges or noisy sideways phases, where breakouts can fail more often.
For educational and analytical purposes only. Always forward-test on different markets and timeframes.

Confluence Signal Intelligence Indicators (CSI Indicators)CSI - Confluence Signal Intelligence is a dual-oscillator analysis tool that combines two specialized indicators in a single pane. It provides visibility into cycle exhaustion and statistical deviation conditions to help identify potential turning points.
The Two Oscillators
CEI - Cycle Exhaustion Index (Upper Section)
CEI measures where price sits within its recent cycle range and detects momentum depletion states. It identifies moments when a move has stretched beyond typical levels, which historically have preceded mean-reversion.
Normalized range from -1.0 to +1.0
Configurable exhaustion thresholds
Reversal signals (REV) when extreme zones begin turning
Cycle wave overlay showing peak/trough phases
Stepped confluence indicator between sections
PRG - PDF Reversal Gauge (Lower Section)
PRG applies statistical transforms across multiple timeframes to measure deviation from price norms. It combines readings from primary and secondary periods to create a confluence assessment.
Multi-period analysis for timing and confirmation
Strong Confluence (SC) signals at statistical extremes
Confluence scoring when multiple periods align
Deviation bars showing distance from mean
Signal Types
CEI Signals:
REV - Reversal signal when exhaustion zone begins turning
Triangle markers - Entry into exhaustion zones
X markers - Extreme exhaustion levels
PRG Signals:
SC - Strong Confluence signal when threshold met
Triangle markers - Standard reversal signals
Diamond markers - Multi-period confluence alignment
Visual Design
The pane is divided into two distinct sections with a separator line:
Upper Section (CEI) - Cycle analysis with area fill and confluence stepping
Lower Section (PRG) - Statistical gauge with deviation bars
Color Coding - Gold for strong confluence, Green/Red for direction, Gray for neutral
Zone Backgrounds - Shaded areas marking overbought/oversold regions
Information Table - Real-time values, zones, confluence scores, and signals for both oscillators
Configuration
CEI Settings:
Cycle period and exhaustion lookback
Signal smoothing and sensitivity
Upper/lower exhaustion thresholds
Extreme level definition
PRG Settings:
Primary and secondary periods
Smoothing and extreme threshold
Confluence sensitivity
Strong confluence threshold
Multi-period confluence toggle
Layout Settings:
Adjustable vertical positioning
Independent scale factors for each oscillator
Separator position control
Alert Conditions
CEI Alerts - Bull/Bear reversals, extreme exhaustion levels
PRG Alerts - Strong confluence buy/sell, standard reversals
Combined Alerts - Both oscillators signaling together, strong combined confluence
Companion Indicator
CSI - Confluence Signal Intelligence is the main chart overlay that generates BUY/SELL signals with confidence classifications (HIGH/MEDIUM/LOW). This oscillator pane is designed to work alongside it, showing the cycle and statistical dynamics that contribute to signal generation.
When using both together:
Main CSI provides analytical signals directly on the price chart
This pane reveals the underlying CEI and PRG oscillator states
Aligned readings across both indicate stronger confluence
Reading the Pane
For potential long setups:
CEI in lower exhaustion zone (OS) and rising
PRG in oversold territory and turning up
REV or SC labels appearing
Both oscillators showing elevated confluence scores
For potential short setups:
CEI in upper exhaustion zone (OB) and falling
PRG in overbought territory and turning down
REV or SC labels appearing
Both oscillators showing elevated confluence scores
The oscillators may not signal on the exact same bar. When readings cluster within a few bars, this suggests developing conditions that warrant attention.
Risk Disclosure
This indicator measures technical conditions—not future price direction. Confluence scores represent analytical assessments based on statistical deviation and cycle position, not guarantees of market movement. All trading involves substantial risk of loss. Use this tool alongside your own analysis and proper risk management. No indicator can predict future price movements with certainty.
---
## AUTHOR'S INSTRUCTIONS:
```
To request access to CSI - Confluence Signal Intelligence , please send a private message or visit frontieralgo.com/tradingview.
For best results, use alongside the main CSI overlay on the price chart.

Confluence Signal Intelligence (CSI)CSI - Confluence Signal Intelligence is a professional-grade analytical overlay that evaluates market conditions across multiple dimensions simultaneously. Rather than relying on a single indicator, CSI synthesizes multiple evidence factors and classification models into unified BUY/SELL signals with confidence classifications.
What It Does
CSI identifies potential reversal zones by detecting when multiple independent analytical components align in the same direction. Each signal displays a confidence classification:
HIGH - Strong multi-factor alignment (Gold labels)
MEDIUM - Moderate factor alignment
LOW - Limited factor alignment
Important : The confidence level measures analytical consensus—not a prediction of trade outcome. A HIGH reading means multiple components agree on directional bias at that moment, not that the trade will be profitable.
Multi-Factor Analysis
The classification system evaluates conditions across several categories:
Statistical Extremes - Normalized price transforms that identify stretched conditions
Momentum Indicators - Multiple oscillators confirming oversold/overbought states
Cycle Analysis - Gauges measuring exhaustion and potential turning points
Trend Alignment - Multi-timeframe directional agreement
Market Structure - Break of Structure events and swing point analysis
Pattern Classification - Models comparing current conditions to historical setups
Volume Analysis - Confirming directional moves with participation
Divergence Detection - Price/momentum disagreements across multiple oscillators
Classification Components
CSI incorporates multiple classification models (KNN, gradient boosting approximation, perceptron) that analyze current market conditions against historical patterns. These models contribute to the overall confidence assessment by identifying setups with characteristics similar to past formations.
Smart Money Concepts
The indicator includes institutional trading concepts:
Break of Structure (BOS) - Markers when price violates significant swing points
Order Blocks - Potential support/resistance zones based on price structure
Fair Value Gaps (FVG) - Price imbalances that may act as future reference points
Regime Detection - Background coloring distinguishing trending vs. ranging conditions
Key Features
Non-Repainting Mode - Optional bar-close confirmation prevents signal changes on the current bar
Adaptive Thresholds - Automatically adjusts sensitivity based on market volatility
Signal Filtering - Option to hide LOW confidence signals to reduce noise
Configurable Cooldown - Minimum bars between signals to prevent overtrading
Comprehensive Dashboard - Real-time display of key metrics and states
Trend EMAs - 20/50/200 period moving averages for context
Extensive Alerts - Conditions for signals, structure breaks, divergences, and more
Intended Use
CSI is designed as a decision-support tool for traders conducting their own analysis. It identifies moments of technical alignment that may warrant further investigation—it does not guarantee profitable outcomes. Market results depend on numerous variables beyond any single analytical tool.
The indicator works across all markets and timeframes.
Companion Indicator
CSI - Confluence Signal Intelligence is published separately and displays the underlying oscillators in their own pane:
CEI (Cycle Exhaustion Index) - Cycle position and momentum depletion measurement
PRG (PDF Reversal Gauge) - Statistical deviation scoring
When used together, the main CSI overlay provides signals on the chart while the oscillator pane offers visibility into the cycle and reversal dynamics contributing to those signals.
Risk Disclosure
This indicator is an analytical tool—not financial advice. Past performance does not guarantee future results. All trading involves substantial risk of loss. Confidence levels reflect internal model agreement only and should be considered alongside broader market context, your own analysis, and sound risk management practices. No indicator can predict future price movements with certainty.
---
## AUTHOR'S INSTRUCTIONS:
```
To request access to CSI - Confluence Signal Intelligence, please visit frontieralgo.com/tradingview or send a private message.

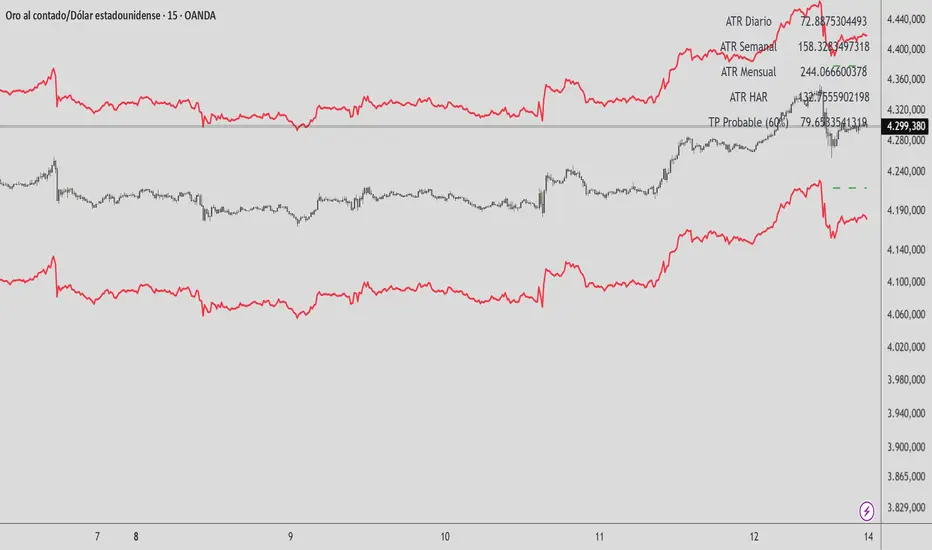
HAR Volatility ATR (Multi-Asset) - Andreus VillalobosIndicator based on the HAR (Hyper-Realized Volatility) model.
Combines daily, weekly, and monthly ATRs to project:
– Most probable price range (90%)
– Most probable take profit (60%)
Does not generate entry signals.
Designed for use in conjunction with:
market structure, liquidity, and price action.
Works on Forex, Indices, Gold, and Cryptocurrencies.

HAR Volatility ATR v1.0 (Andreus Villalobos)
Indicator based on the HAR (Hyper-Realized Volatility) model.
Combines daily, weekly, and monthly ATRs to project:
– Most probable price range (90%)
– Most probable take profit (60%)
Does not generate entry signals.
Designed for use in conjunction with:
market structure, liquidity, and price action.
Works on Forex, Indices, Gold, and Cryptocurrencies.
Renko Average Bricks This indicator calculates the average RENKO brick streaks. Streaks=consecutive bricks of the same color. EX. G= 1 streak of 1. GGG = 1 streak of 3. RR 1 streak of 2. Single bricks count. There is the option for look back period which can be changed but Defaults to 50. Calculates the last 50 completed green streaks and then averages them. Same with red streaks. Only closed bricks count.
Very Simple and can be used for targets, ect.
Cheers

TRV & nTRV - Trimmed Range VolatilityGrid bots require stable volatility measurement - ATR becomes misleading when gaps and sudden spikes distort the average. TRV (Trimmed Range Volatility) is an advanced version of ATR: it filters outliers at the extremes (highest and lowest ranges) and remains unaffected by gaps. This provides real-time, accurate volatility measurement for grid bot setup.Grid bots require stable volatility measurement - ATR becomes misleading when gaps and sudden spikes distort the average. TRV (Trimmed Range Volatility) is an advanced version of ATR: it filters outliers at the extremes (highest and lowest ranges) and remains unaffected by gaps. This provides real-time, accurate volatility measurement for grid bot setup.
Why We Developed TRV?
When a gap or sudden spike occurs in the morning, this extreme movement affects standard ATR calculations for an extended period. Even if the price moves sideways for the rest of the day, ATR remains elevated. This causes grid bots to operate with unnecessarily wide spacing and execute fewer trades.
TRV Advantages:
✅ Unaffected by Gaps: Opening gaps don't distort the calculation
✅ Extreme Point Elimination: Filters the largest and smallest outlier candles
✅ Real-Time Accuracy: Shows current market volatility
✅ Grid Bot Optimization: Enables tighter and more efficient grid spacing
✅ Comparison Capability: Compare different stocks and timeframes with nTRV
Grid Bot Usage:
The TRV value is used directly to calculate the number of grid lines:
(Resistance - Support) / TRV = Number of Grid Lines
Example:
Resistance: $110
Support: $90
TRV: $2
Grid Count: (110-90)/2 = 10 grid lines
Features:
Two Filtering Modes: Manual (enter number) or Percentage-Based (automatic ratio)
Four Indicators in One: nTRV, TRV, ATR, and nATR all displayed on the same panel
nTRV: Normalized value (percentage-based, for stock comparison)
TRV: Absolute value (currency-based, for grid calculation)
ATR & nATR Included: Standard ATR and nATR for direct comparison with TRV
Comprehensive Analysis: Compare filtered (TRV) vs unfiltered (ATR) volatility side-by-side
Default: 10% top, 10% bottom outlier elimination
Conclusion:
TRV is an advanced version of ATR specifically designed for grid bot traders. By filtering outlier movements, it provides more stable and reliable volatility measurement. The indicator includes both TRV (filtered) and ATR (unfiltered) on the same chart, giving traders a comprehensive view to make informed decisions. This dual-display approach enables more efficient grid strategies and increased trading frequency.

Vhenom ORB A+ (Professional)Vhenom ORB A+ (Professional)
Advanced Opening Range Breakout System with A+ Momentum & Failure Detection
What This Indicator Is
Vhenom ORB A+ (Professional) is a precision-built Opening Range Breakout system designed for active index futures traders who want early entries, objective confirmation, and protection against false breakouts.
This is not a generic ORB clone.
It is a multi-session, momentum-aware, reversal-aware trading framework built specifically to handle:
Explosive breakouts
Failed breakouts
Intraday continuation
Reversals back into range
Real-time decision-making (not just candle-close hindsight)
Core Philosophy
Most ORB indicators fail because they:
Only work at candle close
Treat all breakouts the same
Ignore volatility context
Provide no framework for failed moves
Vhenom ORB A+ solves all of that.
It does not tell you what to trade.
It tells you when conditions are objectively favorable.
🔹 Key Features
1️⃣ Multi-Session ORB Engine (NY Time)
Define ORBs across multiple intraday windows, not just the cash open:
NY Cash Open (09:30–09:45)
Midday Expansion
Power Hour
Evening Session
Overnight Sessions
Fully customizable ORB windows
Each ORB:
Draws High / Low / Midline in real time
Freezes when complete
Automatically rolls forward into the next session
No repainting of historical ORBs.
2️⃣ Real-Time Breakout Detection (Live Preview)
Unlike most indicators, Vhenom ORB A+ can signal intrabar:
Signals flicker live as price breaks the ORB
Signals confirm on candle close
If price re-enters the range, the signal disappears
This allows:
Earlier entries for aggressive traders
Confirmed entries for conservative traders
You choose.
3️⃣ A+ Momentum Engine (ATR-Based)
Not all breakouts are equal.
The A+ Engine measures candle expansion relative to ATR to identify true momentum breakouts.
When an A+ breakout occurs:
The candle is highlighted
The label upgrades to A+ Buy / A+ Sell
Optional filtering: require A+ for signals or use it as a visual upgrade
This helps eliminate:
Chop
Low-energy fake moves
Weak breakouts that stall immediately
4️⃣ Failure Mode (Reversal Detection)
This is where most ORB tools fall apart.
Vhenom ORB A+ actively monitors failed breakouts.
If price:
Breaks out of the ORB
Fails to hold
Re-enters the range within a defined window
The indicator generates:
R Buy (failed downside breakout)
R Sell (failed upside breakout)
With:
Acceptance-by-close logic
Minimum bar delay (no same-candle chaos)
Optional live preview
This allows traders to:
Capture reversals
Avoid chasing failed breakouts
Trade against trapped participants
5️⃣ Conflict Protection (No Mixed Signals)
The logic explicitly prevents:
Buy and Sell on the same candle
Breakout and reversal on the same bar
Overlapping signal noise
If a conflict ever exists:
Sell wins (conservative bias)
The system is intentionally opinionated to reduce indecision.
6️⃣ Candle Coloring for Immediate Context
Candle colors provide instant visual feedback:
A+ Breakout candles
Failed breakout reversal candles
Priority rules ensure clarity (Reversal > A+)
You can glance at the chart and know what just happened.
🔹 Designed For
This indicator is ideal for:
NQ / ES / MNQ / MES traders
GC / MGC traders
ORB, momentum, and reversal traders
Traders who scale quickly and manage stops tightly
Traders who want structure, not guesses
It works on any symbol or timeframe, but is optimized for index futures.
🔹 What This Is NOT
❌ Not a signal bot
❌ Not a “win every trade” system
❌ Not meant for set-and-forget trading
This tool gives high-quality decision points — execution is up to you.
🔹 Basic vs Professional
Basic Version
NY Cash Session ORB only
ORB lines only
No momentum logic
No reversals
Professional Version (This)
Multiple ORB sessions
Live breakout preview
A+ momentum detection
Failure / reversal detection
Advanced filtering & controls
Designed for real trading, not hindsight
🔹 Final Notes
This indicator was built by a trader, refined through real market behavior, and designed to expose opportunity and risk at the same time.
If you understand:
Opening ranges
Volatility
Acceptance vs rejection
Risk management
Vhenom ORB A+ gives you an edge — not a crutch.

VWAP Market FlowVWAP Flow Model
VWAP Flow Model is a VWAP-anchored market context indicator designed to help traders understand how price is behaving relative to fair value.
It evaluates the interaction between price, VWAP (Volume-Weighted Average Price), volatility, and momentum to classify prevailing market conditions such as trend continuation, expansion, mean reversion, and momentum decay.
Rather than issuing trade signals, the indicator focuses on identifying market state and execution quality.
Core framework:
-Adaptive VWAP with slope-based colouring
-VWAP acts as the central fair-value reference.
The VWAP line dynamically changes colour based on its slope:
-Rising VWAP → bullish pressure
-Falling VWAP → bearish pressure
-Flattening VWAP → balance, compression, or rotation
This allows traders to quickly assess directional bias and determine whether price movement is supported by underlying flow or occurring in a lower-quality environment.
Signal labels:
The indicator annotates key behavioural transitions to support visual interpretation of market state:
-IGN (Ignition) — Momentum expansion emerging from compression or balance, often marking the start of a directional move.
-CON (Continuation) — Price sustaining directional behaviour in alignment with VWAP slope.
-REV (Reversion) — Mean-reversion behaviour as price returns toward VWAP after extension.
-EXH (Exhaustion) — Loss of momentum or absorption after an extended move, often preceding rotation or regime change.
-MON (Displacement) — High-energy expansion bars indicating strong participation and structural shift.
These labels describe market behaviour, not trade instructions, and should be interpreted within the broader VWAP context.
Market behaviour classification:
The model continuously evaluates how price interacts with VWAP to determine whether the market is:
-directional and trending
-rotating around fair value
-accelerating away from value (expansion)
-losing momentum or showing signs of exhaustion
Classifications are derived from price displacement, volatility conditions, and momentum quality, rather than simple crossovers.
Filtering and control logic:
-Trend / Volatility Filter
Conditions market-state classification on the prevailing volatility and structural regime, helping prevent unstable or low-quality environments from producing misleading context shifts.
-Cooldown Filter
Enforces a minimum number of bars between classification updates to reduce rapid state-flipping in choppy conditions and keep context stable.
-Minimum Bars Between Signals
Controls the strictness of the cooldown logic.
Lower values increase responsiveness; higher values favour cleaner, more stable context changes.
-Tape Dominance Requirement (IGN)
Optional confirmation that requires directional signed-volume pressure to align with price behaviour before ignition-style classifications are allowed, helping distinguish genuine impulsive moves from weak or mechanically driven spikes.
-Tape Dominance Lookback
Defines the evaluation window used by the tape dominance filter.
Shorter lookbacks react faster; longer lookbacks require sustained participation.
Sensitivity and session controls:
Sensitivity modes adjust how responsive the model is to changing conditions:
-Aggressive — faster, more reactive (lower timeframes)
-Balanced — default intraday calibration
-Sniper — stricter thresholds, fewer but higher-quality classifications
Optional session filters allow the model to operate only during selected trading sessions, helping traders focus on higher-liquidity periods and avoid low-efficiency hours.
How to use it:
VWAP Flow Model is used as a context and confirmation layer, not a signal generator:
-Trade in the direction of VWAP slope during directional phases
-Expect mean reversion when price extends far from VWAP in balanced conditions
-Treat strong acceleration away from VWAP as expansion rather than chop
-Use flattening VWAP as an early warning of rotation or momentum loss
It integrates naturally with price action, structure-based analysis, and volume-aware workflows.
Indicator scope:
VWAP Flow Model provides objective market context and behavioural classification.
It does not generate direct trade signals and is designed to support discretionary decision-making.
Important notes:
Market classifications are probabilistic, not guarantees
Past behaviour does not imply future results
This indicator is a decision-support tool, not an automated trading system

GARCH Volume Volatility [MarkitTick]Title: GARCH Volume Volatility
Description
Overview
The GARCH Volume Volatility (GV) indicator is a sophisticated quantitative tool designed to analyze the rate of change in market participation. While the vast majority of technical indicators focus on Price Volatility (how much price moves), this script focuses on Volume Volatility (how unstable the participation is).
Market volume is rarely distributed evenly; it tends to cluster. Periods of high activity are often followed by more high activity, and periods of calm tend to persist. This behavior is known as "heteroskedasticity." This script utilizes an Exponentially Weighted Moving Average (EWMA) model—a core component of Generalized Autoregressive Conditional Heteroskedasticity (GARCH) frameworks—to model these changing variance regimes.
By isolating volume volatility from raw volume data, this tool helps traders distinguish between sustainable liquidity flows and erratic, unsustainable volume shocks that often precede market reversals or breakouts.
Methodology and Calculations
1. Logarithmic vs. Percentage Returns
The foundation of this indicator is the calculation of "Volume Returns"—the period-over-period change in volume.
- The script defaults to Logarithmic Returns. In financial statistics, log returns are preferred because they normalize data that can vary wildly in magnitude (such as cryptocurrency volume spikes), providing a more symmetric view of changes.
- Users can opt for standard percentage changes if they prefer a linear approach.
2. Variance Proxy (Squared Returns)
To measure volatility, the direction of the volume change (up or down) matters less than the magnitude. The script squares the returns to create a "Variance Proxy." This ensures that a massive drop in volume is treated with the same statistical weight as a massive spike in volume—both represent a significant change in the volatility of participation.
3. GARCH-Style Smoothing (EWMA)
Standard Moving Averages (SMA) treat all data points in the lookback period equally. However, volatility is dynamic. This script uses an EWMA model with a tunable "Lambda" (Decay Factor).
- The Recursive Formula: The current calculation relies on a weighted average of the current variance and the previous period's smoothed variance.
- Memory Effect: This allows the indicator to "remember" recent volatility shocks while gradually letting their influence fade. This mimics the GARCH process of conditional variance.
4. Dynamic Statistical Thresholds
The final output is the Volatility (square root of variance). To make this data actionable, the script calculates a dynamic upper and lower limit based on the standard deviation (Z-Score) of the volatility itself over a user-defined lookback period.
How to Use
The indicator plots a histogram that categorizes the market into four distinct volatility regimes:
1. High Volatility (Red Histogram)
Trigger: Volatility > High Band (Upper Standard Deviation).
Interpretation: This signals an extreme anomaly in volume stability. This is not just "high volume," but "erratic volume behavior." This often occurs at:
- Capitulation bottoms (panic selling).
- Euphoric tops (blow-off tops).
- Major news events or earnings releases.
2. Elevated Volatility (Maroon Histogram)
Trigger: Volatility > Mean Average.
Interpretation: The market is in an active state. Participation is changing rapidly, but within statistically normal bounds. This is common during healthy, trending moves where new participants are entering the market steadily.
3. Normal/Low Volatility (Green Histogram)
Trigger: Volatility is within the lower bands.
Interpretation: The market volume is stable. There are no sudden shocks in participation. This is typical of consolidation phases or "creeping" trends where the price drifts without significant volume conviction.
4. Extremely Low Volatility (Bright Green/Transparent)
Trigger: Volatility < Low Band.
Interpretation: The "calm before the storm." When volume volatility collapses to near-zero, it implies that the market has reached a state of equilibrium or disinterest. Historically, volatility is cyclical; periods of extreme compression often lead to violent expansion.
Settings and Configuration
Core Settings
- Use EWMA: When checked (Default), uses the recursive GARCH-style calculation. If unchecked, it reverts to a simple SMA of variance, which is less sensitive to recent shocks but more stable.
- Log Returns: Uses natural log for calculations. Highly recommended for assets with exponential growth or large volume ranges.
- Length: The baseline period for the calculation.
- Threshold Lookback: The number of bars used to calculate the Mean and Standard Deviation bands.
- EWMA Lambda: The decay factor (0.0 to 1.0). A value of 0.94 is standard for risk metrics.
-- Higher Lambda (e.g., 0.98): The indicator reacts slower and is smoother (long memory).
-- Lower Lambda (e.g., 0.80): The indicator reacts very fast to new data (short memory).
Visuals
- Show Thresholds: Toggles the visibility of the statistical bands on the chart.
- High Band (StdDev): The multiplier for the upper warning zone. Default is 1.5 deviations. Increasing this to 2.0 or 3.0 will filter for only the most extreme events.
Disclaimer This tool is for educational and technical analysis purposes only. Breakouts can fail (fake-outs), and past geometric patterns do not guarantee future price action. Always manage risk and use this tool in conjunction with other forms of analysis.

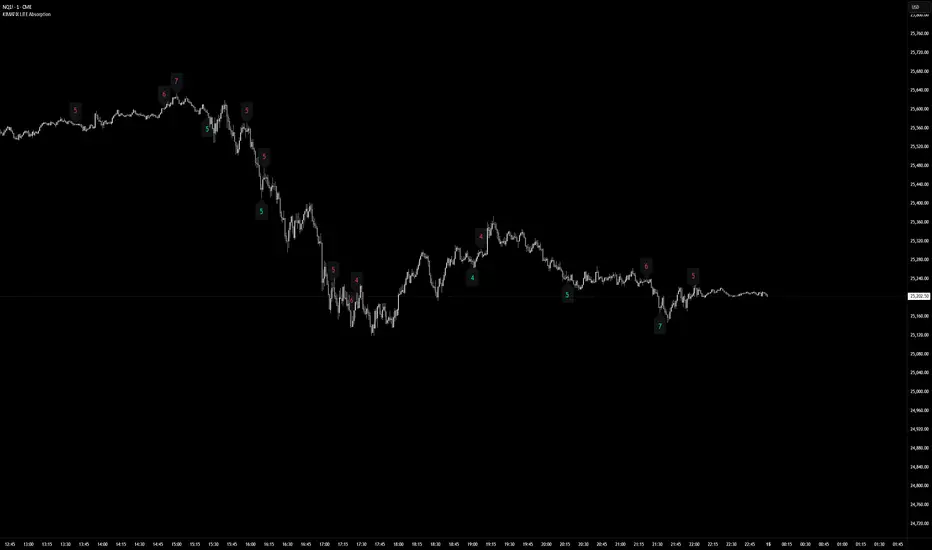
KIMATIX LITE AbsorptionThis indicator highlights absorption intensity directly on the chart using numeric sigma values only.
It is a deliberately reduced, signal-agnostic visualization designed to expose where significant absorption occurs, without adding levels, lines, or trade logic.
What you see
Numeric sigma values on candles
Each number represents the strength of absorption measured in standard deviations (σ).
Color-coded context
Green numbers below price → sell-side absorption
Red numbers above price → buy-side absorption
Only values that exceed the Minimum Sigma threshold are displayed.
No lines, zones, triangles, or alerts are shown — only the raw absorption magnitude.
How it works (LITE Version)
Absorption is derived from volume relative to candle structure
Values are normalized and filtered using:
A fixed statistical lookback
Wick dominance rules to avoid noise
Only statistically significant events (σ ≥ threshold) are visualized
All other calculations run silently in the background.
Intended use
This Lite version is meant to:
Identify areas of aggressive participation or defense
Spot potential absorption during trends or ranges
Provide context for liquidity, exhaustion, or hidden interest
It is not a trading system and does not generate entries or exits.
Use it as a contextual layer alongside your own execution logic.
The full version is distributed separately.
More information can be found here:
whop.com
KIMATIX LITE Delta ProfileThis indicator provides a clean, market-structure view of where participation concentrates and which side is in control across price levels.
The Lite version is intentionally reduced to focus on context over execution while keeping the visual identity of the full profile.
What is shown
Sentiment Profile (right side)
Displays directional dominance at each price level:
Bullish rows when buying pressure dominates
Bearish rows when selling pressure dominates
Point of Control (POC)
Value Area High / Low (VAH / VAL)
Lite Version
No left-side volume profile
No delta labels or historical delta tracking
No lower-timeframe or orderflow proxy
No alerts or event notifications
No visible-range logic or advanced controls
All calculations run on the chart timeframe only, making this version lighter and suitable for public use while preserving structural relevance.
Intended use
This indicator is designed to:
Identify high-interest price zones
Assess directional pressure at each level
Support bias and location decisions
Complement other execution or confirmation tools
It is not an entry or signal system and does not provide trade timing.
The full version is distributed separately.
More information can be found here:
whop.com

OC Chain_ROC_RSI15-minute indicator that detects a 3-candle “inside” chain where each candle’s open & close remain within the previous candle’s open-close range. Plots horizontal Open/Close levels on candles when ROC(2) moves beyond a configurable ±threshold, and highlights candles when RSI is strong (>55) or weak (< user set level, e.g., 30–32). Adjustable ROC/RSI settings and line extension options.

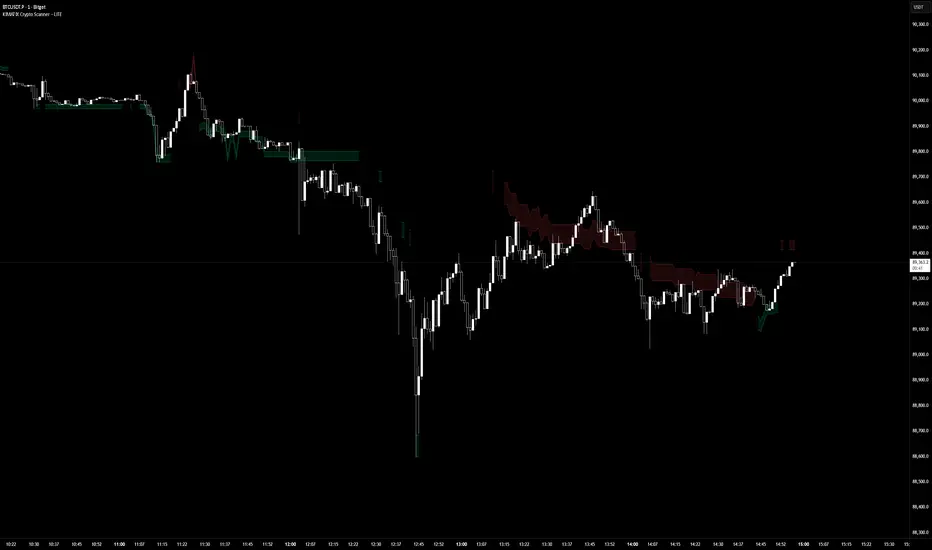
KIMATIX LITE Crypto ScannerKIMATIX Crypto Scanner
This indicator visualizes institutional demand and supply zones based on an automated volume profile calculation.
The Lite version is designed for context and market structure only:
Displays dynamic long and short zones
Helps identify high-interest price areas
Intended for bias and location, not execution
No signals, alerts, confirmations, or execution logic are included.
All advanced filters, timing logic, probability validation,
and trade management are reserved for the full version.
Use this tool to understand where price matters — not when to trade.
The full version is distributed separately.
More information can be found here:
whop.com
RSI WMA Crossover Momentum w/ HighlightRSI WMA Crossover Momentum
This is a momentum indicator that tracks the RSI. Its principle is to use the WMA line to determine the trend of the RSI, and from the RSI, the price trend can be determined.

Volume-Gated Trend Ribbon [QuantAlgo]🟢 Overview
The Volume-Gated Trend Ribbon employs a selective price-updating mechanism that filters market noise through volume validation, creating a trend-following system that responds exclusively to significant price movements. The indicator gates price updates to moving average calculations based on volume threshold crossovers, ensuring that only bars with significant participation influence the trend direction. By interpolating between fast and slow moving averages to create a multi-layered visual ribbon, the indicator provides traders and investors with an adaptive trend identification framework that distinguishes between volume-backed directional shifts and low-conviction price fluctuations across multiple timeframes and asset classes.
🟢 How It Works
The indicator first establishes a dynamic baseline by calculating the simple moving average of volume over a configurable lookback period, then applies a user-defined multiplier to determine the significance threshold:
avgVol = ta.sma(volume, volPeriod)
highVol = volume >= avgVol * volMult
The gated price mechanism employs conditional updating where the close price is only captured and stored when volume exceeds the threshold. During low-volume periods, the indicator maintains the last qualified price level rather than tracking every minor fluctuation:
var float gatedClose = close
if highVol
gatedClose := close
Dual moving averages are calculated using the gated price input, with the indicator supporting various MA types. The fast and slow periods create the outer boundaries of the trend ribbon:
fastMA = volMA(gatedClose, close, fastPeriod)
slowMA = volMA(gatedClose, close, slowPeriod)
Ribbon interpolation creates intermediate layers by blending the fast and slow moving averages using weighted combinations, establishing a gradient effect that visually represents trend strength and momentum distribution:
midFastMA = fastMA * 0.67 + slowMA * 0.33
midSlowMA = fastMA * 0.33 + slowMA * 0.67
Trend state determination compares the fast MA against the slow MA, establishing bullish regimes when the faster average trades above the slower average and bearish regimes during the inverse relationship. Signal generation triggers on state transitions, producing alerts when the directional bias shifts:
bullish = fastMA > slowMA
longSignal = trendState == 1 and trendState != 1
shortSignal = trendState == -1 and trendState != -1
The visualization architecture constructs a three-tiered opacity gradient where the ribbon's core (between mid-slow and slow MAs) displays the highest opacity, the inner layer (between mid-fast and mid-slow) shows medium opacity, and the outer layer (between fast and mid-fast) presents the lightest fill, creating depth perception that emphasizes the trend center while acknowledging edge uncertainty.
🟢 How to Use This Indicator
▶ Long and Short Signals: The indicator generates long/buy signals when the trend state transitions to bullish (fast MA crosses above slow MA) and short/sell signals when transitioning to bearish (fast MA crosses below slow MA). Because these crossovers only reflect volume-validated price movements, they represent significant level of participation rather than random noise, providing higher-conviction entry signals that filter out false breakouts occurring on thin volume.
▶ Ribbon Width Dynamics: The spacing between the fast and slow moving averages creates the ribbon width, which serves as a visual proxy for trend strength and volatility. Expanding ribbons indicate accelerating directional movement with increasing separation between short-term and long-term momentum, suggesting robust trend development. Conversely, contracting ribbons signal momentum deceleration, potential trend exhaustion, or impending consolidation as the fast MA converges toward the slow MA.
▶ Preconfigured Presets: Three optimized parameter sets accommodate different trading styles and market conditions. Default provides balanced trend identification suitable for swing trading on daily timeframes with moderate volume filtering and responsiveness. Fast Response delivers aggressive signal generation optimized for intraday scalping on 1-15 minute charts, using lower volume thresholds and shorter moving average periods to capture rapid momentum shifts. Smooth Trend offers conservative trend confirmation ideal for position trading on 4-hour to weekly charts, employing stricter volume requirements and extended periods to filter noise and identify only the most robust directional moves.
▶ Built-in Alerts: Three alert conditions enable automated monitoring: Bullish Trend Signal triggers when the fast MA crosses above the slow MA confirming uptrend initiation, Bearish Trend Signal activates when the fast MA crosses below the slow MA confirming downtrend initiation, and Trend Change alerts on any directional transition regardless of direction. These notifications allow you to respond to volume-validated regime shifts without continuous chart monitoring.
▶ Color Customization: Six visual themes (Classic, Aqua, Cosmic, Ember, Neon, plus Custom) accommodate different chart backgrounds and display preferences, ensuring optimal contrast and visual clarity across trading environments. The adjustable fill opacity control (0-100%) allows fine-tuning of ribbon prominence, with lower opacity values create subtle background context while higher values produce bold trend emphasis. Optional bar coloring extends the trend indication directly to the price bars, providing immediate directional reference without requiring visual cross-reference to the ribbon itself.
