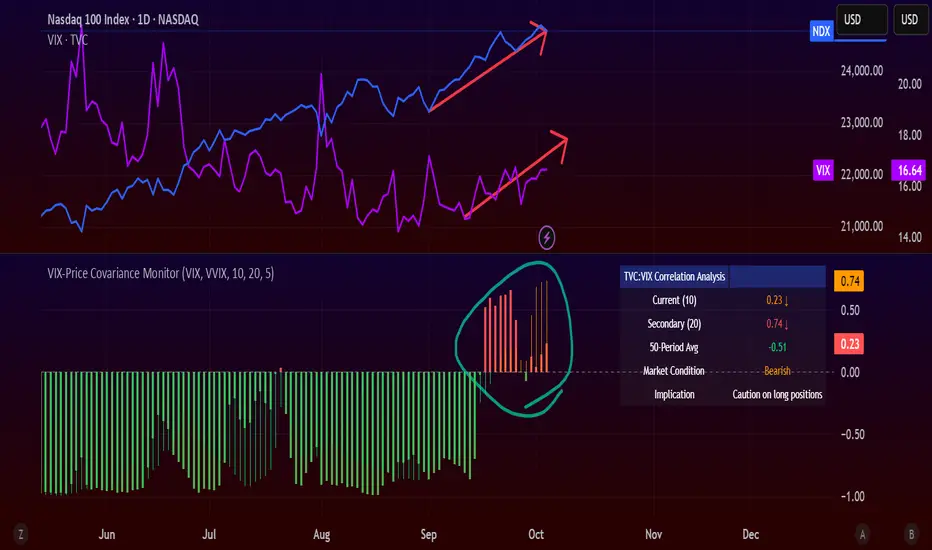
A few days ago, my custom VIX–Price Covariance Monitor started flashing red... and it hasn’t cooled off since.
Here’s what that means 👇
- The VIX (volatility index) and
  NDX (Nasdaq 100) are now moving in the same direction.
That’s not normal.
Usually, when stocks rise, volatility falls.
But when both start climbing together — it means something under the surface is fracturing.
Half the times this correlation flips positive, the market corrects or worse, it crashes.
I’m not panic‑selling, but I’m definitely not buying either for now.
No new longs unless it’s a screaming opportunity.
In the meantime? Stacking cash and sitting tight.
This is time to play close attention to the market,
Here’s what that means 👇
- The
That’s not normal.
Usually, when stocks rise, volatility falls.
But when both start climbing together — it means something under the surface is fracturing.
Half the times this correlation flips positive, the market corrects or worse, it crashes.
I’m not panic‑selling, but I’m definitely not buying either for now.
No new longs unless it’s a screaming opportunity.
In the meantime? Stacking cash and sitting tight.
This is time to play close attention to the market,
免责声明
这些信息和出版物并不意味着也不构成TradingView提供或认可的金融、投资、交易或其它类型的建议或背书。请在使用条款阅读更多信息。
免责声明
这些信息和出版物并不意味着也不构成TradingView提供或认可的金融、投资、交易或其它类型的建议或背书。请在使用条款阅读更多信息。