Technical Analysis and Outlook:
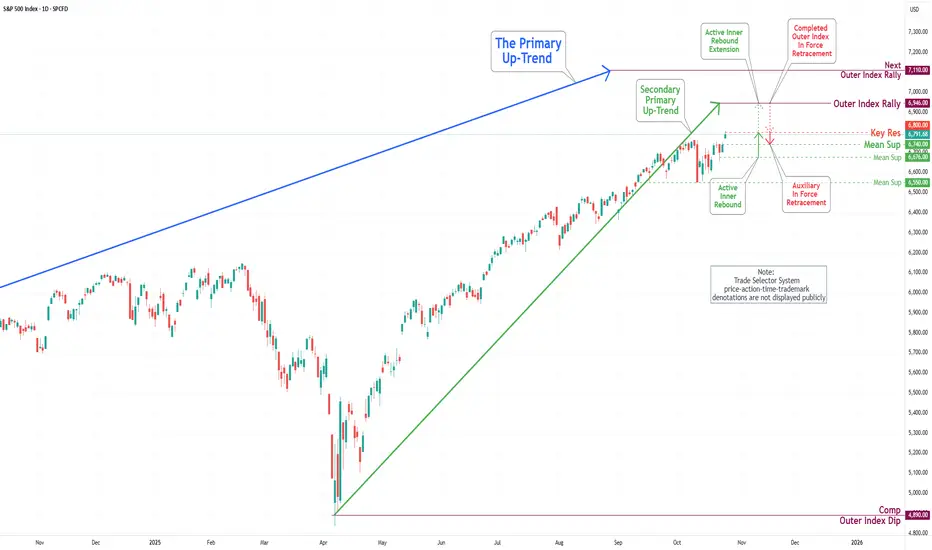
The most recent trading session exhibited significant volatility in the S&P 500 Index, marked by pronounced price fluctuations between the Mean Resistance at 6671 and the Key Resistance at 6753. This range served as a crucial threshold for market participants, prompting a series of rapid buying and selling that influenced the index's overall wild movement. Ultimately, this price action culminated in a breakout above the completed Outer Index Rally at 6768.
At present, the index is situated at the newly established Key Resistance level of 6800, which lies just below the historical high of 6807. This positioning indicates the potential for further upward momentum, as the prevailing trend suggests a well-structured Active Inner Rebound extension toward the Next Outer Index Rally target of 7110.
Conversely, it is imperative to acknowledge the possibility of a sustained, steady-to-lower pullback from the Key Resistance level of 6800 to Mean Support 6740 for the Secondary Primary Up-Trend to continue on its path.
免责声明
这些信息和出版物并不意味着也不构成TradingView提供或认可的金融、投资、交易或其它类型的建议或背书。请在使用条款阅读更多信息。