FxAST Ichi ProSeries Enhanced Full Market Regime EngineFxAST Ichi ProSeries v1.x is a modernized Ichimoku engine that keeps the classic logic but adds a full market regime engine for any market and instrument.”
Multi-timeframe cloud overlay
Oracle long-term baseline
Trend regime classifier (Bull / Bear / Transition / Range)
Chikou & Cloud breakout signals
HTF + Oracle + Trend dashboard
Alert-ready structure for automation
No repainting: all HTF calls use lookahead_off.
1. Core Ichimoku Engine
Code sections:
Input group: Core Ichimoku
Function: ichiCalc()
Variables: tenkan, kijun, spanA, spanB, chikou
What it does
Calculates the classic Ichimoku components:
Tenkan (Conversion Line) – fast Donchian average (convLen)
Kijun (Base Line) – slower Donchian average (baseLen)
Senkou Span A (Span A / Lead1) – (Tenkan + Kijun)/2
Senkou Span B (Span B / Lead2) – Donchian over spanBLen
Chikou – current close shifted back in time (displace)
Everything else in the indicator builds on this engine.
How to use it (trading)
Tenkan vs Kijun = short-term vs medium-term balance.
Tenkan above Kijun = short-term bullish control; below = bearish control.
Span A / B defines the cloud, which represents equilibrium and support/resistance.
Price above cloud = bullish bias; price below cloud = bearish bias.
Graphic
2. Display & Cloud Styling
Code sections:
Input groups: Display Options, Cloud Styling, Lagging Span & Signals
Variables: showTenkan, showKijun, showChikou, showCloud, bullCloudColor, bearCloudColor, cloudLineWidth, laggingColor
Plots: plot(tenkan), plot(kijun), plot(chikou), p1, p2, fill(p1, p2, ...)
What it does
Lets you toggle individual components:
Show/hide Tenkan, Kijun, Chikou, and the cloud.
Customize cloud colors & opacity:
bullCloudColor when Span A > Span B
bearCloudColor when Span A < Span B
Adjust cloud line width for clarity.
How to use it
Turn off components you don’t use (e.g., hide Chikou if you only want cloud + Tenkan/Kijun).
For higher-timeframe or noisy charts, use thicker Kijun & cloud so structure is easier to see.
Graphic
Before
After
3. HTF Cloud Overlay (Multi-Timeframe)
Code sections:
Input group: HTF Cloud Overlay
Vars: showHTFCloud, htfTf, htfAlpha
Logic: request.security(..., ichiCalc(...)) → htfSpanA, htfSpanB
Plots: pHTF1, pHTF2, fill(pHTF1, pHTF2, ...)
What it does
Pulls higher-timeframe Ichimoku cloud (e.g., 1H, 4H, Daily) onto your current chart.
Uses the same Ichimoku settings but aggregates on htfTf.
Plots an extra, semi-transparent cloud ahead of price:
Greenish when HTF Span A > Span B
Reddish when HTF Span B > Span A
How to use it
Trade LTF (e.g., 5m/15m) only in alignment with HTF trend:
HTF cloud bullish + LTF Ichi bullish → look for longs
HTF cloud bearish + LTF Ichi bearish → look for shorts
Treat HTF cloud boundaries as major S/R zones.
Graphic
4. Oracle Module
Code sections:
Input group: Oracle Module
Vars: useOracle, oracleLen, oracleColor, oracleWidth, oracleSlopeLen
Logic: oracleLine = donchian(oracleLen); slope check vs oracleLine
Plot: plot(useOracle ? oracleLine : na, "Oracle", ...)
What it does
Creates a long-term Donchian baseline (default 208 bars).
Uses a simple slope check:
Current Oracle > Oracle oracleSlopeLen bars ago → Oracle Bull
Current Oracle < Oracle oracleSlopeLen bars ago → Oracle Bear
Slope state is also shown in the dashboard (“Bull / Bear / Flat”).
How to use it
Think of Oracle as your macro anchor :
Only take longs when Oracle is sloping up or flat.
Only take shorts when Oracle is sloping down or flat.
Works well combined with HTF cloud:
HTF cloud bullish + Oracle Bull = higher conviction long bias.
Ideal for Gold / Indices swing trades as a trend filter.
Graphic idea
5. Trend Regime Classifier
Code sections:
Input group: Trend Regime Logic
Vars: useTrendRegime, bgTrendOpacity, minTrendScore
Logic:
priceAboveCloud, priceBelowCloud, priceInsideCloud
Tenkan vs Kijun alignment
Cloud bullish/bearish
bullScore / bearScore (0–3)
regime + regimeLabel + regimeColor
Visuals: bgcolor(regimeColor) and optional barcolor() in priceColoring mode.
What it does
Scores the market in three dimensions :
Price vs Cloud
Tenkan vs Kijun
Cloud Direction (Span A vs Span B)
Each condition contributes +1 to either bullScore or bearScore .
Then:
Bull regime when:
bullScore >= minTrendScore and bullScore > bearScore
Price in cloud → “Range”
Everything else → “Transition”
These regimes are shown as:
Background colors:
Teal = Bull
Maroon = Bear
Orange = Range
Silver = Transition
Optional candle recoloring when priceColoring = true.
How to use it
Filters:
Only buy when regime = Bull or Transition and Oracle/HTF agree.
Only sell when regime = Bear or Transition and Oracle/HTF agree.
No trade zone:
When regime = Range (price inside cloud), avoid new entries; wait for break.
Aggressiveness:
Adjust minTrendScore to be stricter (3) or looser (1).
Graphic
6. Signals: Chikou & Cloud Breakout
Code sections :
Logic:
chikouBuySignal = ta.crossover(chikou, close)
chikouSellSignal = ta.crossunder(chikou, close)
cloudBreakUp = priceInsideCloud and priceAboveCloud
cloudBreakDown = priceInsideCloud and priceBelowCloud
What it does
1. Two key signal groups:
Chikou Cross Signals
Buy when Chikou crosses up through price.
Sell when Chikou crosses down through price.
Classic Ichi confirmation idea: Chikou breaking free of price cluster.
2. Cloud Breakout Signals
Long trigger: yesterday inside cloud → today price breaks above cloud.
Short trigger: yesterday inside cloud → today price breaks below cloud.
Captures “equilibrium → expansion” moves.
These are conditions only in this version (no chart shapes yet) but are fully wired for alerts. (Future Updates)
How to use it
Use Chikou signals as confirmation, not standalone entries:
Eg., Bull regime + Oracle Bull + cloud breakout + Chikou Buy.
Use Cloud Breakouts to catch the first impulsive leg after consolidation.
Graphic
7. Alerts (Automation Ready)
[
b]Code sections:
Input group: Alerts
Vars: useAlertTrend, useAlertChikou, useAlertCloudBO
Alert lines like: "FxAST Ichi Bull Trend", "FxAST Ichi Bull Trend", "FxAST Ichi Cloud Break Up"
What it does
Provides ready-made alert hooks for:
Trend regime (Bull / Bear)
Chikou cross buy/sell
Cloud breakout up/down
Each type can be globally toggled on/off via the inputs (helpful if a user only wants one kind).
How to use it
In TradingView: set alerts using “Any alert() function call” on this indicator.
Then filter which ones fire by:
Turning specific alert toggles on/off in input panel, or
Filtering text in your external bot / webhook side.
Example simple workflow ---> Indicator ---> TV Alert ---> Webhook ---> Bot/Broker
8. FxAST Dashboard
Code sections:
Input group: Dashboard
Vars: showDashboard, dashPos, dash, dashInit
Helper: getDashPos() → position.*
Table cells (updated on barstate.islast):
Row 0: Regime + label
Row 1: Oracle status (Bull / Bear / Flat / Off)
Row 2: HTF Cloud (On + TF / Off)
Row 3: Scores (BullScore / BearScore)
What it does
Displays a compact panel with the state of the whole system :
Current Trend Regime (Bull / Bear / Transition / Range)
Oracle slope state
Whether HTF Cloud is active + which timeframe
Raw Bull / Bear scores (0–3 each)
Position can be set: Top Right, Top Left, Bottom Right, Bottom Left.
How to use it
Treat it like a pilot instrument cluster :
Quick glance: “Are my trend, oracle and HTF all aligned?”
Great for streaming / screenshots: everything important is visible in one place without reading the code.
Graphic (lower right of chart )
带和通道

Advanced Linear Regression Pro [PointAlgo]Advanced Linear Regression Pro is an open-source tool designed to visualize market structure using linear regression, volatility bands, and optional volume-weighted calculations.
The indicator expands the concept of regression channels by adding higher-timeframe confluence, slope analysis, imbalance detection, and breakout highlighting.
Key Features
• Volume-Weighted Regression
Weights the regression curve based on volume to highlight periods of strong participation.
• Dynamic Standard-Deviation Bands
Upper and lower bands are derived from volatility to help visualize potential expansion or contraction zones.
• Multi-Timeframe (MTF) Regression
Plots higher-timeframe regression lines and bands for additional trend context.
• Slope Strength Analysis
Helps identify whether the current regression slope is trending upward, downward, or in a neutral range.
• Order Flow Imbalance Detection
Highlights bars where price and volume move unusually fast, which may indicate liquidity voids or imbalance zones.
• Breakout Markers
Shows simple visual markers when the price closes beyond volatility bands with volume confirmation.
These are visual signals only, not trading signals.
How to Use
This indicator is meant for visual market analysis, such as:
Observing trend direction through regression slope
Spotting volatility expansions
Comparing price against higher-timeframe regression structure
Identifying areas where price moves rapidly with volume
It can be used on any market or timeframe.
No part of this script is intended as financial advice or a complete trading system.

90D High % Pullback Lines (Hybrid 10 Lines)90D High % Pullback Lines (Hybrid 10 Lines) visualizes drawdown levels from the 90-day high, with up to 10 fully customizable percentage-based lines.
This tool makes it easy to identify pullbacks, dip-buy zones, trend continuation points, and discount regions in any market.
🔍 Features
✅ Up to 10 customizable pullback levels
Each line has its own % drop setting
Turn any line ON/OFF individually
Example presets: −10%, −20%, −30%, … −95%
✅ Two rendering modes
1. Hybrid Fixed Line Mode (Stable / Anti-Shift)
Prevents line drift caused by chart updates
Keeps horizontal levels synchronized on every bar
Best stability for intraday & real-time use
2. Lightweight plot (stepline) Mode
Ideal for backtesting
Fully compatible with alerts
Clean and fast rendering
✅ Supports daily-based 90-day high
Even on lower timeframes, the indicator can use the daily 90-day high
Ideal for MTF (multi-timeframe) analysis
🎯 Use Cases
Instantly see how far price has pulled back (%) from the 90-day high
Build systematic dip-buy / trend-follow setups
Identify discount zones during volatility
Monitor recovery signals after strong sell-offs
Works great for crypto, FX, indices, and stocks
🚨 Alerts Included
Alerts trigger when closing price crosses any selected pullback line
Useful for automated dip-buy alerts, breakout alerts, etc.
📌 Notes
Due to internal TradingView behavior, public indicators may behave slightly differently from real-time script editing mode.
The Hybrid Line Mode is designed to provide the most stable and drift-free line display.

🔰BGL Algo Break out and Trend Indicator publicdesigned for public use no charges identifying chart trends

Trend-Adaptive 3-Band Reversal CloudThis indicator plots a trend-adaptive, volatility-based 3-band cloud on your chart to visually contextualize potential high-probability reversal, balance, and exhaustion price zones — all in strict alignment with TradingView’s house rules and best compliance practices.
How It Works
Trend Detection:
The script determines short-term trend direction using two adjustable EMAs (fast and slow). When the fast EMA is above the slow, the environment is classified as an uptrend; when below, as a downtrend.
Adaptive Bands and Clouds:
Around the dynamic trend baseline, three cloud “bands” are drawn using multiples of an ATR (Average True Range) volatility filter, automatically adjusting for evolving market conditions:
Middle Band (Fair Value Zone): Area around the baseline, where price is statistically balanced.
Upper Outer Band: In an uptrend, this shows a potential 'exhaustion/overextension' area; in a downtrend, it can act as a deep pullback or reversal area.
Lower Outer Band: In an uptrend, this highlights a possible 'deep pullback/reversal' area; in a downtrend, it becomes the potential exhaustion zone.
Contextual RSI Markers:
When price is in one of the outer bands and RSI is overbought (upper) or oversold (lower), a tiny diamond marker appears on that band as extra context — offering a visual cue for a possible high-momentum exhaustion or deep reversal zone, but never a trade signal or advice.
Visuals and Compliance:
All cloud regions use three different, semi-transparent colors for easy reading, and never block price action.
Labels indicate only “Possible Exhaustion,” “Deep Pullback Zone,” and “Balanced/Fair Value”—the language is strictly neutral and descriptive.
All calculations run only on confirmed, historical bars with zero repainting, no future bar lookahead, and no predictive overlays.
How to Use
Add to Chart:
Simply add the indicator to any chart and timeframe.
Configure:
Adjust the EMA, ATR, and RSI settings via the input panel to best fit your instrument and preferred sensitivity.
Choose band multipliers to widen or contract the cloud according to volatility or your system.
Toggle RSI marker/context highlighting as desired.
Interpretation:
Middle Cloud (“Balanced/Fair Value”): Price in this zone suggests mean reversion, equilibrium, or fair pricing for the session’s volatility/trend conditions.
Outer Clouds: If price reaches an outer cloud, pay attention for potential mean-reversion (if trend persists) or exhaustion zones (especially if a diamond appears).
Uptrend: Lower cloud is where larger pullbacks/reversals are often initiated; upper cloud indicates potential trend exhaustion.
Downtrend: Upper and lower clouds are reversed in interpretation.
Diamond Markers: A red diamond atop the upper band signifies RSI overbought; a lime diamond below the lower band shows RSI oversold. These do not recommend trading—only highlight increased likelihood that buyers/sellers may be overextended.
Best Practices:
Do not use the indicator in isolation or as a signal generator. Combine its context with price action confirmation, volume, or other non-repainting tools.
Use labels only for navigation/context, never as actionable advice.
Technical Details
Inputs/Customization: Fully adjustable (EMAs, ATR period, band multipliers, RSI thresholds, label/marker toggles).
Logic: All code processes only historical closed bars and overlays information in real time.
No repaint, strategy, or alerts: No signals, no script-driven trading, and no claims of prediction or guaranteed probability.
House-rule Clean: The script and its visuals are compliant with TradingView’s publishing requirements, both visually and textually.
Summary:
This tool is designed for traders who want to visually frame high-probability reversal, equilibrium, and exhaustion zones adaptively—while keeping price action primary and avoiding visual or conceptual clutter. Use it to better understand where price may statistically find resistance/support or revert, not to automate signals or guarantee outcomes


Smart Trend Signal with Bands [wjdtks255]Indicator Description for TradingView
Title: Adaptive Trend Kernel
Description:
The "Adaptive Trend Kernel " is a versatile trend-following and volatility indicator designed to help traders identify dynamic market trends, potential reversals, and price extremes within a channel. Built upon a customized linear regression model, this indicator provides clear visual cues to enhance your trading decisions.
Key Features:
Regression Line: A central dynamic line representing the core trend direction, calculated based on a user-defined "Regression Length."
Regression Bands: Standard deviation-based bands plotted around the Regression Line, which act like a dynamic channel. These bands expand and contract with market volatility, indicating potential overbought/oversold conditions relative to the trend.
Trend Reversal Signals: Distinct "Up" (green triangle up) and "Down" (red triangle down) signals are generated when the price (close) crosses over or under the Regression Line. These signals suggest potential shifts in the short-term trend direction.
Visual Customization: Highly flexible input options for adjusting line colors, band colors, line width, and panel opacity. Users can toggle the visibility of bands and trend labels to suit their chart preferences.
Panel Label: A subtle "Regression" label is dynamically positioned, offering clear context without cluttering the main chart.
How it Works: The indicator calculates a linear regression line as the adaptive center of the price movement. Standard deviation is then used to create upper and lower bands, encapsulating typical price fluctuations. Signals are fired when price breaks out of the regression line, suggesting a momentum shift in line with the established trend or a potential reversal.
Trading Methods & Strategies
Here are some trading strategies you can apply using the "Adaptive Trend Kernel " indicator:
Trend-Following with Confirmation:
Long Entry: Look for an "Up" signal (green triangle up) when the price is above the Regression Line, especially after a brief retracement towards the line. This confirms that the uptrend is likely resuming.
Short Entry: Look for a "Down" signal (red triangle down) when the price is below the Regression Line, especially after a brief rally towards the line. This confirms that the downtrend is likely resuming.
Exit Strategy: Consider exiting if an opposite signal appears, or if the price closes outside the opposite band, indicating potential overextension or reversal.
Reversal / Counter-Trend Play:
Long Entry (Aggressive): When the price approaches or briefly dips below the Lower Regression Band and then generates an "Up" signal (green triangle up). This could indicate a potential bounce from an oversold condition relative to the trend.
Short Entry (Aggressive): When the price approaches or briefly moves above the Upper Regression Band and then generates a "Down" signal (red triangle down). This could indicate a potential pullback from an overbought condition relative to the trend.
Confirmation: This strategy works best when combined with other reversal confirmation patterns (e.g., bullish/bearish engulfing candlesticks) or divergences in other momentum indicators (like RSI).
Volatility Breakout:
Entry (Long): After a period of low volatility where the Regression Bands are narrow, observe if the price decisively breaks above the Upper Regression Band and an "Up" signal appears. This suggests a strong bullish momentum breakout.
Entry (Short): After a period of low volatility where the Regression Bands are narrow, observe if the price decisively breaks below the Lower Regression Band and a "Down" signal appears. This suggests a strong bearish momentum breakdown.
Management: Volatility breakouts can be swift; use appropriate risk management and profit-taking strategies.
Important Considerations:
Risk Management: Always apply proper stop-loss and take-profit levels. No indicator is infallible.
Timeframe Sensitivity: Adjust the "Regression Length" and "Band Multiplier" according to the asset and timeframe you are trading. Shorter lengths might suit scalping, while longer lengths are better for swing trading.
Confirmation with Other Tools: For higher conviction trades, use this indicator in conjunction with other technical analysis tools such like volume, MACD, or RSI on an oscillator pane.
Backtesting: Always backtest any strategy on historical data to understand its performance characteristics before live trading.

Supply & Demand ZonesThis indicator detects high-probability supply and demand zones using a multi-step smart money concept approach:
Liquidity Sweep Detection: Identifies when price sweeps above a pivot high (supply setup) or below a pivot low (demand setup), capturing liquidity grabs by institutional traders.
Displacement Confirmation: Requires a strong displacement candle (measured by ATR and body percentage) or fair value gap (FVG/imbalance) in the opposite direction after the sweep.
Volume Confirmation: Optional filter ensures zones form only when volume exceeds the user-defined threshold, indicating institutional participation.
Smart Filtering: Built-in logic prevents overlapping zones, enforces minimum spacing between signals, and requires confirmation bars to eliminate false signals.
Zone Lifecycle Management: Zones are automatically removed when price closes through them with momentum. Breached zones can optionally "flip" to the opposite type when re-tested with strong displacement.
✨ Key Features
Clean Visual Display: Small "D" (Demand) and "S" (Supply) labels with shaded zone boxes
Non-Repainting: All signals use confirmed historical data—no lookahead or repainting
Volume Filter: Optional confirmation using volume spike detection
Zone Flip Logic: Breached demand zones can become supply (and vice versa) when violated
Overlap Prevention: Smart algorithm prevents clustered or duplicate zones
Confirmation Delay: Configurable wait period after sweep to confirm genuine setups
Customizable Inputs: Adjust pivot sensitivity, displacement thresholds, volume filters, and more
Alert Ready: Built-in alert conditions for new supply and demand zone formations
🎯 How to Add to Your Chart
Favorite the Indicator: Click the star icon to add this script to your favorites
Open Your Chart: Navigate to the asset and timeframe you want to trade (works best on 5m-1H intraday charts)
Add Indicator: Click "Indicators" at the top, search for "Supply & Demand Zones (Smart Filtered)", and add to chart
Customize Settings: Click the gear icon ⚙️ to adjust inputs based on your trading style and instrument volatility
Set Alerts: Right-click the indicator name → "Add alert" → Select "Supply Zone" or "Demand Zone" conditions
📖 How to Use
Demand Zones (Green "D" Labels):
Price swept below a swing low (liquidity grab)
Strong bullish displacement or imbalance followed
Trading Action: Look for LONG entries when price returns to the zone or on immediate continuation
Stop Loss: Place just below the zone or sweep low
Target: Next resistance level, supply zone, or risk-reward ratio target
Supply Zones (Red "S" Labels):
Price swept above a swing high (liquidity grab)
Strong bearish displacement or imbalance followed
Trading Action: Look for SHORT entries when price returns to the zone or on immediate continuation
Stop Loss: Place just above the zone or sweep high
Target: Next support level, demand zone, or risk-reward ratio target
Flipped Zones (Orange Labels):
Previous demand/supply zone was broken with strong momentum
Zone has flipped polarity and may now act as the opposite type
Trading Action: Exercise caution—wait for additional confirmation before trading flipped zones
🔍 What to Look For
High-Quality Setups:
Zone forms with above-average volume (check volume filter is enabled)
Clear liquidity sweep visible on the chart
Strong displacement candle with large body percentage
Zone aligns with overall market trend or key structure levels
Multiple timeframe confirmation (check higher timeframe for context)
Avoid These Setups:
Zones forming in choppy, low-volume conditions
Multiple overlapping zones in the same area (indicator filters these automatically)
Zones that appear immediately after news events (set confirmation bars higher)
Counter-trend zones without additional confluence
⚙️ Recommended Settings by Timeframe
5-Minute Charts (Scalping):
Pivot Lookback: 3/3
Min Displacement ATR: 0.9
Confirmation Bars: 1
Min Zone Spacing: 3-5 bars
Volume Threshold: 1.2x
15-Minute Charts (Intraday):
Pivot Lookback: 4/4 (default)
Min Displacement ATR: 1.0 (default)
Confirmation Bars: 2 (default)
Min Zone Spacing: 5-8 bars
Volume Threshold: 1.2x
1-Hour Charts (Swing Trading):
Pivot Lookback: 5/5
Min Displacement ATR: 1.2-1.5
Confirmation Bars: 3
Min Zone Spacing: 8-12 bars
Volume Threshold: 1.3x
💡 Trading Tips & Best Practices
Combine with Price Action: Use this indicator alongside candlestick patterns, support/resistance, and trendlines for confirmation
Multiple Timeframe Analysis: Check higher timeframes for overall bias and major zones
Volume is Key: Enable volume filter to focus on institutional-backed moves
Risk Management: Always use stop losses and proper position sizing
Backtesting: Test settings on your preferred instruments and timeframes before live trading
Context Matters: Consider market conditions, news events, and session times
Wait for Confirmation: Don't rush entries—wait for price reaction at the zone
⚠️ Important Disclaimers
Educational Purpose Only: This indicator is provided for educational and informational purposes. It does not constitute financial advice, investment recommendations, or trading signals.
No Guarantees: Past performance and backtested results do not guarantee future results. Trading involves substantial risk of loss.

J&C Indicator 20/40 MA4H SMA Signal Map (20/40) Strategy
Timeframe: 4-Hour
Overview:
This is a momentum-based trend confirmation system using dual moving averages. The strategy identifies potential entry points when price action aligns with moving average positioning.
LONG Signal:
Triggers when the market demonstrates bullish momentum with price confirming an upside breakout while both moving averages are in a favorable uptrend alignment.
SHORT Signal:
Triggers when the market demonstrates bearish momentum with price confirming a downside breakdown while both moving averages are in a favorable downtrend alignment.
Key Features:
Uses a 20-period and 40-period simple moving average on the 4-hour timeframe
Filters out false signals by requiring multi-factor confirmation
Generates clear visual alerts with background highlighting
Real-time dashboard showing current MA values and trend direction
Sound/notification alerts for immediate signal awareness
Best Used For:
Swing trading on higher timeframes with proper risk management and support from additional confluence factors on your trading setup.

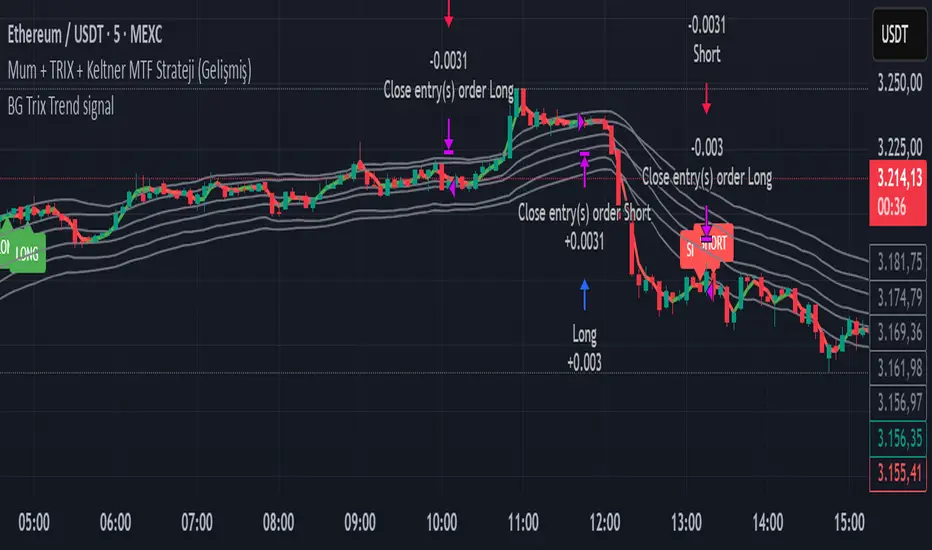
BG Trix Trend signalovides dynamic long and short signals based on a multi-timeframe candle averaging method. It calculates a four-step average of recent candles to determine the trend and changes candle color accordingly (green for upward, red for downward).
Features:
Multi-Timeframe Candle Analysis: Combines current and previous candle data to smooth price action.
Optional TRIX Filter: Adds a TRIX-based trend filter from a separate timeframe. Only triggers signals when TRIX confirms the trend.
Optional Keltner Channel Filter: Prevents signals when the price is inside the Keltner channel. Long signals only trigger above the upper band; short signals only trigger below the lower band. Separate MTF and MA type can be selected for the channel.
Visual Signals: Long and short signals are displayed as arrows on the chart. Candle color reflects trend direction.
Fully Customizable: Users can enable/disable TRIX and Keltner filters and select MA types and timeframes independently.
This indicator is ideal for traders who want clear trend signals while filtering out trades inside key price channels. No exit management is included—signals are purely for entry visualization.
Bollinger Bands Regression Forecast [BigBeluga]🔵 OVERVIEW
The Bollinger Bands Regression Forecast combines volatility envelopes from Bollinger Bands with a linear regression-based projection model .
It visualizes both current and future price zones by extrapolating the Bollinger channel forward in time, giving traders a statistical forecast of probable support and resistance behavior.
🔵 CONCEPTS
Classic Bollinger Bands use a moving average (basis) and standard deviation (deviation) to form dynamic envelopes around price.
This indicator enhances them with linear regression slope detection , allowing it to forecast how the band may expand or contract in the future.
Regression is applied to both the band’s basis and deviation components to predict their trajectory for a user-defined number of Forecast Bars .
The resulting forecast creates a smoothed, funnel-shaped projection that dynamically adapts to volatility.
▲ and ▼ markers highlight potential mean reversion points when price crosses the outer bounds of the bands.
🔵 FEATURES
Forecast Engine : Uses linear regression to project Bollinger Band movement into the future.
Dynamic Channel Width : Adapts standard deviation and slope for realistic volatility modeling.
Auto-Labeled Levels : Displays live upper and lower forecast values for quick reference.
Cross Signals : Marks potential overbought and oversold zones with ▲/▼ signals when price exits the band.
Trend-Adaptive Basis Color : Basis line automatically switches color to represent short-term trend direction.
Customizable Colors and Widths for complete visual control.
🔵 HOW TO USE
Apply the indicator to visualize both current Bollinger structure and its forward projection.
Use ▲/▼ breakout markers to identify short-term reversals or volatility shifts.
When price consistently rides the upper band forecast, the trend is strong and likely continuing.
When regression shows narrowing bands ahead, expect a volatility contraction or consolidation period.
For range traders, outer projected bands can be used as potential mean reversion entry points .
Combine with volume or momentum filters to confirm whether breakouts are genuine or fading.
🔵 CONCLUSION
Bollinger Bands Regression Forecast transforms classic Bollinger analysis into a predictive forecasting model .
By merging volatility dynamics with regression-based extrapolation, it provides traders with a forward-looking visualization of likely price boundaries — revealing not only where volatility is but also where it’s heading next.

Fibonacci Bands 33 — Pro (auto+fix EMA/ATR + HTF panel)Fibonacci Bands 33 — Pro (auto+fix EMA/ATR + HTF panel)

Jace's Raff ChannelJust a basic, no-frills, Raff Regression channel. You can adjust the regression length and provide a starting point offset.

2-Stage Dashboard (SQZPRO Wide + EMA)Dashboard for Darvas Box EMA momentum traders, located in the bottom right, mostly for quickly screening if a setup is viable.
- EMAs are 9 & 21
- SQZPRO set to wide squeezes
Long setup:
- Green SQZPRO row
- Green EMA row
Short setup:
- Green SQZPRO row
- Red EMA row

Hourly ORB Boxes v2 (5/15min/custom min)Draws ORB on 9.30am open and every hour from 11am to 3pm so you can enjoy multiple ORB entries throughout the day with a custom time
Choose 5 min or 10 min or 15 min for ORB.
All open source written from scratch with help of chatgpt lol

Risk Manager 2:1 (Momentum Trader Version)Manage your RISK - 2:1
Every penny counts
RC - WT , Inspired

CM_MACD_Ult_MTF + Entry SignalsThis script is an enhanced and updated version of the classic CM_Ult_MacD_MTF originally created by ChrisMoody.
It preserves the full functionality, look, and behavior of the original multi-timeframe MACD, including:
Multi-timeframe MACD calculation
4-color histogram based on momentum direction
Optional MACD and Signal line display
Optional crossover dots
Color-changing MACD line on signal cross
Zero-line reference
This upgraded version adds entry signals based on MACD/Signal crossovers:
New Features Added
LONG @ price label when MACD crosses above Signal
SHORT @ price label when MACD crosses below Signal
Labels appear directly at the crossover point
Full support for Pine Script® v6, making it compatible with TradingView’s latest publishing requirements
Why this version?
The original script was written in an older Pine version and was no longer publishable.
This version keeps the full visual identity and logic of the classic MACD while adding modern compatibility and helpful trading signals.
Credits
Original concept and visual framework: ChrisMoody
Added features, Pine v6 migration, and enhancements: tgambinox

Sentiment Heatmap with EMA Sentiment Heatmap with EMA Let’s build a script mini-LuxAlgo-style sentiment heatmap Enhanced Simple Sentiment Heatmap + Right-Side Legend Automatic legend on the right side
Just like professional indicators:
MAX GREED
GREED
NEUTRAL
FEAR
MAX FEAR
✔ Legend stays updated on the last bar
It moves automatically as price moves.
✔ Trend EMA included (optional) 9 EMA → White
20 EMA → Red
50 EMA → Yellow
100 EMA → Blue
200 EMA → Purple Alerts (e.g., “Max Fear – Buy Zone”)
✔ Liquidity line / support-resistance auto zones Full sentiment heatmap (Greed → Fear)
✔ Right-side legend like LuxAlgo
✔ All 5 EMAs added (my colors): EMA trend cloud (9/20, 20/50, 50/200)
Buy/Sell circles based on sentiment reversals Right-side legend: MAX GREED / GREED / NEUTRAL / FEAR / MAX FEAR
5 EMAs:
9 → White
20 → Red
50 → Yellow
100 → Blue
200 → Purple

Smoothed VWAP Bands🎯 Best Smoothing Setting for Scalping (What You Should Use)
Style σ Smoothing Result
Fast scalping (1min) EMA 14 Very responsive, still filters noise
Balanced intraday (1–5min) EMA 20 Best overall reliability
Slow confirmation (5–15min) EMA 30 Eliminates nearly all fakeouts
✅ What We Are Actually Smoothing
You are NOT smoothing VWAP itself.
You are smoothing the standard deviation (σ) that creates the VWAP bands:
✔ What this does:
* Computes the raw standard deviation (σ) of price relative to VWAP
* Smooths that σ using EMA smoothing
* Builds ±1 and ±2 bands using the smoothed σ
* You get clean, stable bands that filter fakeouts
✔ Result:
* Bands do NOT twitch in chop
* Fakeouts are filtered
* Real breakouts show obvious expansion

MACD Divergence Optimizer# MACD Divergence Optimizer - User Guide
## Overview
The **MACD Divergence Optimizer** is a professional-grade technical analysis indicator for TradingView that automatically detects hidden divergences on MACD with volume weighting. It identifies potential reversal points before price action confirms the move, giving traders an early edge.
---
## What is Divergence?
A **divergence** occurs when price and an oscillator (like MACD) move in opposite directions:
- **Bullish Divergence**: Price makes a lower low, but MACD makes a higher low → Potential uptrend reversal
- **Bearish Divergence**: Price makes a higher high, but MACD makes a lower high → Potential downtrend reversal
Divergences are among the most reliable reversal signals in technical analysis.
---
## Indicator Features
### Volume-Weighted MACD
- Standard MACD is calculated on closing price
- This indicator uses **volume-weighted closing prices** for greater accuracy
- Formula: MACD = (Volume-Weighted EMA₁₂ - Volume-Weighted EMA₂₆)
- Volume weighting gives more importance to high-conviction price moves
### Automatic Swing Detection
- Detects local highs and lows (5-bar lookback)
- Tracks the last 5 swings for divergence analysis
- Only meaningful swings are tracked (filtered for noise)
### Smart Signal Generation
- Green triangle (▲) = Bullish Divergence (BUY signal)
- Red triangle (▼) = Bearish Divergence (SELL signal)
- Triangles appear directly on the MACD line for precise entry timing
### Built-in Alerts
- Real-time notifications for divergence signals
- Alerts can trigger mobile push notifications or sound
- Never miss a trading opportunity
---
## How to Use
### Installation
1. Open TradingView and navigate to the Chart
2. Click "Indicator" → Search "MACD Divergence Optimizer"
3. Click "Add to Chart"
4. The indicator appears in a separate panel below the price chart
### Reading the Indicator
**MACD Panel displays:**
- **Blue Line** = MACD (fast momentum)
- **Orange Line** = Signal line (slow momentum)
- **Histogram** (colored bars) = Difference between MACD and Signal
- Green bars = MACD above signal (bullish)
- Red bars = MACD below signal (bearish)
**Divergence Signals:**
- **Green Triangle ▲** = Bullish divergence detected
- Price is lower, but MACD momentum is strengthening
- Look for uptrend reversal
- Confirm with higher closes or volume
- **Red Triangle ▼** = Bearish divergence detected
- Price is higher, but MACD momentum is weakening
- Look for downtrend reversal
- Confirm with lower closes or selling volume
---
## Parameters & Settings
### MACD Fast Length (Default: 12)
- Controls the faster moving average period
- **Lower values** → More responsive, more false signals
- **Higher values** → Smoother, fewer signals
- **Typical range**: 8-15
### MACD Slow Length (Default: 26)
- Controls the slower moving average period
- **Lower values** → Faster divergence detection
- **Higher values** → More reliable, fewer signals
- **Typical range**: 20-35
### Signal Smoothing (Default: 9)
- EMA period applied to MACD itself
- **Lower values** → Faster crossover signals
- **Higher values** → Fewer false crossovers
- **Typical range**: 5-15
### Min Divergence Strength (Default: 0.5%)
- Minimum % difference between current MACD and swing MACD
- **Lower values** → More divergence signals (noisier)
- **Higher values** → Only strong divergences (fewer signals)
- **Recommended**: 0.3% - 1.0%
### Lookback Bars (Default: 75)
- Historical window for analysis
- Larger lookback = more context but slower calculation
- **Typical range**: 50-100
---
## Trading Strategy
### Bullish Divergence (Entry Setup)
1. **Identify Signal**: Green triangle appears on MACD
2. **Confirm Price**: Look for price rejection of the low (bounce)
3. **Volume Check**: Buy on increase in volume at the bounce
4. **Entry**: Above the swing low level
5. **Stop Loss**: Below the most recent swing low
6. **Target**: Next swing high or resistance level
### Bearish Divergence (Entry Setup)
1. **Identify Signal**: Red triangle appears on MACD
2. **Confirm Price**: Look for price rejection of the high
3. **Volume Check**: Sell on increase in volume at rejection
4. **Entry**: Below the swing high level
5. **Stop Loss**: Above the most recent swing high
6. **Target**: Next swing low or support level
### Risk Management
- **Position Size**: Risk only 1-2% per trade
- **Stop Loss**: Place beyond recent swings
- **Take Profit**: Scale out at 1:1, 1:2, 1:3 risk-reward ratios
- **Filter**: Use on higher timeframes (4H, Daily) for reliability
---
## Timeframe Recommendations
| Timeframe | Best For | Signal Quality |
|-----------|----------|---|
| **1H** | Scalping, day trading | Moderate (some noise) |
| **4H** | Swing trading | Excellent |
| **Daily** | Position trading | Excellent |
| **Weekly** | Long-term trends | Excellent |
---
## Tips & Best Practices
### ✅ DO:
- **Use on trends**: Divergences work best when there's a clear trend
- **Combine signals**: Look for confirmation from price action, volume, or moving averages
- **Trade the bounce**: Wait for price to react to the swing, then enter
- **Adjust parameters**: Test different MACD lengths for your trading style
- **Use alerts**: Set up mobile alerts so you don't miss signals
### ❌ DON'T:
- **Trade every signal**: Some signals are stronger than others
- **Trade flat/choppy markets**: Divergences fail in ranging markets
- **Ignore support/resistance**: Trade divergences near key levels for best results
- **Over-leverage**: Divergences are probabilistic, not guaranteed
- **Disable volume analysis**: Always check volume when divergence fires
---
## Advanced Features
### Volume Weighting
The indicator uses **volume-weighted MACD** instead of standard MACD. This means:
- High-volume reversals get more emphasis
- Low-volume moves are smoothed out
- More accurate momentum readings
- Better at identifying true trend changes
### Array Tracking
The indicator tracks the last 5 swings in arrays:
- `swingLows ` = last 5 price lows
- `swingHighs ` = last 5 price highs
- `swingMacds ` = corresponding MACD values
This allows detection of **hidden divergences** not visible in traditional analysis.
---
## Common Questions
**Q: Why didn't the indicator trigger a signal when I see a divergence?**
A: The indicator may require:
- MACD histogram to cross the zero line (confirms momentum shift)
- Minimum strength threshold to be met (adjust Min Divergence Strength)
- At least 5 swings to be recorded in the lookback window
**Q: Can I use this on all timeframes?**
A: Yes, but divergences are more reliable on higher timeframes (4H+). Lower timeframes produce more signals but with more noise.
**Q: Should I trade every green/red triangle?**
A: No. Use them as a heads-up for potential reversals. Always confirm with:
- Price action (rejection of the swing)
- Volume (increasing volume at reversal)
- Key support/resistance levels
**Q: How do I set alerts?**
A:
1. Right-click the indicator → Edit Alerts
2. Check "Bullish Divergence" and/or "Bearish Divergence"
3. Choose notification type (browser, mobile, email)
4. Set frequency to "Once per bar close"
**Q: What's the difference between regular and hidden divergence?**
A: This indicator detects **hidden divergences** (also called continuation divergences):
- **Regular**: Price makes new extreme, but oscillator doesn't
- **Hidden**: Price makes new extreme, oscillator makes new extreme in different direction
- Hidden divergences are often more reliable for continuation plays
---
## Disclaimer
This indicator is provided for educational and informational purposes only. It is not financial advice. Past performance does not guarantee future results. Always use proper risk management and combine with other analysis methods. Trading and investing carry risk of loss. Do your own research before making trading decisions.
---
## Support & Updates
For issues, feature requests, or questions:
- Check the indicator settings and parameter values
- Test on historical data first before live trading
- Adjust parameters to match your trading style and timeframe
---
**Version**: 1.0
**Last Updated**: November 2025
**Compatible**: TradingView v6+

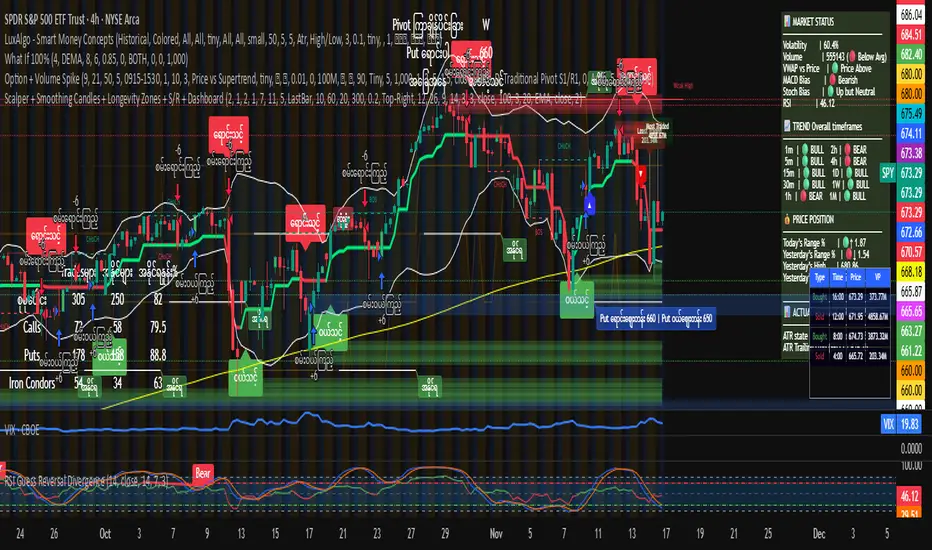
Myanverse Scalper BurmeseThis is Public Indicators from many resources and translated into burmese to use at ease.
I have another option sale indicators to use together.
Position Size CalculatorSet TP SL and entry point, over any chart to follow the points without drawing lines
