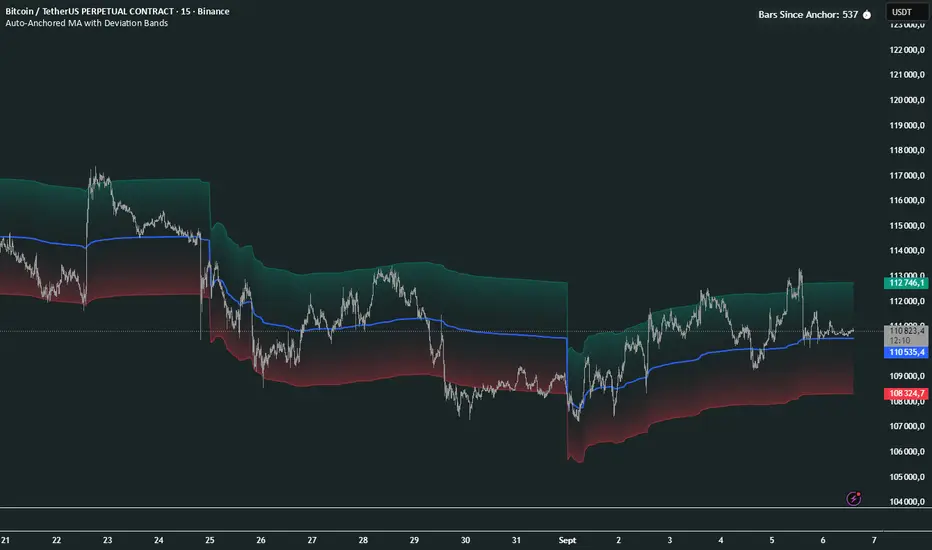
Auto-Anchored MA with Deviation BandsAuto-Anchored MA with Deviation Bands
✨ Features
📈 Auto-Anchored MA: Calculates moving averages (EMA, SMA, EWMA, WMA, VWAP, TEMA) anchored to user-defined periods (Hour, Day, Week, etc.).📏 Deviation Bands: Plots upper/lower bands using Percentage or Standard Deviation modes for volatility analysis.⚙️ Customizable Timeframes: Choose anchor periods from Hour to Year for flexible trend analysis.🎨 Visuals: Displays MA and bands with gradient fills, customizable colors, and adjustable display bars.⏱️ Countdown Table: Shows bars since the last anchor for easy tracking.🛠️ Smoothing: Applies smoothing to bands for cleaner visuals.
🛠️ How to Use
Add to Chart: Apply the indicator on TradingView.
Configure Inputs:
Anchor Settings: Select anchor period (e.g., Day, Week).
MA Settings: Choose MA type (e.g., VWAP, TEMA).
Deviation Settings: Set deviation mode (Percentage/Std Dev) and multipliers.
Display Settings: Adjust bars to display, colors, and gradient fill.
Analyze: View MA, deviation bands, and countdown table on the chart.
Track Trends: Use bands as dynamic support/resistance and monitor anchor resets.
🎯 Why Use It?
Dynamic Analysis: Auto-anchors MA to key timeframes for adaptive trend tracking.
Volatility Insight: Deviation bands highlight potential breakouts or reversals.
Customizable: Tailor MA type, timeframe, and visuals to your trading style.
User-Friendly: Clear visuals and countdown table simplify analysis.
📝 Notes
Ensure sufficient bars for accurate MA and deviation calculations.
Gradient fill enhances readability but can be disabled for simplicity.
Best used with complementary indicators like RSI or Bollinger Bands for robust strategies.
Happy trading! 🚀📈
带和通道
MoneyZone_SmartEleZone of action which helps identify smart money actioned. This bands help identify possible areas to expect action.
PCV (Darren.L-V2)Description:
This indicator combines Bollinger Bands, CCI, and RVI to help identify high-probability zones on M15 charts.
Features:
Bollinger Bands (BB) – displayed on the main chart in light gray. Helps visualize overbought and oversold price levels.
CCI ±100 levels + RVI – displayed in a separate sub-window:
CCI only shows the ±100 reference lines.
RVI displays a cyan main line and a red signal line.
Valid Zone Detection:
Candle closes outside the Bollinger Bands.
RVI crosses above +100 or below -100 (CCI level reference).
Candle closes back inside the BB, confirming a price rebound.
Requires two touches in the same direction to confirm the zone.
Only zones within 20–30 pips range are considered valid.
Usage:
Helps traders spot reversal or bounce zones with clear visual signals.
Suitable for all indices, Forex, and crypto on M15 timeframe.

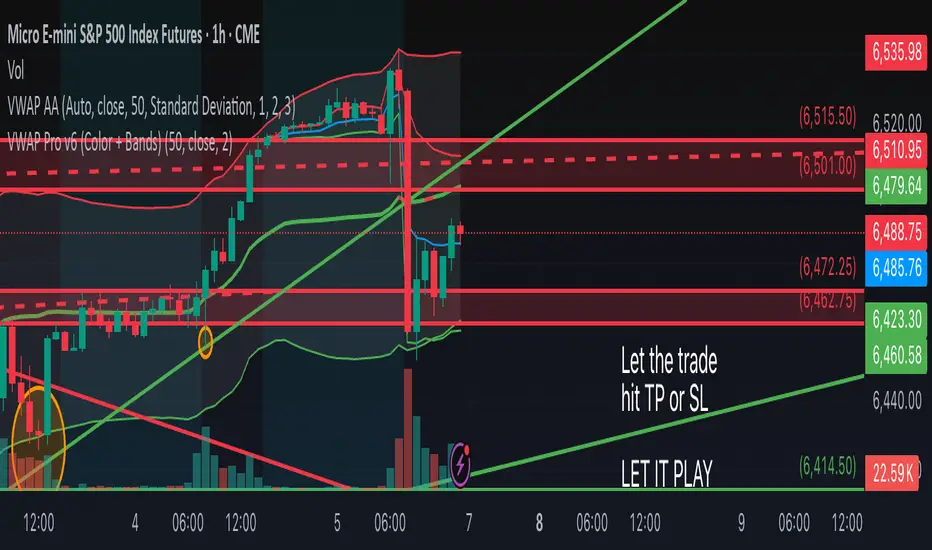
VWAP Pro v6 (Color + Bands)AI helped me code VWAP
When price goes above VWAP line, VWAP line will turn green to indicate buyers are in control.
When price goes below VWAP line, VWAP line will turn red to indicate sellers are in control.
VWAP line stays blue when price is considered fair value.

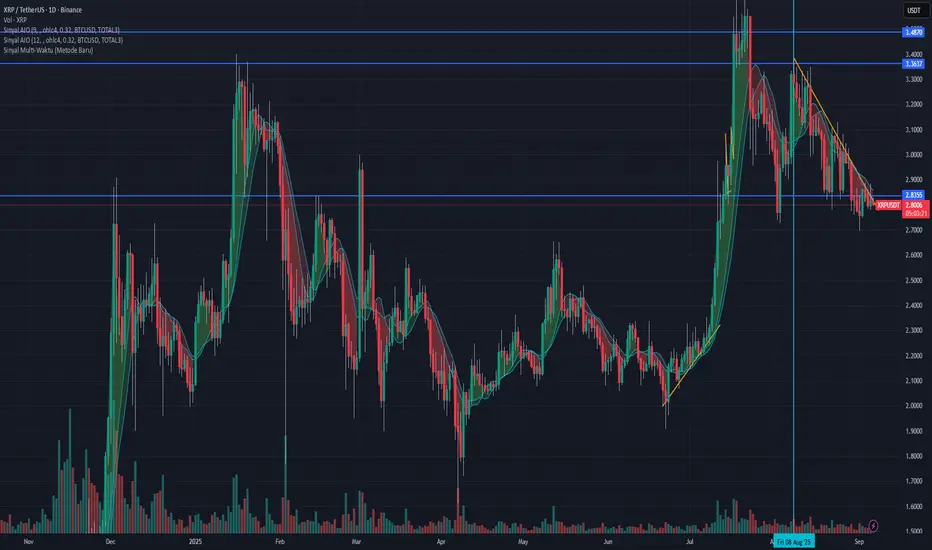
Sinyal Gabungan Lengkap (TWAP + Vol + Waktu)Sinyal Gabungan Lengkap (TWAP + Vol + Waktu) volume btc dan total3 dan ema

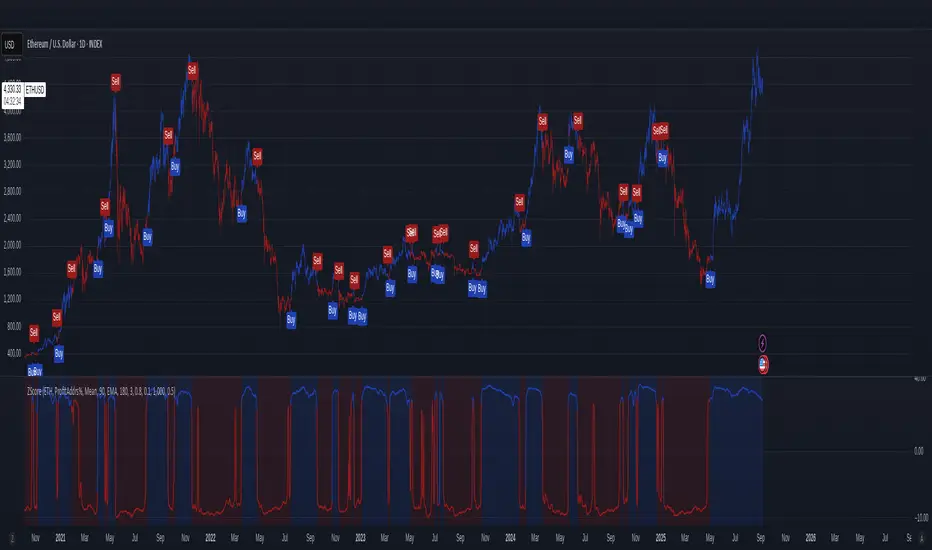
On-Chain Metrics & Z-Mode SelectionThis indicator provides an on-chain metric analysis framework for cryptocurrencies (currently limited to) BTC and ETH; allowing users to select from popular metrics such as SOPR, Profit Addresses %, NUPL, or MVRV.
It enables various analyses on the chosen metric to capture momentum and rate of change dynamics over time.
Analyses include:
Normalization techniques utilizing Mean or Median with standard deviation, as well as a 'Robust' method using interquartile range-based Z-scoring to accommodate skewed distributions, or raw values without normalization.
An optional differential calculation that highlights the rate of change (first derivative) of the metric.
Moving average smoothing with up to two passes, supporting EMA, SMA, or WMA types.
Optional sigmoid-based compression that scales and centers the indicator output, improving interpretability, mitigating extreme outliers, and allowing the user to scale the output so that the step size or increment of the long and short thresholds remains within a workable range.
Buy and sell signals are generated based on configurable long and short thresholds applied to the processed output.
Visual components such as trend colouring, threshold lines, background shading, and labels make it simple for traders to identify entry signals.
This indicator is suitable for those looking to integrate blockchain behavioral insights into their trading decisions.
Overall, this script transforms complex on-chain data into actionable trade signals by combining adaptive normalization and smoothing techniques. Its versatility and multi-metric support make it a valuable tool for both market monitoring and strategy development.
No financial decisions should be made based solely on this indicator. Always conduct your own research. .
Acknowledgements
Inspiration drawn from: CipherDecoded
rockstarluvit's a stochastics and trend indicator, where rockstars csan trade like winnners and stay away from crazy divergewnces.

Lot Size calculator@\dsfadlhubigjwqerfihlju;kbydewsdrghbliuyhofhuidgosdfjklbhnrdfsegxvz\dhjmnukilo,.
FVG & SMA @danciFVG zones with 200 SMA & daily dividers for intraday analysis, customizable and clear.

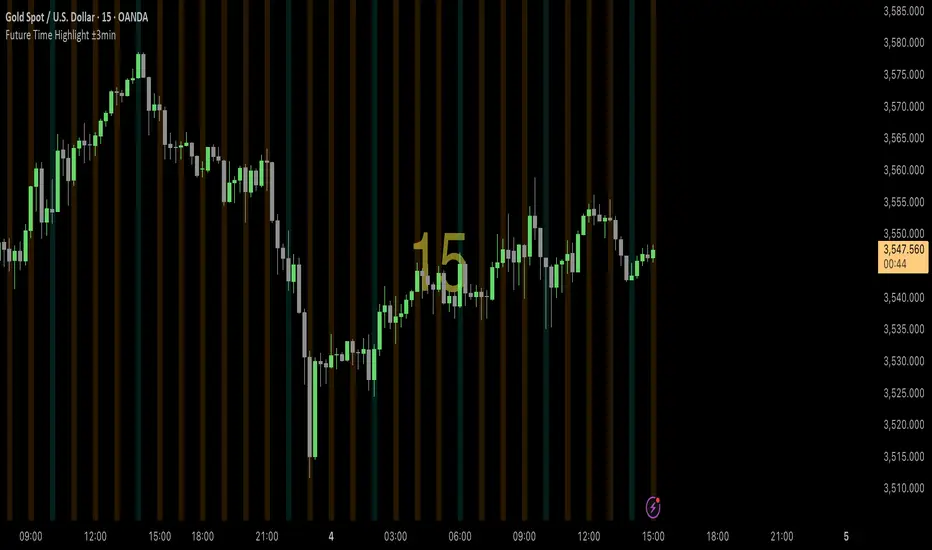
Time-Based Vertical LinesFeatures:
8 Customizable Lines: Each line can be individually enabled/disabled
Time Selection: Set specific times for each line (e.g., 9:30 AM)
Daily Repetition: Lines automatically repeat at the same time every trading day
Color Customization: Choose any color for each line
Additional Options: Width and style (solid, dashed, dotted) for each line
How to Use:
Copy the entire script
In TradingView, open the Pine Editor (at the bottom of the chart)
Create a new indicator and paste the code
Click "Add to Chart"
Configure your lines by clicking the settings gear icon:
Enable/disable each line
Set the time using the time picker
Choose colors
Adjust width and style as desired
Default Setup:
Line 1 is enabled by default at 9:30 AM (blue)
Lines 2-8 are disabled by default but can be enabled
Each line has a different default color for easy identification
The indicator will draw vertical lines that extend across the entire price range at your specified times, repeating every day. The lines use your chart's timezone settings, so they'll appear at the correct local time for your market.

COT-App//the COT-App generates potential trading signals for commodities and currencies futures based on the weekly COT data of the CFTC
//the COT data commercial netto, commercial short, non commercial short, non commercial long, a commercial netto oscillator, the ratio of commercial short tot he open interest and the open interest (types of COT data) can be shown as chart
//for each type of COT data you can define and set an extreme long and short level
//the COT types commercial netto, commercial short and commercial netto generate potential trading signals if the curve of type of COT data runs into the defined long or short extreme area
//a potential trading signal will be stronger if in additon further types of COT data runs in the same extreme area long or short
//

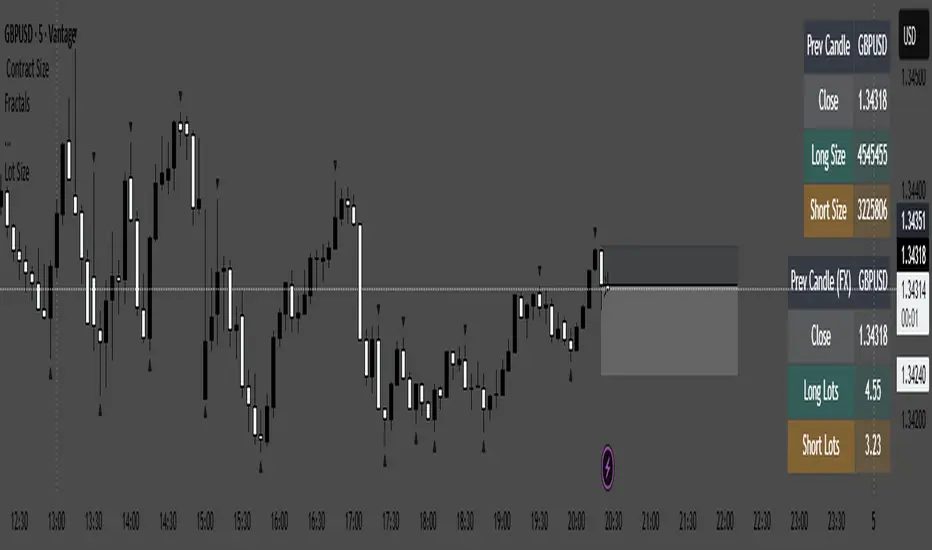
Kalkulator pozycji N100This indicator is a real-time position size calculator designed specifically for NASDAQ 100 futures (E-mini NQ and Micro NQ). It works on any timeframe, best on 1-minute charts, and calculates your position size based on candle body (ignoring wicks). This allows you to always see your exact risk and the number of contracts you can take before the candle closes.


Double Median ATR Bands | MisinkoMasterThe Double Median ATR Bands is a version of the SuperTrend that is designed to be smoother, more accurate while maintaining a good speed by combining the HMA smoothing technique and the median source.
How does it work?
Very simple!
1. Get user defined inputs:
=> Set them up however you want, for the result you want!
2. Calculate the Median of the source and the ATR
=> Very simple
3. Smooth the median with √length (for example if median length = 9, it would be smoothed over the length of 3 since 3x3 = 9)
4. Add ATR bands like so:
Upper = median + (atr*multiplier)
Lower = median - (atr*multiplier)
Trend Logic:
Source crossing over the upper band = uptrend
Source crossing below the lower band = downtrend
Enjoy G´s!

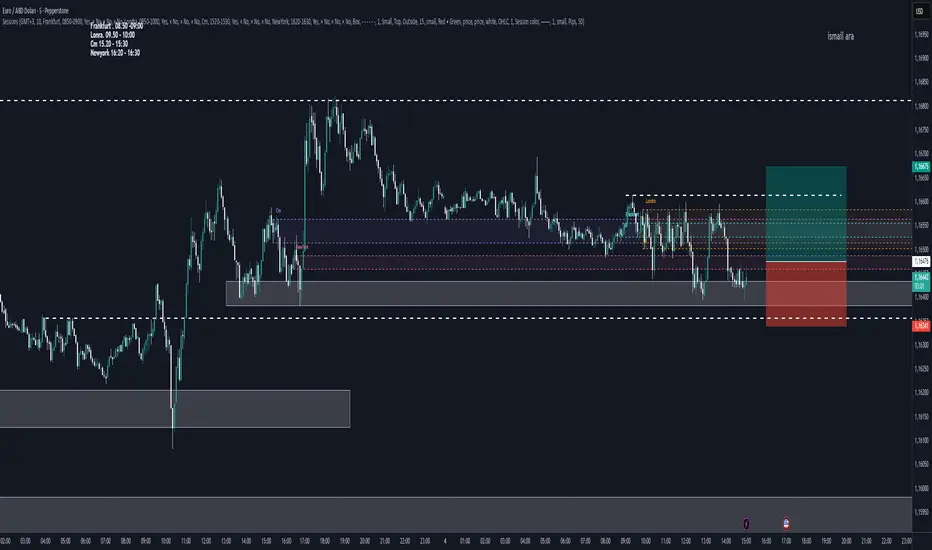
FX Market Sessions serkanMarket stock market opening and closing indicators
Opening and closing time ranges
Frankfurt
London
CM
New York opening and closing time ranges

RSI Crossover AlertRSI Crossover Alert Indicator - User Guide
The RSI Crossover Alert Indicator is a comprehensive technical analysis tool that detects multiple types of RSI crossovers and generates real-time alerts. It combines traditional RSI analysis with signal lines, divergence detection, and multi-level crossing alerts.
1. Multiple Crossover Detection
- RSI/Signal Line Cross: Signals a primary trend change.
- RSI/Second Signal Cross: Confirmation signals for stronger trends.
- Level Crossings: Crosses of Overbought 70, Oversold 30, and Midline 50.
- Divergence Detection: Hidden and regular divergences for reversal signals.
2. Alert Types
- Alert: RSI > Signal
Description: Bullish momentum is building.
Signal: Consider long positions.
- Alert: RSI < Signal
Description: Bearish momentum is building.
Signal: Consider short positions.
- Alert: RSI > 70
Description: Entering the overbought zone.
Signal: Prepare for a potential reversal.
- Alert: RSI < 30
Description: Entering the oversold zone.
Signal: Watch for a bounce opportunity.
- Alert: RSI crosses 50
Description: A shift in momentum.
Signal: Trend confirmation.
3. Visual Components
- Lines: RSI blue, Signal orange, Second Signal purple
- Histogram: Visualizes momentum by showing the difference between RSI and the Signal line.
- Background Zones: Red overbought, Green oversold
- Markers: Up/down triangles to indicate crossovers.
- Info Table: Real-time RSI values and status.
Strategy 1: Classic Crossover
- Entry Long: RSI crosses above the Signal Line AND RSI is below 50.
- Entry Short: RSI crosses below the Signal Line AND RSI is above 50.
- Take Profit: On the opposite signal.
- Stop Loss: At the recent swing high/low.
Strategy 2: Extreme Zone Reversal
- Entry Long: RSI is below 30 and crosses above the Signal Line.
- Entry Short: RSI is above 70 and crosses below the Signal Line.
- Risk Management: Higher win rate but fewer signals. Use a minimum 2:1 risk-reward ratio.
Strategy 3: Divergence Trading
- Setup: Enable divergence alerts and look for price/RSI divergence. Wait for an RSI crossover for confirmation.
- Entry: Enter on the crossover after the divergence appears. Place the stop loss beyond the starting point of the divergence.
Strategy 4: Multi-Timeframe Confirmation
1. Check the higher timeframe e.g. Daily to identify the main trend.
2. Use the current timeframe e.g. 4H/1H for your entry.
3. Only enter in the direction of the main trend.
4. Use the RSI crossover as the entry trigger.
Optimal Settings by Market
- Forex Major Pairs
RSI Length: 14, Signal Length: 9, Overbought/Oversold: 70/30
- Crypto High Volatility
RSI Length: 10-12, Signal Length: 6-8, Overbought/Oversold: 75/25
- Stocks Trending
RSI Length: 14-21, Signal Length: 9-12, Overbought/Oversold: 70/30
- Commodities
RSI Length: 14, Signal Length: 9, Overbought/Oversold: 80/20
Risk Management Rules
1. Position Sizing: Never risk more than 1-2% on a single trade. Reduce size in ranging markets.
2. Stop Loss Placement: Place stops beyond the recent swing high/low for crossovers. Using an ATR-based stop is also effective.
3. Profit Taking: Take partial profits at a 1:1 risk-reward ratio. Switch to a trailing stop after reaching 2:1.
1. Filtering Signals
- Combine with volume indicators.
- Confirm the trend on a higher timeframe.
- Wait for candlestick pattern confirmation.
2. Avoid Common Mistakes
- Don't trade every single crossover.
- Avoid taking signals against a strong trend.
- Do not ignore risk management.
3. Market Conditions
- Trending Market: Focus on midline 50 crosses.
- Ranging Market: Look for reversals from overbought/oversold levels.
- Volatile Market: Widen the overbought/oversold levels.
- If you get too many false signals:
Increase the signal line period, add other confirmation indicators, or use a higher timeframe.
- If you are missing major moves:
Decrease the RSI length, shorten the signal line period, or check your alert settings.
Recommended Combinations
1. RSI + MACD: For dual momentum confirmation.
2. RSI + Bollinger Bands: For volatility-adjusted signals.
3. RSI + Volume: To confirm the strength of a signal.
4. RSI + Moving Averages: To use as a trend filter.
This indicator provides a comprehensive RSI analysis. Success depends on proper configuration, risk management, and combining signals with the overall market context. Start with the default settings, then optimize based on your trading style and market conditions.

ORB with Fib Levels - TradingbrockOpening Range (OR) Indicator Overview
This TradingView indicator analyzes and displays the Opening Range - a popular day trading concept that tracks price movement during the first 30-60 minutes of the trading session.
Core Functionality:
Opening Range Detection: By default, it monitors the 9:30-10:00 AM ET period and tracks the highest high and lowest low during this time frame, creating upper and lower boundaries.
Fibonacci Retracement Levels: Inside the opening range, it displays five key Fibonacci levels:
0.236 (23.6% - shallow retracement)
0.382 (38.2% - standard retracement)
0.500 (50% - halfway point)
0.618 (61.8% - golden ratio)
0.786 (78.6% - deep retracement)
Extension Levels: The indicator projects additional levels beyond the opening range:
1x extension above/below the range
2x extension levels that only appear when price breaks the first extension
Trading Applications:
Support & Resistance: The opening range high/low often act as key levels throughout the trading day
Breakout Trading: Many traders watch for price to break above or below the opening range
Mean Reversion: The Fibonacci levels within the range can serve as potential reversal points
Risk Management: Helps define clear levels for stop losses and profit targets
The indicator essentially gives traders a framework to understand how price is behaving relative to the early session's established range, which often sets the tone for the entire trading day.

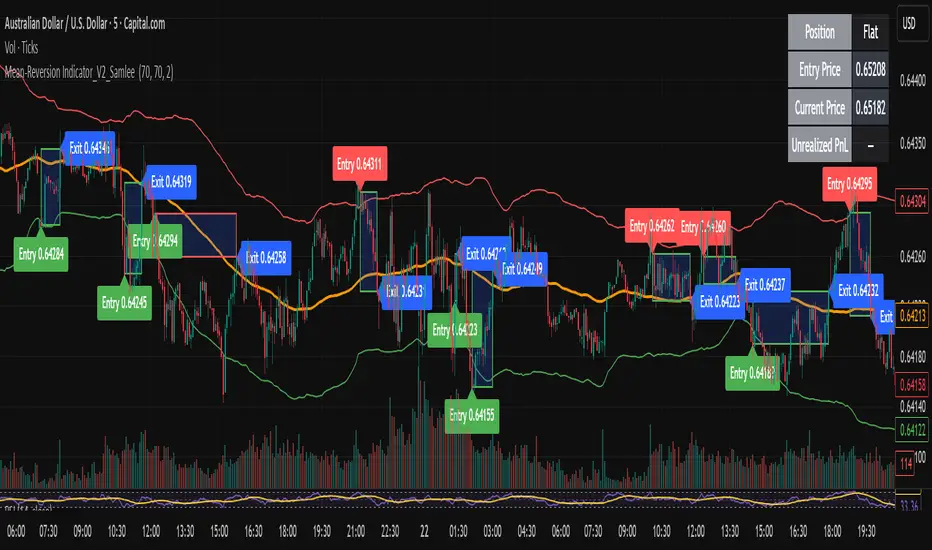
Mean-Reversion Indicator_V2_SamleeOverview
This is the second version of my mean reversion indicator. It combines a moving average with adaptive standard deviation bands to detect when the price deviates significantly from its mean. The script provides automatic entry/exit signals, real-time PnL tracking, and shaded trade zones to make mean reversion trading more intuitive.
Core Logic
Mean benchmark: Simple Moving Average (MA).
Volatility bands: Standard deviation of the spread (close − MA) defines upper and lower bands.
Trading rules:
Price breaks below the lower band → Enter Long
Price breaks above the upper band → Enter Short
Price reverts to MA → Exit position
What’s different vs. classic Bollinger/Keltner
Bandwidth is based on the standard deviation of the price–MA spread, not raw closing prices.
Entry signals use previous-bar confirmation to reduce intrabar noise.
Exit rule is a mean-touch condition, rather than fixed profit/loss targets.
Enhanced visualization:
A shaded box dynamically shows the distance between entry and current/exit price, making it easy to see profit/loss zones over the holding period.
Instant PnL labels display current position side (Long/Short/Flat) and live profit/loss in both pips and %.
Entry and exit points are clearly marked on the chart with labels and exact prices.
These visualization tools go beyond what most indicators provide, giving traders a clearer, more practical view of trade evolution.
Key Features
Automatic detection of position status (Long / Short / Flat).
Chart labels for entries (“Entry”) and exits (“Exit”).
Real-time floating PnL calculation in both pips and %.
Info panel (top-right) showing entry price, current price, position side, and PnL.
Dynamic shading between entry and current/exit price to visualize profit/loss zones.
Usage Notes & Risk
Mean reversion may underperform in strong trending markets; parameters (len_ma, len_std, mult) should be validated per instrument and timeframe.
Works best on relatively stable, mean-reverting pairs (e.g., AUDNZD).
Risk management is essential: use independent stop-loss rules (e.g., limit risk to 1–2% of equity per trade).
This script is provided for educational purposes only and is not financial advice.
4-Hour Range HighlighterThe 4-Hour Range Highlighter is a powerful visual analysis tool designed for traders operating on lower timeframes (like 5m, 15m, or 1H). It overlays the critical price range of the 4-hour (4H) candlestick onto your chart, providing immediate context from a higher timeframe. This helps you align your intraday trades with the dominant higher-timeframe structure, identifying key support and resistance zones, breakouts, and market volatility at a glance.
Key Features:
Visual Range Overlay: Draws a semi-transparent colored background spanning the entire High and Low of each 4-hour period.
Trend-Based Coloring: Automatically colors the range based on the 4H candle's direction:
Green: Bullish 4H candle (Close > Open)
Red: Bearish 4H candle (Close < Open)
Blue: Neutral 4H candle (Close = Open)
Customizable High/Low Lines: Optional, subtle lines plot the exact high and low of the 4H bar, acting as dynamic support/resistance levels.
Fully Customizable: Easily change colors and toggle visual elements on/off in the settings to match your chart's theme.
How to Use It:
Identify Key Levels: The top and bottom of the shaded area represent significant intraday support and resistance. Watch for price reactions at these levels.
Trade in Context: Use the trend color to gauge sentiment. For example, look for buy opportunities near the low of a bullish (green) 4H range.
Spot Breakouts: A strong candle closing above the high or below the low of the current 4H range can signal a continuation or the start of a new strong move.
Gauge Volatility: A large shaded area indicates a high-volatility 4H period. A small area suggests consolidation or low volatility.
Settings:
Visual Settings: Toggle the background and choose colors for Bullish, Bearish, and Neutral ranges.
Line Settings: Toggle the high/low lines and customize their colors.
Note: This is a visual aid, not a standalone trading system. It provides context but does not generate buy/sell signals. Always use it in conjunction with your own analysis and risk management.
Perfect for Day Traders, Swing Traders, and anyone who needs higher-timeframe context on their chart!
How to Use / Instructions:
After adding the script to your chart, open the settings menu (click on the indicator's name and then the gear icon).
In the "Inputs" tab, you will find two groups: "Visual Settings" and "Line Settings".
In Visual Settings, you can:
Toggle Show 4H Range Background on/off.
Change the Bullish Color, Bearish Color, and Neutral Color for the transparent background.
In Line Settings, you can:
Toggle Show High/Low Lines on/off.
Change the line colors for each trend type.
Adjust the colors to your preference. The default settings use transparency for a clean look that doesn't clutter the chart.
