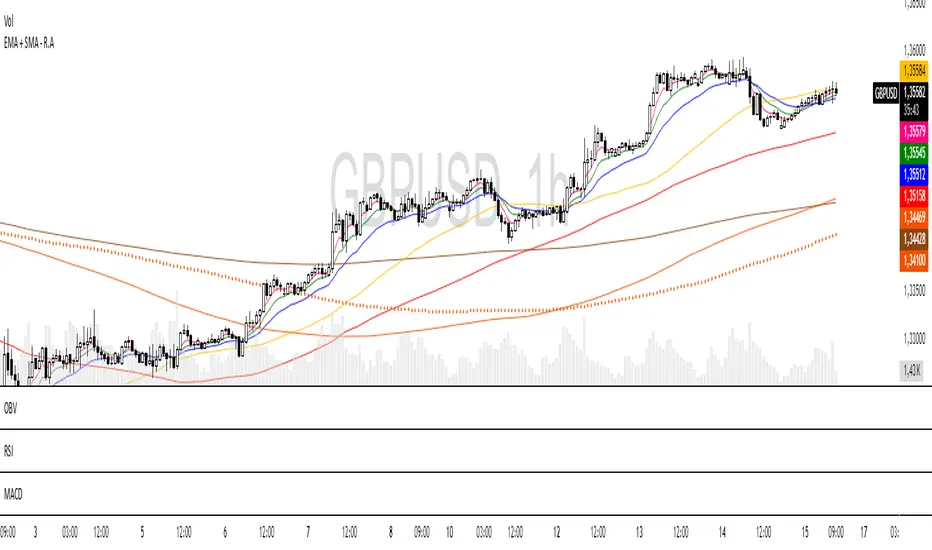
EMA + SMA - R.AR.A. Trader - Multi-MA Suite (EMA & SMA)
1. Overview
Welcome, students of R.A. Trader!
This indicator is a powerful and versatile tool designed specifically to support the trading methodologies taught by Rudá Alves. The R.A. Trader Multi-MA Suite combines two fully customizable groups of moving averages into a single, clean indicator.
Its purpose is to eliminate chart clutter and provide a clear, at-a-glance view of market trends, momentum, and dynamic levels of support and resistance across multiple timeframes. By integrating key short-term and long-term moving averages, this tool will help you apply the R.A. Trader analytical framework with greater efficiency and precision.
2. Core Features
Dual Moving Average Groups: Configure two independent sets of moving averages, perfect for separating short-term (EMA) and long-term (SMA) analysis.
Four MAs Per Group: Each group contains four fully customizable moving averages.
Multiple MA Types: Choose between several types of moving averages for each group (SMA, EMA, WMA, HMA, RMA).
Toggle Visibility: Easily show or hide each group with a single click in the settings panel.
Custom Styling: Key moving averages are styled for instant recognition, including thicker lines for longer periods and a special dotted line for the 250-period SMA.
Clean and Efficient: The code is lightweight and optimized to run smoothly on the TradingView platform.
Group 1 (Default: EMAs)
This group is pre-configured for shorter-term Exponential Moving Averages but is fully customizable.
Setting Label Description
MA Type - EMA Select the type of moving average for this entire group (e.g., EMA, SMA).
EMA 5 Sets the period for the first moving average.
EMA 10 Sets the period for the second moving average.
EMA 20 Sets the period for the third moving average.
EMA 400 Sets the period for the fourth moving average.
Show EMA Group A checkbox to show or hide all MAs in this group.
Exportar para as Planilhas
Group 2 (Default: SMAs)
This group is pre-configured for longer-term Simple Moving Averages, often used to identify major trends.
Setting Label Description
MA Type - SMA Select the type of moving average for this entire group.
SMA 50 Sets the period for the first moving average.
SMA 100 Sets the period for the second moving average.
SMA 200 Sets the period for the third moving average.
SMA 250 Sets the period for the fourth moving average (styled as a dotted line).
Show SMA Group A checkbox to show or hide all MAs in this group.
Exportar para as Planilhas
带和通道
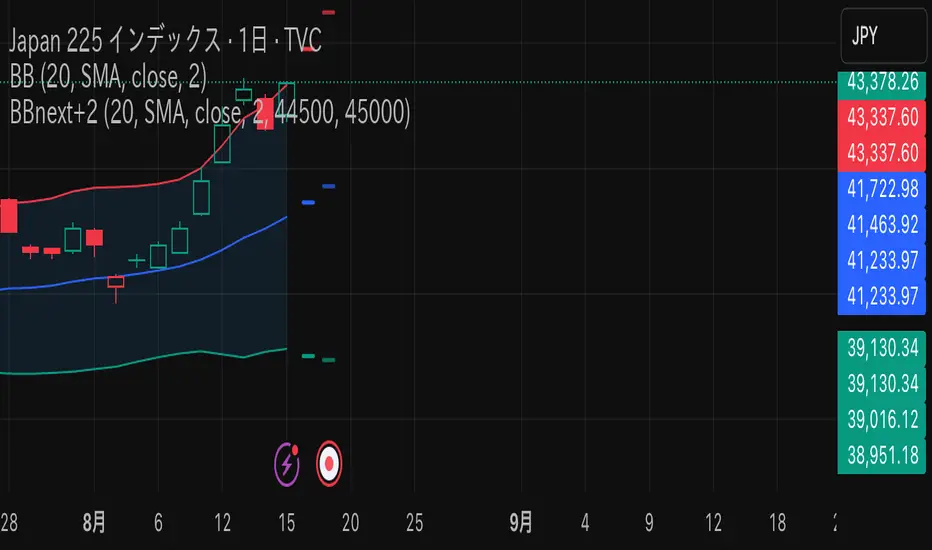
BB next+2This indicator extends the standard Bollinger Bands by allowing you to project future Bollinger Bands based on assumed closing prices for the next trading day (+1) and the day after (+2).
Key Features:
Plots standard Bollinger Bands (supports SMA, EMA, etc.)
Allows manual input of assumed closing prices for the next trading day (+1) and the day after (+2)
Displays projected Bollinger Bands (basis, upper, and lower) based on the input values
Option to restrict display to the latest bar or confirmed bars only
Support and resistance channelsSupport and resistance channels on the wick which represents support and resistance

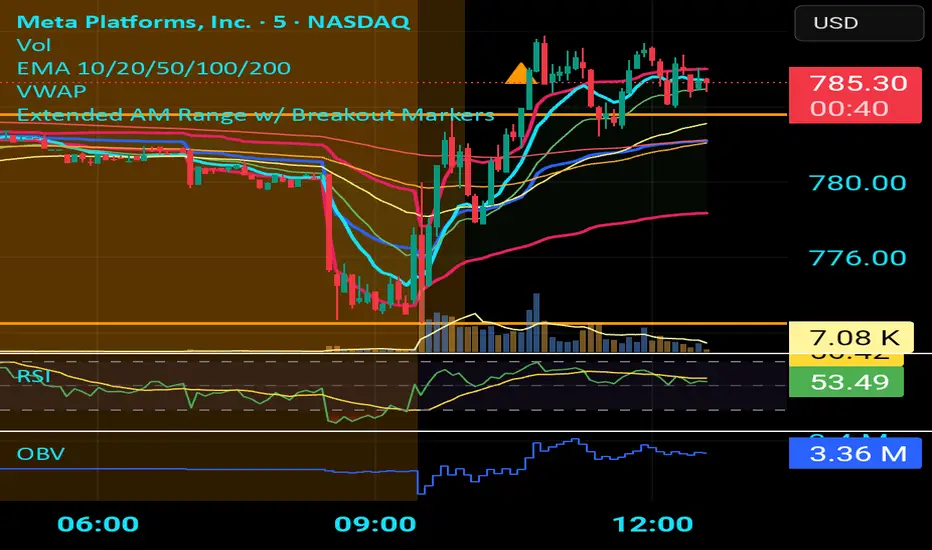
VWAP Session and NY CashAuto Anchored VWAPs with Label options
Session starts at 1800 EST
Cash Open or NY Session starts 0930 EST

Extended AM Range w/ Breakout Markerscreates a range from market starting till 10 am (half an hour into the market
Indicador Millo SMA20-SMA200-AO-RSI M1This indicator is designed for scalping in 1-minute timeframes on crypto pairs, combining trend direction, momentum, and oscillator confirmation.
Logic:
Trend Filter:
Only BUY signals when price is above the SMA200.
Only SELL signals when price is below the SMA200.
Entry Trigger:
BUY: Price crosses above the SMA20.
SELL: Price crosses below the SMA20.
Confirmation Window:
After the price cross, the Awesome Oscillator (AO) must cross the zero line in the same direction within a maximum of N bars (configurable, default = 4).
RSI must be > 50 for BUY and < 50 for SELL at the moment AO confirms.
Cooldown:
A cooldown period (configurable, default = 10 bars) prevents multiple signals of the same type in a short time, reducing noise in sideways markets.
Features:
Works on any crypto pair and can be used in other markets.
Adjustable confirmation window, RSI threshold, and cooldown.
Alerts ready for BUY and SELL conditions.
Can be converted into a strategy for backtesting with TP/SL.
Suggested Use:
Pair: BTC/USDT M1 or similar high-liquidity asset.
Combine with manual support/resistance or higher timeframe trend analysis.
Recommended to confirm entries visually and with additional confluence before trading live.

Trading Sessionsconst string TZ_TOOLTIP_TEXT = "The session's time zone, specified in either GMT notation (e.g., 'GMT-5') or as an IANA time zone database name (e.g., 'America/New_York')."

FlowScape PredictorFlowScape Predictor is a non-repainting, regime-aware entry qualifier that turns complex market context into two readiness scores (Long & Short, each 0/25/50/75/100) and clean, confirmed-bar signals. It blends three orthogonal pillars so you act only when trend energy, momentum, and location agree:
Regime (energy): ATR-normalized linear-regression slope of a smooth HMA → EMA baseline, gated by ADX to confirm when pressure is meaningful.
Momentum (push): RSI slope alignment so price has directional follow-through, not just drift.
Structure (location): proximity to pivot-confirmed swings, scaled by ATR, so “ready” appears near constructive pullbacks—not mid-trend chases.
A soft ATR cloud wraps the baseline for context. A yellow Predictive Baseline extends beyond the last bar to visualize near-term trajectory. It is visual-only: scores/alerts never use it.
What you see
Baseline line that turns green/red when regime is strong in that direction; gray when weak.
ATR cloud around the baseline (context for stretch and pullbacks).
Scores (Long & Short, 0–100 in steps of 25) and optional “L/S” icons on bar close.
Yellow Predictive Baseline that extends to the right for a few bars (visual trajectory of the smoothed baseline).
The scoring system (simple and transparent)
Each side (Long/Short) sums four binary checks, 25 points each:
Regime aligned: trendStrong is true and LR slope sign favors that side.
Momentum aligned: RSI side (>50 for Long, <50 for Short) and RSI slope confirms direction.
Baseline side: price is above (Long) / below (Short) the baseline.
Location constructive: distance from the last confirmed pivot is healthy (ATR-scaled; not overstretched).
Valid totals are 0, 25, 50, 75, 100.
Best-quality signal: 100/0 (your side/opposite) on bar close.
Good, still valid: 75/0, especially when the missing block is only “location” right as price re-engages the cloud/baseline.
Avoid: 75/25 or any opposition > 0 in a weak (gray) regime.
The Predictive (Kalman) line — what it is and isn’t
The yellow line is a visual forward extension of the smoothed baseline to help you see the current trajectory and time pullback resumptions. It does not predict price and is excluded from scores and alerts.
How it’s built (plain English):
We maintain a one-dimensional Kalman state x as a smoothed estimate of the baseline. Each bar we observe the current baseline z.
The filter adjusts its trust using the Kalman gain K = P / (P + R) and updates:
x := x + K*(z − x), then P := (1 − K)*P + Q.
Q (process noise): Higher Q → expects faster change → tracks turns quicker (less smoothing).
R (measurement noise): Higher R → trusts raw baseline less → smoother, steadier projection.
What you control:
Lead (how many bars forward to draw).
Kalman Q/R (visual smoothness vs. responsiveness).
Toggle the line on/off if you prefer a minimal chart.
Important: The predictive line extends the baseline, not price. It’s a visual timing aid—don’t automate off it.
How to use (step-by-step)
Keep the chart clean and use a standard OHLC/candlestick chart.
Read the regime: Prefer trades with green/red baseline (trendStrong = true).
Check scores on bar close:
Take Long 100 / Short 0 or Long 75 / Short 0 when the chart shows a tidy pullback re-engaging the cloud/baseline.
Mirror the logic for shorts.
Confirm location: If price is > ~1.5 ATR from its reference pivot, let it come back—avoid chasing.
Set alerts: Add an alert on Long Ready or Short Ready; these fire on closed bars only.
Risk management: Use ATR-buffered stops beyond the recent pivot; target fixed-R multiples (e.g., 1.5–3.0R). Manage the trade with the baseline/cloud if you trail.
Best-practice playbook (quick rules)
Green light: 100/0 (best) or 75/0 (good) on bar close in a colored (non-gray) regime.
Location first: Prefer entries near the baseline/cloud right after a pullback, not far above/below it.
Avoid mixed signals: Skip 75/25 and anything with opposition while the baseline is gray.
Use the yellow line with discretion: It helps you see rhythm; it’s not a signal source.
Timeframes & tuning (practical defaults)
Intraday indices/FX (5m–15m): Demand 100/0 in chop; allow 75/0 when ADX is awake and pullback is clean.
Crypto intraday (15m–1h): Prefer 100/0; 75/0 on the first pullback after a regime turn.
Swing (1h–4h/D1): 75/0 is often sufficient; 100/0 is excellent (fewer but cleaner signals).
If choppy: raise ADX threshold, raise the readiness bar (insist on 100/0), or lengthen the RSI slope window.
What makes FlowScape different
Energy-first regime filter: ATR-normalized LR slope + ADX gate yields a consistent read of trend quality across symbols and timeframes.
Location-aware entries: ATR-scaled pivot proximity discourages mid-air chases, encouraging pullback timing.
Separation of concerns: The predictive line is visual-only, while scores/alerts are confirmed on close for non-repainting behavior.
One simple score per side: A single 0–100 readiness figure is easier to tune than juggling multiple indicators.
Transparency & limitations
Scores are coarse by design (25-point blocks). They’re a gatekeeper, not a promise of outcomes.
Pivots confirm after right-side bars, so structure signals appear after swings form (non-repainting by design).
Avoid using non-standard chart types (Heikin Ashi, Renko, Range, etc.) for signals; use a clean, standard chart.
No lookahead, no higher-timeframe requests; alerts fire on closed bars only.

WaveTrend Dynamic (Lazy Bear Style)█ OVERVIEW
The WaveTrend Dynamic indicator (in the style of Lazy Bear) is an advanced tool based on the Exponential Smoothing Average (ESA), which adapts to the volatility and price of a financial instrument. It is more flexible than the classic WaveTrend but shares a similar concept of bands around a main oscillator line.
The indicator uses dynamic bands calculated as distances from the ESA, with their width adjustable via the "level" parameter. This allows it to be tailored to various markets, timeframes, and volatility conditions, making it easier to identify trends, reversal points, and buy/sell signals.
█ CONCEPTS
The WaveTrend Dynamic combines oscillator functions with trend analysis. Below, we explain the key components in a simple way, understandable even for beginner users.
Core Calculations
The indicator relies on the adaptive ESA and a few straightforward steps:
1 — ESA (Adaptive Average): Calculated as a smoothed average of the price (from high, low, and close, or HLC3) using the ESA Length parameter (default: 10). This number determines how many past candles are considered in the calculation. The ESA quickly responds to price changes, helping to track trends.
2 — Deviation (D): Measures how much the price deviates from the ESA, factoring in market volatility. This allows the indicator to adapt to different instruments.
3 — Price Distance Indicator (CI): Shows how far the price is from the ESA relative to market volatility. This forms the basis for the main indicator line, reacting to price movements.
4 — WT1 (WaveTrend 1): The main line, smoothing the Price Distance Indicator (CI) with the Average Length parameter (default: 21). It reflects the direction of price movement and momentum.
5 — WT2 (WaveTrend 2): A signal line that further smooths WT1 (with a period of 4). It helps confirm signals through crossovers with WT1.
6 — Bands (UpperBand and LowerBand): These form a dynamic channel around the ESA. Their width depends on the level parameter (default: 100). Wider bands result in fewer but more reliable signals. In the original WaveTrend, the oscillator bands use lower values, such as 50 or 60. To achieve classic oscillator signals (more frequent WT1/WT2 crossovers outside the bands), set the level to 50–60.
Trend Identification
The indicator identifies two types of trends:
• Major Trend: Determined by the position of WT1 relative to the ESA. When WT1 is above the ESA, it indicates a bullish trend. When below, it signals a bearish trend. Line and fill colors reflect this trend.
• Mini-Trend: Based on WT1 and WT2 crossovers. When the lines cross, they change to the same color, signaling short-term changes or reversal points. This is ideal for quick trading decisions.
Visuals and Effects
• WT1 and WT2 Lines: Scaled to price and displayed on the price chart for easier analysis.
• Fills: Between the bands (UpperBand/LowerBand) and between WT1/WT2, with a "wave" effect that adjusts transparency based on the trend (green for bullish, red for bearish).
• Signals: Three types—return-to-band, WT1/WT2 crossovers outside the bands, and crossovers inside the bands. Signals are displayed as triangles with different colors for buy and sell.
█ FEATURES
Detailed features of the indicator, aligned with the order of settings in the script:
• Basic Parameters: ESA Length — controls ESA smoothing; Average Length — affects WT1 responsiveness; level (WT Level) — adjusts band width for signal filtering.
• Display Elements: Options to show/hide ESA, bands, WT1/WT2; customizable colors for lines, fills, and the wave effect.
• Signals: Three signal groups (return-to-band, crossovers outside bands, crossovers inside bands) with display and color customization options.
█ HOW TO USE
1 — Add the indicator to your TradingView chart and adjust parameters: — Increase ESA Length and Average Length for low-volatility markets (e.g., stocks), or decrease for cryptocurrencies or forex. — Set level to 50–60 for classic WaveTrend signals with WT1/WT2 crossovers outside bands. The default value of 100 creates wider bands and fewer signals.
2 — Analyze trends: — Major trend (WT1 vs. ESA) shows the overall market direction. — Mini-trends (WT1/WT2 crossovers) help time short-term entries.
3 — Use signals: — Return-to-band: Buy at the lower band, sell at the upper band (mean-reversion). — Crossovers outside bands: Indicate strong momentum (with a lower level, e.g., 50). — Crossovers inside bands: Signal weaker trend changes.
4 — Combine with other tools: Use with volume, RSI, or support/resistance for better decisions. Test on historical data to optimize settings.

ABS NR — Fail-Safe Confirm (v4.2.2)
# ABS NR — Fail-Safe Confirm (v4.2.2)
## What it is (quick take)
**ABS NR FS** is a **non-repainting “arm → confirm” entry framework** for intraday and swing execution. It blends:
* **Regime** (EMA stack + 60-min slope),
* **Location** (Keltner basis/edges),
* **Stretch** (session-anchored **VWAP Z-score**),
* **Momentum gating** (TSI cross/slope),
* **Guards** (session window, minimum ATR%, gap filter, optional market alignment).
You’ll see a **small dot** when a setup is **armed** (candidate) and a **triangle** when that setup **confirms** within a user-defined number of bars. A **gray “X”** marks a timeout (candidate canceled).
> Tip: This entry tool works best when paired with a trend context filter and a dedicated exit tool.
---
## How to use it (operational workflow)
1. **Read the regime**
* **Bull trend**: fast > slow > long EMA **and** 60-min slope up.
* **Bear trend**: fast < slow < long EMA **and** 60-min slope down.
* **Range**: neither bull nor bear.
2. **Wait for a candidate (dot)**
Two families:
* **Reclaim (trend-following):** price crosses the **KC basis** with acceptable |Z| (not overstretched) and passes the TSI gate.
* **Fade (range-revert):** price **pokes a KC band**, prints a **reversal wick**, |Z| is stretched, and TSI gate agrees.
3. **Trade the confirmation (triangle)**
The confirm must occur **within N bars** and follow your chosen **Confirm mode** logic (see Inputs). If confirmation doesn’t arrive in time, an **X** cancels the candidate.
4. **Use guards to avoid junk**
Session windows (US focus), minimum ATR%, gap guard, and optional **market alignment** (e.g., SPY above EMA20 for longs).
5. **Manage the position**
* Entries: take **triangles** in the direction of your playbook (reclaims with trend; fades in clean ranges).
* Filters and exits: use your own process or pair with a trend/exit companion.
---
## Visual semantics & alerts
* **Candidate L / S (dot)** → a setup armed on this bar.
* **CONFIRM L / S (triangle)** → actionable signal that met confirm rules within your time window.
* **Cancel L / S (X)** → candidate expired without confirmation; ignore the dot.
**Alerts (stable names for automation):**
* **ABS FS — Confirmed** → fires on confirmed long or short.
* **ABS FS — Candidate Armed** → fires as a candidate arms.
---
## Non-repainting behavior (why signals don’t repaint)
* All HTF requests use **lookahead\_off**.
* With **Strict NR = true**, the 60-min slope uses the **prior completed** 60-min bar and arming/confirming only occurs on confirmed bars.
* Confirmation triangles finalize on bar close.
* If you disable strictness, signals may appear slightly earlier but with more intrabar sensitivity.
---
## Inputs reference (what each control does and the trade-offs)
### A) Behavior / Modes
**Mode** (`Turbo / Aggressive / Balanced / Conservative`)
Changes multiple internal thresholds:
* **Turbo** → most signals; relaxes prior-bar break & VWAP-side checks and time/vol/gap guards. Highest frequency, highest noise.
* **Aggressive** → more signals than Balanced, fewer than Turbo.
* **Balanced** → default; steady trade-off of frequency vs. quality.
* **Conservative** → tightens |Z| and other checks; fewest but cleanest signals.
**Strict NR (bar close + prior HTF 60m)**
* **true** = safer: uses prior 60-min slope; arms/confirms on confirmed bars → **fewer/cleaner** signals.
* **false** = earlier and more reactive; slightly noisier.
---
### B) Keltner Channel (location engine)
* **KC EMA Length (`kcLen`)**
Higher → smoother basis (fewer basis crosses). Lower → snappier basis (more crosses).
* **ATR Length (`atrLen`)**
Higher → steadier band width; Lower → more reactive band width.
* **KC ATR Mult (`kcMult`)**
Higher → wider bands (fewer edge pokes → fewer fades). Lower → narrower (more fades).
---
### C) Trend & HTF slope
* **Trend EMA Fast/Slow/Long (`emaFastLen / emaSlowLen / emaLongLen`)**
Larger = slower regime flips (fewer reclaims); smaller = faster flips (more reclaims).
* **HTF EMA Len (60m) (`htfLen`)**
Larger = steadier HTF slope (fewer signals); smaller = more sensitive (more signals).
---
### D) VWAP Z-Score (stretch / mean-revert logic)
* **VWAP Z-Length (`zLen`)**
Window for Z over session-anchored VWAP distance. Larger = smoother |Z| (fewer fades/re-entries). Smaller = more reactive (more).
* **Range Fade |Z| (base) (`zFadeBase`)**
Minimum |Z| to allow **fades** in ranges. Raise to demand more stretch (fewer fades). Lower to take more fades.
* **Max |Z| Trend Re-entry (base) (`maxZTrendBase`)**
Caps how stretched price can be and still permit **reclaims** with trend. Lower = stricter (avoid chases). Higher = will chase further.
---
### E) TSI Momentum Gate
* **TSI Long/Short/Signal (`tsiLong / tsiShort / tsiSig`)**
Larger = smoother/laggier momentum; smaller = snappier.
* **TSI gate (`CrossOnly / CrossOrSlope / Off`)**
* **CrossOnly**: require TSI cross of its signal (strict).
* **CrossOrSlope**: cross *or* favorable slope (balanced default).
* **Off**: no momentum gate (most signals, most noise).
---
### F) Guards (filters to avoid low-quality tape)
* **US focus 09:35–10:30 & 14:00–15:45 (base) (`useTimeBase`)**
`true` limits to high-quality windows. `false` trades all session.
* **Skip N bars after 09:30 ET (`skipFirst`)**
Skips the open scramble. Larger = skip longer.
* **Min volatility ATR% (base)** = `useVolMinBase` + `atrPctMinBase`
Requires `ATR(10)/Close*100 ≥ atrPctMinBase`. Raise threshold to avoid dead tape; lower to accept quieter sessions.
* **Gap guard (base)** = `gapGuardBase` + `gapMul`
Blocks signals when the opening gap exceeds `gapMul * ATR`. Increase `gapMul` to allow more gapped opens; decrease to be stricter.
---
### G) Visuals & Sides
* **Plot Keltner (`plotKC`)** → show/hide basis & bands.
* **Show Longs / Show Shorts** → enable/disable each side.
---
### H) Fail-Safe Confirmation
* **Confirm mode (`BreakHighOnly / BreakHigh+Hold / TwoBarImpulse`)**
* **BreakHighOnly**: confirm by taking out the armed bar’s extreme. Fastest, most frequent.
* **BreakHigh+Hold**: must **break**, have **body ≥ X·ATR**, **and** hold above/below the basis → higher quality, fewer signals.
* **TwoBarImpulse**: decisive follow-through vs. prior bar with **body ≥ X·ATR** → momentum-biased confirmations.
* **Confirm within N bars (`confirmBars`)**
Confirmation window size. Smaller = faster validation; larger = more patience (can be later).
* **Impulse body ≥ X·ATR (`impulseBodyATR`)**
Raise for stronger confirmations (fewer weak triangles). Lower to accept lighter pushes.
* **Require market alignment (`needMarket`) + `marketTicker`**
When enabled: Longs require **market > EMA20 (5m)**; Shorts require **market < EMA20 (5m)**.
* **Diagnostics: Show debug letters (`debug`)**
Tiny “B/C” audit marks for base/confirm while tuning.
---
## Tuning recipes (quick, practical)
* **If you’re getting chopped:**
* Set **Mode = Conservative**
* **Confirm mode = BreakHigh+Hold**
* Raise **impulseBodyATR** (e.g., 0.45)
* Keep **needMarket = true**
* Keep **Strict NR = true**
* **If you need more signals:**
* **Mode = Aggressive** (or Turbo if you accept more noise)
* **Confirm mode = BreakHighOnly**
* Lower **impulseBodyATR** (0.25–0.30)
* Increase **confirmBars** to 3
* **Range-day focus (fades):**
* Keep session guard on
* Raise **zFadeBase** to demand real stretch
* Keep **maxZTrendBase** moderate (don’t chase)
* **Trend-day focus (reclaims):**
* Slightly **lower `maxZTrendBase`** (avoid chasing excessive stretch)
* Use **CrossOrSlope** TSI gating
* Consider turning **needMarket** on
---
## Best practices & notes
* **Instrument specificity:** Tune Z, TSI, and guards per symbol and timeframe.
* **Session awareness:** Session filter uses **exchange-local** time; adjust for non-US markets.
* **Automation:** Use the two provided alert names; they’re stable.
* **Risk management:** Confirmation improves quality but doesn’t remove risk. Always pre-define stop/size logic.
---
## Suggested starting point (balanced profile)
* **Mode = balanced**
* **Strict NR = true**
* **Confirm mode = BreakHigh+Hold**
* **confirmBars = 2**
* **impulseBodyATR ≈ 0.35**
* **needMarket = off** (turn on for extra confluence)
* Leave Keltner/TSI defaults; then nudge `zFadeBase` and `maxZTrendBase` to match your symbol.
---
*This tool is a signal generator, not a broker or strategy. Validate on your markets/timeframes and integrate with your risk plan.*

All-Time High/Low Levels with Dynamic Price Zones📈 All-Time High/Low Levels with Dynamic Price Zones — AlertBlake
🧠 Overview:
This powerful indicator automatically identifies and draws the All-Time High (AT.H) and All-Time Low (AT.L) on your chart, providing a clear visual framework for price action analysis. It also calculates and displays the Midpoint (50%), Upper Quartile (75%), and Lower Quartile (25%) levels, creating a dynamic grid that helps traders pinpoint key psychological levels, support/resistance zones, and potential breakout or reversal areas.
✨ Features:
Auto-Detection of All-Time High and Low:
Tracks the highest and lowest prices in the full visible historical range of the chart.
Automatically updates as new highs or lows are created.
Dynamic Level Calculation:
Midpoint (50%): Halfway between AT.H and AT.L.
25% Level: 25% between AT.L and AT.H.
75% Level: 75% between AT.L and AT.H.
Each level is clearly labeled with its corresponding value.
Labels are positioned to the right of the price for easy reading.
Color-Coded Lines (customizable)
