[_ParkF]KDJThis indicator is based on price fluctuations.
It is a trend indicator that uses changes in K, D, and J values as a calculation formula.
Like my previous indicators, Divergence was included.
The movements of the K, D, and J lines are also shown through the histogram.
The Period value and color of each line can be modified.
The color of the histogram can also be modified.
I hope you will use this indicator differently from the usual one with overbuying and overselling sections.
We do not recommend entering the position when J Line enters the red area,
which is the over-buying section of this indicator, and the green area, which is the over-selling section.
Based on J Line's entry into overbuying and overselling areas,
it is recommended to watch future trends, check overlapping with divergence signals or RSI+ indicators
and determine with support and resistance in parallel channels or trend lines to increase reliability of position entry.
I hope it will help you with your trading.
hope you become rich!
-------------------------------------------------------------------------------------------------------------------------------------------------
이 지표는 가격 변동을 중심으로 한 지표입니다.
K, D, J 값의 변화를 계산식으로 사용하는 트렌드계 지표입니다.
기존의 제 지표와 마찬가지로 Divergence가 포함되었고
K, D, J 선의 움직임은 히스토그램을 통해서도 나타나게 됩니다.
각 선의 Period 값, 색상을 수정 가능하며
히스토그램의 색상 또한 수정이 가능 합니다.
이 지표는 과매수, 과매도 구간이 있는 일반적인 지표의 사용법과는 다르게 사용하셨으면 좋겠습니다.
과매수 구간인 빨간색 지역과 과매도 구간인 초록색 지역으로 J Line이 진입했을 때 포지션 진입을 하는 것은 추천 드리지 않습니다.
J Line이 과매수, 과매도 지역으로 진입했을 때를 기준으로 향후 추세를 지켜보고
다이버전스 신호 또는 제 지표인 RSI+ 지표와의 중복 확인,
선형회귀( parallel channel )나 추세선에서의 지지, 저항과 함께 판단하여 포지션 진입의 신뢰도를 높혀주는 형태로 사용하시길 권장 드립니다.
당신의 트레이딩에 도움이 되었으면 합니다.
부자되세요!
背离
Oscillators Overlay w/ Divergencies/Alerts by DGTAn oscillator is a technical analysis tool that, simply said, gauge momentum, determine market trend direction and duration. For some oscillators, fluctuations are bounded by some upper and lower band, and traders use them to discover short-term overbought or oversold conditions.
Oscillators are often combined with moving average indicators to signal trend breakouts or reversals
Histogram, is the difference between the oscillator and signal lines, which oscillates above and below a center line and is used as a good indication of an asset's momentum
What to look for
- Signal Line Crossover is the most common signal produced by the oscillators
- Zero Line Crossovers have a very similar premise to Signal Line Crossovers
- Divergence , when the oscillator and actual price are not in agreement, is another signal created by the oscillators
- Overbought and Oversold , with any range-bound oscillator, conditions are a primary signal generated
Oscillators Overlay study
* Presents oscillators on top of the mian chart (price chart)
* A single indicator for many well known and custom oscillators
* Divergence detection
* Alerts for various condtions
The list of oscillators included;
- Awesome Oscillator (AO)
- Chaikin Oscillator (Chaikin Osc)
- Commodity Channel Index (CCI)
- Distance Oscillator
- Elder-Ray Bear and Bull Power
- Elliott Wave Oscillator (EWO)
- Klinger Oscillator
- Money Flow Index (MFI)
- Moving Average Convergence Divergence (MACD)
- Rate Of Change (ROC)
- Relative Strength Index (RSI)
- Stochastic (Stoch)
- Stochastic RSI (Stoch RSI)
- Volume Oscillator (Volume Osc)
- Wave Trend
In technical analysis, investors find oscillators to be important technical tools and consider them more effective when used in conjunction with other means of technical analysis
Disclaimer : Trading success is all about following your trading strategy and the indicators should fit within your trading strategy, and not to be traded upon solely
The script is for informational and educational purposes only. Use of the script does not constitutes professional and/or financial advice. You alone the sole responsibility of evaluating the script output and risks associated with the use of the script. In exchange for using the script, you agree not to hold dgtrd TradingView user liable for any possible claim for damages arising from any decision you make based on use of the script

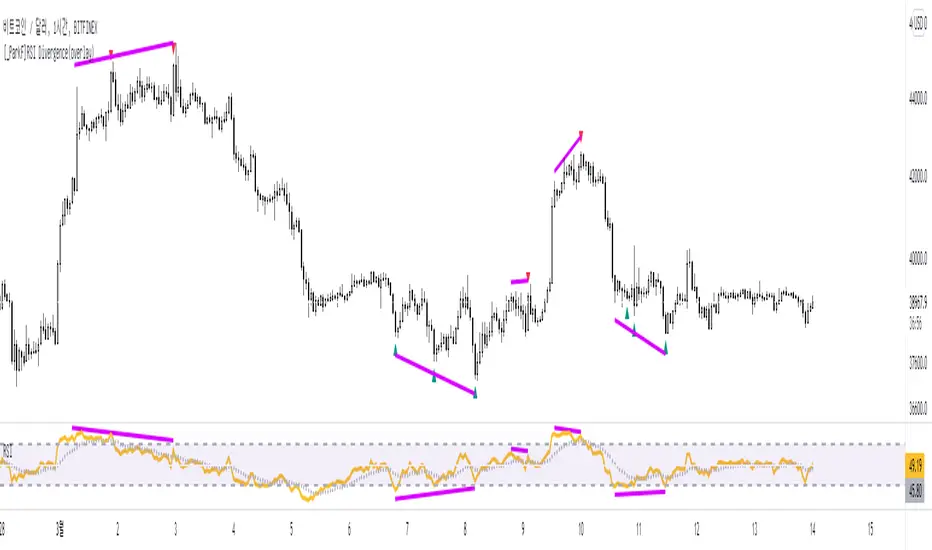
Parabolic RSIThe Parabolic RSI is a fusion between two of Welles Wilder Jr.'s indicators:
* The parabolic stop-and-reverse: A trend following overlay indicator.
* The relative strength index: A contrarian indicator bounded between 0 and 100.
The parabolic RSI applies the RSI formula on the parabolic stop-and-reverse which in turn is applied on the market price. The main aim is to find an oscillator similar to the RSI but with a touch of a trend following indicator. In other words, the parabolic RSI is to be used in tandem with the regular RSI to get a confirmatory signal. Generally the parabolic RSI is more stable than the RSI due to the formula used (a type of smoothing from the parabolic stop-and-reverse) which is why it may have a diversification factor with the signals from the RSI.
The best way to use the parabolic RSI is as follows:
* A long signal is generated whenever the parabolic RSI exits the oversold level.
* A short signal is generated whenever the parabolic RSI exits the overbought level.

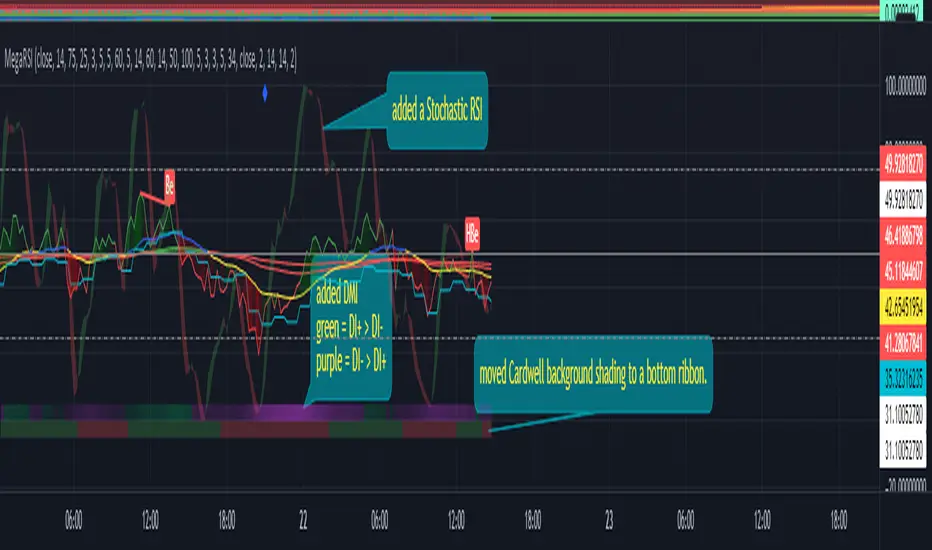
MegaRSIAre you looking for an RSI? I don't know if you can get any more information out of 1 RSI indicator than you can with MEGARSI!!!!! Includes RSI, RSI Divergence spotter, 2 RSI MAs, a smoothed RSI, a multi timeframe RSI and upper and lower diamond plots for potential trend reversals. It also includes background shading based on Andrew Cardwell's RSI ranges articles to help identify longer term trends and RSI patterns. See the included chart call outs for identification of individual parts.
[_ParkF]RSI+RSI ----- UPGRADE ----> RSI+
-------------------------------------------------------------------------------------------------------------------------------------------------------------------------------------------
The RSI index has been upgraded.
The display function of RSI Candle, RSI Line, Divergence, and Divergence Line, which were previous functions, has been maintained.
As an upgrade, two linear regression and two trend lines are drawn.
Since the two linear regression values are different, support and resistance of long-term and short-term linear regression can be confirmed.
The two trend lines also have different period values, so it is possible to check support and resistance that could not be confirmed in linear regression.
Each linear regression and trend line can be turned on and off.
In addition, each linear regression and trend line can arbitrarily modify period values and deviation values.
Log charts and linear chart switches have been added to the trend line.
I hope it will help you with your trading.
-------------------------------------------------------------------------------------------------------------------------------------------------------------------------------------------
RSI 인덱스가 업그레이드되었습니다.
기존 기능이었던 캔들, 라인, 다이버전스, 다이버전스 라인의 디스플레이 기능은 그대로 유지됐다.
업그레이드로 두 개의 선형 회귀 분석과 두 개의 추세선이 그려집니다.
두 선형 회귀 값은 서로 다르기 때문에 장기 및 단기 선형 회귀의 지지 및 저항을 확인할 수 있습니다.
두 추세선의 주기 값도 다르므로 선형 회귀 분석에서 확인할 수 없었던 지지 및 저항을 확인할 수 있습니다.
각 선형 회귀선 및 추세선은 켜거나 끌 수 있습니다.
또한 각 선형 회귀선 및 추세선은 주기 값과 편차 값을 임의로 수정할 수 있습니다.
로그 차트 및 선형 차트 스위치가 추세선에 추가되었습니다.
당신의 트레이딩에 도움이 되었으면 합니다.
* I would like to express my gratitude to zdmre for revealing the linear regression source.
* I would like to express my gratitude to aaahopper for revealing the trendlines source.

[_ParkF]RSI (+ichimoku cloud)RSI
Typical RSI indicators were plotted with candles and expressed wick to resemble a candle chart,
and linear regression was added to predict changes in force intensity,
which allowed us to confirm support and resistance within linear regression .
In addition, divergence signal was marked as an additional basis for the price fluctuation point due to support and resistance .
In other words,
if the diversity signal appears together when the rsi candle is supported and resisted within linear regression ,
this is the basis for predicting that it is a point of change in the existing trend.
Finally, the period value and standard deviation of linear regression can be arbitrarily modified and used.
I hope it will help you with your trading.
--------------------------------------------------------------------------------------------------------------------------------------------------------------
(+ichimoku cloud)
Clouds made of the preceding span 1 and the preceding span 2 of the balance table can predict the trend by displaying the current price balance ahead of the future.
In addition to the role of clouds in the above-described balance sheet, this indicator also shows the cloud band support and resistance of the current RSI value.
일반적인 RSI 지표를 캔들화 하였고 꼬리까지 포함하여 캔들 차트와 유사하게 표현 하고,
캔들화한 RSI 지표에 선형회귀(채널)를 추가 하여 RSI 지표 특유의 힘의 강도의 변화를 지지와 저항으로 확인할 수 있게 해봤습니다.
또한 다이버전스 신호를 추가하여 선형회귀(채널)로 인한 지지와 저항에 따른 가격 변동의 근거로 삼을 수 있습니다.
즉, 선형회귀(채널) 안에서 RSI 캔들이 지지와 저항을 받을 때 다이버전스 신호가 함께 나타난다면 이는 기존 추세의 변화 지점임을
예측해 볼 수 있는 근거가 됩니다.
마지막으로 선형회귀(채널)의 기간값과 표준편차는 임의로 수정하여 사용할 수 있습니다.
당신의 트레이딩에 도움이 되었으면 합니다.
--------------------------------------------------------------------------------------------------------------------------------------------------------------
(+일목균형표의 구름)
일목균형표의 선행스팬1과 선행스팬2로 만들어진 구름은 현재 가격의 균형을 미래에 선행하여 표시하여 추세를 예측해볼 수 있습니다.
본 지표에서는 위에서 설명한 일목균형표의 구름의 역할과 더불어 현 RSI 값의 구름대 지지, 저항 또한 확인해볼 수 있습니다.
* I would like to express my gratitude to zdmre for revealing the linear regression source.

[_ParkF]RSIRSI
Typical RSI indicators were plotted with candles and expressed wick to resemble a candle chart,
and linear regression was added to predict changes in force intensity,
which allowed us to confirm support and resistance within linear regression.
In addition, divergence signal was marked as an additional basis for the price fluctuation point due to support and resistance.
In other words,
if the diversity signal appears together when the rsi candle is supported and resisted within linear regression,
this is the basis for predicting that it is a point of change in the existing trend.
Finally, the period value and standard deviation of linear regression can be arbitrarily modified and used.
I hope it will help you with your trading.
일반적인 RSI 지표를 캔들화 하였고 꼬리까지 포함하여 캔들 차트와 유사하게 표현 하고,
캔들화한 RSI 지표에 선형회귀(채널)를 추가 하여 RSI 지표 특유의 힘의 강도의 변화를 지지와 저항으로 확인할 수 있게 해봤습니다.
또한 다이버전스 신호를 추가하여 선형회귀(채널)로 인한 지지와 저항에 따른 가격 변동의 근거로 삼을 수 있습니다.
즉, 선형회귀(채널) 안에서 RSI 캔들이 지지와 저항을 받을 때 다이버전스 신호가 함께 나타난다면 이는 기존 추세의 변화 지점임을
예측해 볼 수 있는 근거가 됩니다.
마지막으로 선형회귀(채널)의 기간값과 표준편차는 임의로 수정하여 사용할 수 있습니다.
당신의 트레이딩에 도움이 되었으면 합니다.
* I would like to express my gratitude to zdmre for revealing the linear regression source.

Haos Visual Divergence + Volume Analysis█ OVERVIEW
The Haos Visual Oscillators is a trend indicator that combines two William % indicators with different periods , to show Over Sold and Over Bought signals.
I have added Divergences and a volume indicator to check if buying or selling pressure is exhausted or showing divergences
this can help spot trend reversals
code taken from:
www.prorealcode.com
█ DESCRIPTION
Divergences:
• checks up to 20 pivot points to look for Divergences
• Divergences require single candle confirmation
• Divergences are only confirmed if oscillator pivot is of close proximity of a price pivot
Volume Indicator:
• checks for volume divergences or exhaustion
This is done by comparing relative change in price to the relative change in volume when oscillator is at over bought or over sold levels
indicator Columns:
• Yellow => divergence has been spotted
• Dim Yellow => divergence was spotted on the previous candle
• Blue => volume exhaustion was spotted
• Dim Blue => volume exhaustion was spotted on the previous candle
• Green => OverSold
• Red => OverBought
OB/OS:
• OverBough t => above 30
• OverSold => below -30
Alerts:
• Regular Bullish Divs
• Hidden Bullish Divs
• Regular Bearish Divs
• Hidden Bearish Divs
- if you realized that I posted 2 versions of the indicator :
• its because I named the first version wrongly on the publishing name and cant change it

Haus Visual Divergence + Volume Analysis█ OVERVIEW
The Haos Visual Oscillators is a trend indicator that combines two William % indicators with different periods , to show Over Sold and Over Bought signals.
I have added Divergences and a volume indicator to check if buying or selling pressure is exhausted or showing divergences
this can help spot trend reversals
code taken from:
www.prorealcode.com
█ DESCRIPTION
Divergences:
• checks up to 20 pivot points to look for Divergences
• Divergences require single candle confirmation
• Divergences are only confirmed if oscillator pivot is of close proximity of a price pivot
Volume Indicator:
• checks for volume divergences or exhaustion
This is done by comparing relative change in price to the relative change in volume when oscillator is at over bought or over sold levels
indicator Columns:
• Yellow => divergence has been spotted
• Dim Yellow => divergence was spotted on the previous candle
• Blue => volume exhaustion was spotted
• Dim Blue => volume exhaustion was spotted on the previous candle
• Green => OverSold
• Red => OverBought
OB/OS:
• OverBought => above 30
• OverSold => below -30
Alerts:
• Regular Bullish Divs
• Hidden Bullish Divs
• Regular Bearish Divs
• Hidden Bearish Divs

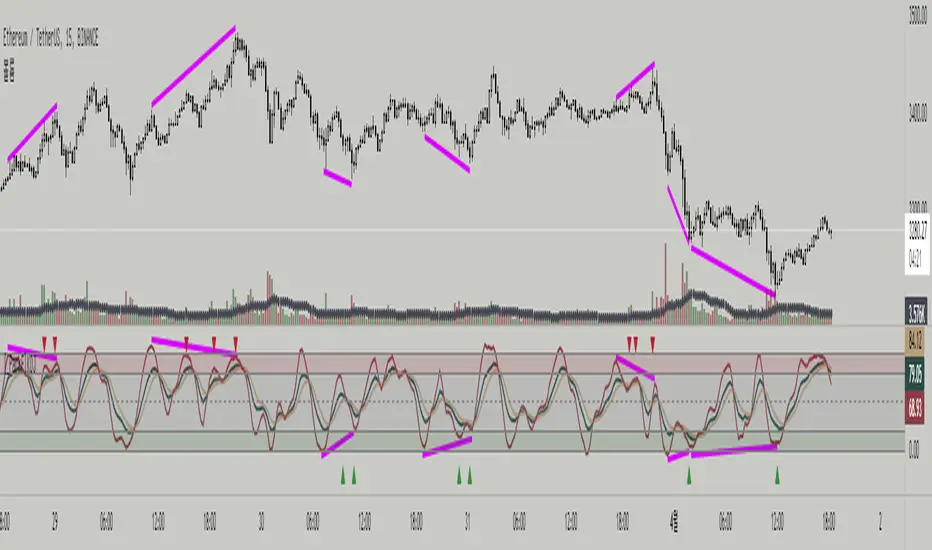
[_ParkF]RSI Divergence_overlayRSI Divergence_overlay
Does not include RSI indicator.
Up Signal = Displayed green dot below the candle
Down Signal = Dispalyed red dot above the candle
* Don't trade just at the signal
RSI 다이버전스
RSI 지표 미포함.
상승 신호 = 초록색 점으로 캔들 아래 표시.
하락 신호 = 빨간색 점으로 캔들 위에 표시.
* 신호만 보고 매매하지 마세요
Signals Pirate™ Oscillator DivergencesSignalsPirate™ Oscillator Divergences is the ultimate tool for divergence traders! With this all in one Oscillator package, you can quickly check bullish, bearish, regular and hidden divergences on all popular Oscillator indicators!
The main inputs for this divergence package are the ‘Lookback Length’ and ‘Indicator Smoothing’. The loockback simply determines how many bars back of any assets price actions will be scanned for divergences, with a lower value creating fewer signals with shorter divergence detection. The smoothing simply allows for any selected oscillator to have the values averaged out to create less choppy data. Within this package you have the availability to alter the settings of all included Oscillators as you would if you added them to your chart individually.
Additionally you can choose to include ‘Regular’ divergences, ‘Hidden’ divergences, or both! Divergences are a great leading technical tool that can help predict potential trend changes as price divergences from the underlying oscillator.
The default settings are the best settings we’ve found so far but you can change them to build your own unique trading strategy. We’d recommend experimenting with these values to find the best results for the asset you are trading, and your own personal trading and investing style.
Direction for use:
1. Use on any asset class and time frame.
2. Select which Oscillator you’d like to apply, and which Divergence labels should be shown.
3. Fine tune the ‘Lookback Length’ and ‘Indicator Smoothing’.
4. Wait for divergences to occur and use these signals to improve your technical analysis! Bullish divergences indicate a potential move to the upside is coming, where Bearish divergences indicate a potential move to the downside!
We hope you love this package, and it takes your trading and investing to the next level. Please let us know if you have any questions or queries regarding the logic behind the bundle, or if you have any suggestions for improvements etc. We love your feedback and are constantly striving to continuously improve!

Pro Divergence [regular + hidden] by TradingClue█ Pro Divergence is my new divergence-based toolkit that will help you to spot lucrative opportunities in all kinds of markets.
I've developed toolkits and strategies that use divergences for many years, e.g. AutoDivergence and CCIDivergence . Pro Divergence is my latest development and benefits from those yearlong experiences.
The main algorithm to detect divergences has changed from using linear regressions and moving averages to algorithmic trendline detection like I've been using in TD Lines .
This new approach supports the detection of regular divergences but also hidden divergences can be identified.
Before going more into the details of the mechanics of Pro Divergence, let's recap, what divergences are all about when it comes to trading.
█ Regular Divergence
The basic idea is pretty simple: If price goes in the opposite direction than some other technical indicator - in most cases an oscillator - we speak of a divergence. A regular divergence might be a signal for a trend reversal. That's it.
For example, if the price is currently rising, while at the same time Momentum is falling - it might be time for a reversal and the price of an asset is about to fall soon. If there are additional indications to confirm the signal, e.g. if RSI is in the overbought area, it might be a good idea to go short on that specific asset.
Regular bullish divergences are indicated when price is forming lower lows while an oscillator shows higher lows.
Regular bearish divergences are indicated when price is forming higher highs while an oscillator shows lower highs.
█ Hidden Divergence
While regular divergences indicate trend reversals, hidden divergences indicate a trend continuation.
When the price is making higher lows and the oscillator is showing lower lows, we speak of a bullish hidden divergence. When the price is making lower highs and the oscillator shows higher highs, it's a bearish hidden divergence.
These rules for identifying divergences are pretty simple and straightforward. And they are also confusing at times. But that's what Pro Divergence is helping you with: trade based on customizable signals to identify all kinds of divergences.
You could either use the strategy settings of the toolkit to optimize the properties to show winning backtesting results. Or you use the signals as an extra confirmation to some other kind of signal/ strategy you are working with.
█ Summary of all current features
• Oscillator: choose between CCI, Momentum, MACD, or RSI. All oscillators-settings are customizable.
• RSI-filter: in some cases, the quality of the signals can be improved by an RSI filter, e.g. a bullish signal would only be valid if RSI is in the oversold area. Set the RSI period and the oversold/ overbought levels to your preferred values.
• You can display all divergences on the chart to get an idea of the current price action. Or you can pick any combination of signals you would like to include in a backtest. Possible signals are: regular bullish divergence, regular bearish divergence, hidden bullish divergence, hidden bearish divergence
• Exits: there are many ways to get exit signals - combinations of the below options are possible:
• fixed profit targets/ stop losses based on ticks
• Exit when momentum reverses
• Exit when price touches the opposite Bollinger Band (e.g. a long position will be closed when price touches the upper Bollinger Band). The settings for the Bollinger Bands are customizable.
• Entry: you can choose only to enter a trade if momentum is going in the same direction as the direction of your trade (e.g. only go long if momentum is rising)
• time and date filer
• Do a backtest only in a given time range (maybe you're not interested in the whole range of historical data when trading in a higher timeframe. Or you would like to do some kind of walk forward analysis)
• Only trade during special times of a day, e.g. only trade during the first hours of a trading session
Since this strategy is making heavy use of math and technical indicators, it is not tied to a certain asset class or timeframe. It was tested successfully on a large number of financial instruments like stocks, crypto, forex, and others.

PivotsLibrary "Pivots"
This Library focuses in functions related to pivot highs and lows and some of their applications (i.e. divergences, zigzag, harmonics, support and resistance...)
pivots(srcH, srcL, length) Delivers series of pivot highs, lows and zigzag.
Parameters:
srcH : Source series to look for pivot highs. Stricter applications might source from 'close' prices. Oscillators are also another possible source to look for pivot highs and lows. By default 'high'
srcL : Source series to look for pivot lows. By default 'low'
length : This value represents the minimum number of candles between pivots. The lower the number, the more detailed the pivot profile. The higher the number, the more relevant the pivots. By default 10
Returns:
zigzagArray(pivotHigh, pivotLow) Delivers a Zigzag series based on alternating pivots. Ocasionally this line could paint a few consecutive lows or highs without alternating. That happens because it's finding a few consecutive Higher Highs or Lower Lows. If to use lines entities instead of series, that could be easily avoided. But in this one, I'm more interested outputting series rather than painting/deleting line entities.
Parameters:
pivotHigh : Pivot high series
pivotLow : Pivot low series
Returns:
zigzagLine(srcH, srcL, colorLine, widthLine) Delivers a Zigzag based on line entities.
Parameters:
srcH : Source series to look for pivot highs. Stricter applications might source from 'close' prices. Oscillators are also another possible source to look for pivot highs and lows. By default 'high'
srcL : Source series to look for pivot lows. By default 'low'
colorLine : Color of the Zigzag Line. By default Fuchsia
widthLine : Width of the Zigzag Line. By default 4
Returns: Zigzag printed on screen
divergence(h2, l2, h1, l1, length) Calculates divergences between 2 series
Parameters:
h2 : Series in which to locate divs: Highs
l2 : Series in which to locate divs: Lows
h1 : Series in which to locate pivots: Highs. By default high
l1 : Series in which to locate pivots: Lows. By default low
length : Length used to calculate Pivots: By default 10
Returns:

Co-relation and St-deviation Strategy - BNB/USDT 15minThis indicator based on statistical analysis. it uses standard deviation and its co-relation to price action to generate signals. and following indicators has been used to calculate standard deviation and its co-relation values. finally it is capable to identify market changes in bottoms to pic most suitable points.
1. Parabolic SAR (parabolic stop and reverse)
2. Supertrend
3. Relative strength index (RSI)
4. Money flow index (MFI)
5. Balance of Power
6. Chande Momentum Oscillator
7. Center of Gravity (COG)
8. Directional Movement Index (DMI)
9. Stochastic
10. Symmetrically weighted moving average with fixed length
11. True strength index (TSI)
12. Williams %R
13. Accumulation/distribution index
14. Intraday Intensity Index
15. Negative Volume Index
16. Positive Volume Index
17. On Balance Volume
18. Price-Volume Trend
19. True range
20. Volume-weighted average price
21. Williams Accumulation/Distribution
22. Williams Variable Accumulation/Distribution
23. Simple Moving Average
24. Exponential Moving Average
25. CCI (commodity channel index)
26. Chop Zone
27. Ease of Movement
28. Detrended Price Oscillator
29. Advance Decline Line
30. Bull Bear Power

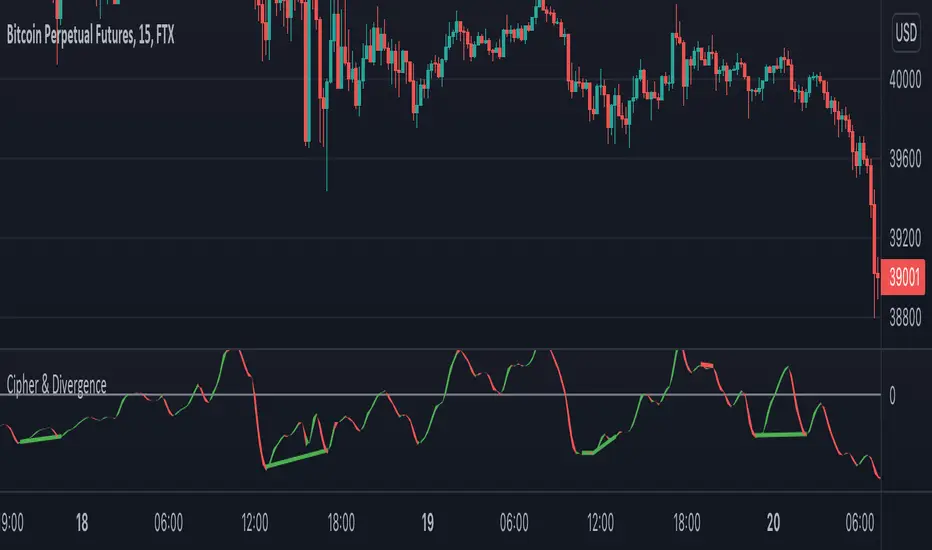
Cipher & DivergenceFor a long time I've been using complicated script with too much informations in it.
In this one I try to have just the bare minimum information to be able to analyse and find a potential reversal zone.
It is inspired from different wave trend / cipher script but has been tuned after months of backtest.
Extending the usage of the wave trend oscillator, which can be used with overbuy & oversell zone it might be better to wait for a confirmation of the movement. This confirmation can be identified by a pull back of the wave trend & price.
We can even confort ourself by waiting for reversal indicators.
Reversal may occurs after a divergence, wait for it, a cross of zero line followed by a PB to find your entry.
You can setup alert on bear / bull divergence but also when the wave trend cross the zero line to never miss a potential trade.
Huge thanks to LazyBear for his wave trend
And thanks vumanchu for his huge cipher script which was very useful for divergence finder
Constance Brown Composite Index - in candle stickConstance Brown Composite Index was developed by Miss Brown.
It is an alternative to the classic RSI , but responds better regardless of trending or ranging markets.
If you are not familiar with this tool, you could read her book "Technical Analysis for the Trading Professional, Second Edition". Some free materials can also be found on the web explaining the core concept of this index.
I find it offer more precise, successful and early detection of regular or hidden divergences.
I have highlighted examples of a few divergences on NQ future. It did provide a few hundreds points within only 2 trading sessions. Green and Red arrows show the areas where I took the trades.
The expected price movement has a much higher chance to materialize when the divergence starts from overbought or oversold area.
- ability to display the index in form of candles or a simple line.
- option to show higher timeframe data
For me, it's a good companion on 15, 60 and 240 min chart.
I use it on futures like ES, NQ and RTY but didn't test too much on other instruments.
I like to see it in the form of candles because you could spot reversal candle in overbought/sold areas giving more confirmation that the divergence is well established.
I don't recommend making trades only on this indicators, it's your responsibility to manage your risk and decision.
I hope you find it useful and glad to read your comments
Happy trading!

Divergence Energy Pro (DE Pro) MI05Divergence Energy Pro acts as an trend & volatility indicator calculated by combination of Moving Average data.
The Green bar indicates bullish energy, while the Red bar indicates bearish energy.
The length of the colour (red/green) bar indicates the energy's strength/momentum.
When the fisrt or second Green bar above the Zero Axis 💚 and MA line represents a strong bullish energy,
whereas the first or second Red bar below the Zero Axis ❤️ and MA line represents a strong bearish energy.
Apart from tracking the bullish/bearish trend in the market, it may be used to monitor the divergence/convergence between price and technical indicator.
Divergence occurs when the price moves in the opposite direction of a technical indicator, potentially leading a price shift.
Disclaimer:
This script indicator is solely for the purpose of education / opinion sharing only, and should not be construed as investment advice or recommendations to buy or sell any security.
Get your trade advise from a legit broker, you are responsible on your own trade.
Thank you.

Eflatun CCI Divergence and Top/BottomThe Commodity Channel Index (CCI) with Divergence and finding Top / Bottom points
Select MA with Sma, Ema, Wma, SWma, VWma, Hma or Rma
Follow bar color on top or bottom

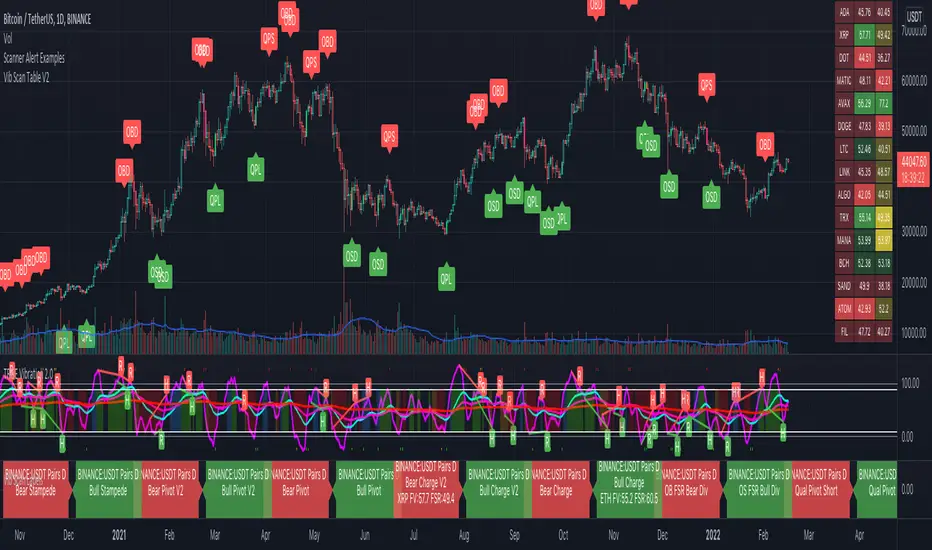
Scanner Alert ExamplesThis is a visual representation of the alerts built into the Vib Scanner Table (right side of main panel) and Vib Scanner Labels (bottom most panel) that are based on Mr. A's TrueVibration (other lower panel). Instead of a table or scanner labels, this indicator will print labels direction under/over candles identifying where the scanners will trigger alert, but this script only looks at a single asset. You can use this script to see how various settings play out across an asset's entire history and fine tune your scanner settings to your likings.
All of the alerts are coded the exact same way across all 3 of these:
Qualified pivots longs trigger with a "potential pivot long" occurs with a higher local low compared to the last time SmoothVib was under 30. Qualified shorts require the potential pivot short occur at a lower local high than the last time SmoothVib was over 70. As with the table, there is the option to choose to either require a Full Reset (SmoothVib goes all the way to the other extreme first) or just a partial reset (SmoothVib only comes out of OB/OS territory and back into it).
Overbought/Oversold FSR Divergences look for regular and hidden divergences in the FSR while it is in overbought or oversold territory.
Charge V1 Bull Alert is triggered when Full Vib is over the Full Vib Bull Threshold and FSR crosses over the Full Vib. Bear alert is Full Vib below Full Vib Bull Threshold and FSR crosses below Full Vib.
Charge V2 uses a "most recent DBI" filter and will trigger an alert any time the FSR crosses the Full Vibration and is in agreement with the most recent DBI .
Pivots V1 Bull Alert is triggered when Full Vib is over the Full Vib Bull Threshold and FSR pivots above the Full Vib. Bear Pivots are the opposite of this.
Pivots V2 look for similar FSR pivots , but with a Leading/Lagging Full Vib comparison. Bull Alerts require Leading Full to be above Lagging Full and the FSR to pivot on top of both. Bear pivots are the exact opposite.
Bull and Bear Stampede's look for FSR crossing over 120 or under -20, respectively, and indicate EXTREME momentum.
Please note: these alerts are my extensions of the TrueVibration indicator and concepts by TrueCrypto28, aka Mr. A. HUGE thank you to him for all his incredible work!
While these scanners can be used as standalone to some extent, an understanding of TrueVibration will take them to another level.
Vib Scanner LabelsVib Scanner Labels (bottom most panel) is an alternate option for the Vib Scanner Table (seen on right side of main chart area). Instead of a table that only sends alerts on bar close, this will print labels identifying any asset that is meeting the chosen alert criteria IN REAL TIME, though the alerts will still only trigger on bar close. It can be useful if you want to get an early eye on assets that may trigger an alert in the very near future.
Please note: these alerts are my extensions of the TrueVibration indicator and concepts by TrueCrypto28 Mr. A (TrueCrypto28). HUGE thank you to him for all his incredible work!
I've inset a pared down version of it in the main chart image here for some clarity. The TrueVibration indicator is still driving the candle colors in this chart image.
While these scanners can be used as standalone to some extent, an understanding of TrueVibration will take them to another level.
Two other indicators go hand in hand with this:
The "Vib Scanner Table" (again, seen on the right side of the main panel) will display all scanned assets in a table with momentum readings colored for various reasons explained in that indicator detail. All of the alerts are identical.
"Scanner Alert Examples" (labels displayed directly under/over candles) will display labels directly on the chart you're looking at, see the results across an asset's entire history, and can tweak the scanner settings to your liking.
All of the alerts are coded the exact same way across all 3 of these:
Qualified pivots longs trigger with a "potential pivot long" occurs with a higher local low compared to the last time SmoothVib was under 30. Qualified shorts require the potential pivot short occur at a lower local high than the last time SmoothVib was over 70. As with the table, there is the option to choose to either require a Full Reset (SmoothVib goes all the way to the other extreme first) or just a partial reset (SmoothVib only comes out of OB/OS territory and back into it).
Overbought/Oversold FSR Divergences look for regular and hidden divergences in the FSR while it is in overbought or oversold territory.
Charge V1 Bull Alert is triggered when Full Vib is over the Full Vib Bull Threshold and FSR crosses over the Full Vib. Bear alert is Full Vib below Full Vib Bull Threshold and FSR crosses below Full Vib.
Charge V2 uses a "most recent DBI" filter and will trigger an alert any time the FSR crosses the Full Vibration and is in agreement with the most recent DBI .
Pivots V1 Bull Alert is triggered when Full Vib is over the Full Vib Bull Threshold and FSR pivots above the Full Vib. Bear Pivots are the opposite of this.
Pivots V2 look for similar FSR pivots , but with a Leading/Lagging Full Vib comparison. Bull Alerts require Leading Full to be above Lagging Full and the FSR to pivot on top of both. Bear pivots are the exact opposite.
Bull and Bear Stampede's look for FSR crossing over 120 or under -20, respectively, and indicate EXTREME momentum.

SKARB DivergenceENG:
This is a script that colors RSI overbought and oversold conditions and as a bonus, displays bullish or bearish divergences in the last 90 candles (you can change it by default).
Part of the code is taken from the Trading View examples.
RU:
Это скрипт, который окрашивает условия перекупленности и перепроданности RSI и в качестве бонуса отображает бычьи или медвежьи дивергенции в последних 90 свечах (по умолчанию вы можете изменить его).
Xасть кода взята из примеров Trading View.

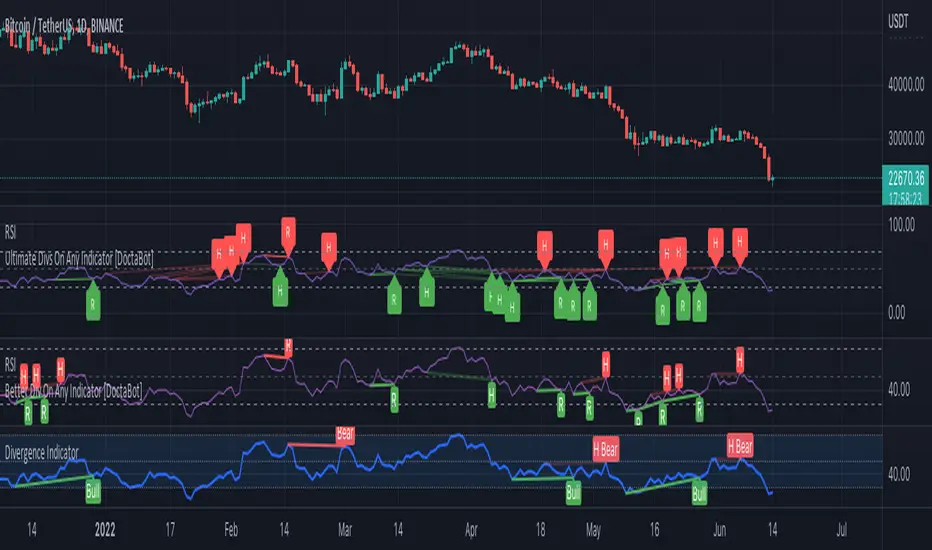
Better Divergence On Any Indicator [DoctaBot]This is an expansion of the Tradingview built in Divergences indicator (bottom) with 2 MAJOR differences.
First, and most importantly, the built in indicator identifies pivots in your chosen oscillator, but then utilizes the corresponding candle's HIGH or LOW to identify potential divergences. I'm not a fan of this method because oscillator values are typically calculated using the candle CLOSE values, so, in my opinion, divergences should be identified using the candle CLOSE value as well, as they are in this script.
Second, the built in divergence indicator only looks back one oscillator pivot for potential divergences. I coded this to look back one additional pivot as well to identify more valid potential divergences. The script will only identify these types of "multiple pivot divergences" if the oscillator pivot in between the two diverging pivots DOES NOT intersect the line being drawn them.
Notes for chart:
#1: This built in Divergence indicator misses this hidden bearish divergence because of the pivot in between (marked with red vertical line). No divergence exists between the most recent pivots, but it does if we compare it to the next one back.
#2: The RSI14 is making a lower high here, the first criteria for a bearish divergence. The built in Divergence indicator then references the candles' HIGHS. Because the most recent HIGH exceeds the previous one, it is considered a higher high and incorrectly identified as a bearish divergence. If we use the candle CLOSE price to identify divergences, this does not qualify.
#3: Here, we see both of the updates in action. Neither of these bearish divergences are identified with the built in Divergence Indicator. The first divergence s missed due to the use of candle HIGHS rather than closes; the original HIGH is greater than the next HIGH, however, comparison of closes shows that it is, in fact, a higher CLOSE. The second divergence is missed because original indicator can only look back one pivot and, consequently, misses the divergence between the next one back.
Please note, you may notice while using this script that some of the older divergences do not show any lines between the oscillator pivots. THIS IS NOT A BUG! In order to draw divergence lines properly for multiple pivots back, I had to use the line.new functions rather than plot functions. These line functions will delete old lines when a certain number have been drawn on the chart so these old ones are automatically erased as time passes.
[UPRIGHT Trading] Awesome MACD+ (cc)Hello Traders,
I'd like to introduce you all to the Awesome MACD+ indicator.
As most of you know, the Moving Average Convergence Divergence, MACD, indicator is a one of the most popular indicator among traders. The MACD is a trend-momentum indicator that measures the relationship between moving averages and uses a signal line to show crossovers between the MACD line. The signal line is generally used as a trigger for buy/sell signals with a cross of the MACD line or confirmation when used with other strategies. More advanced traders will look for divergences; divergences can, for example, indicate a weakness in the current trend.
How the Awesome MACD+ is different:
This MACD uses several complex equations and filters to improve accuracy.
Multiple extremely accurate Buy/Sell signals not found on a traditional MACD indicator.
Ability to use 2 different background highlight signals and several different buy/sell signals.
Fully customizable (as always), ability to turn on or off any signals, change any of the colors to suit your needs.
***I've used Bitcoin in the chart above just to show that it is still extremely accurate using alt-coins as well.
On AAPL
Advanced algo trend filtering
Easy to read signals for every level of trader.
..Can work for the minimalist.
..Those that want every signal.
..Those that like a balance of signals.
Whatever your style or skill level, the Awesome MACD+ can be customized to fit your needs.
The above chart should look like this:
Good luck Traders.
Cheers,
Mike
(UPRIGHT Trading)
