LockedEye MTF CRT Map SentinelOverview
This script provides a structured multi-timeframe display of market conditions.
It summarizes key elements from M1 up to D1 using five components:
- CRT (Continuation/Reversal Trigger)
- MA6 micro-trend filter
- Candle-close direction
- MA250 macro trend filter
- Sentiment percentage computed from the above signals
The panel is designed to present information at a glance, allowing traders to understand how different timeframes align or disagree.
The purpose is not to merge random indicators. Each row uses a specific rule-based calculation that contributes to an integrated multi-timeframe read. The focus is on market structure, micro-trend, and directional pressure as expressed across several intervals.
How the Script Works
The script does not rely on external indicators. All calculations are performed internally through candle relationships, moving averages, MTF requests, and simple classification logic.
1. CRT Logic (Continuation and Reversal)
CRT identifies two types of behavior in each timeframe:
Continuation: The current candle closes outside the previous candle’s high or low.
Reversal after a sweep: Price takes the previous high or low but closes back inside the range.
A close outside the previous range suggests continuation.
A sweep followed by a close back inside suggests a shift in pressure or reversal .
The CRT row labels these conditions as Bull, Bear, or Wait.
2. MA6 Micro-Trend
The script uses a 6-period simple moving average to understand immediate trend pressure.
Close and open both above the MA6 = Bull
Close and open both below the MA6 = Bear
Mixed = Wait
This gives a quick view of short-term momentum without repainting.
3. Candle-Close Direction
This uses a simple comparison:
Close > Open = Bull
Close < Open = Bear
Equal = Neutral
It is a raw directional signal without interpretation.
4. MA250 Macro Filter
The script applies a 250-period MA to understand the broader trend.
Break above the MA250 = BR (BullRun)
Break below the MA250 = BC(BearCrash)
Inside range = Neutral
This acts as a long-term directional filter .
5. Sentiment Computation
The script aggregates CRT, MA6, and Candle-Close across all timeframes.
Each timeframe contributes a value.
The script then calculates the percentage of bull, bear, and neutral signals.
A short text summary explains whether signals are aligned or mixed.
How to Use the Panel
Multi-Timeframe Alignment
The panel is most useful when interpreting how lower and higher timeframes behave together:
When many timeframes show the same direction, it reflects stronger alignment.
When timeframes disagree, market conditions are more mixed or range-bound.
Users can watch for shifts when multiple rows turn from mixed to aligned.
Trend-Following Context
If higher timeframes (H2–D1) show consistent directional readings in CRT, MA6, and MA250, users may treat that as broader structural context.
Lower timeframes (M1–M15) can then be used to observe pullbacks or shifts within that larger trend.
Counter-Trend Context
If higher timeframes show one direction but lower timeframes show the opposite, this may indicate short-term reactions or pullbacks.
The script does not assume these reactions will continue; it only shows the multi-frame condition so users can decide how to interpret it.
Liquidity Sweep Context
CRT will classify moments when price takes a previous high or low and re-enters the range.
This is included so users can detect areas where the market moves beyond a level and immediately rejects it.
Alerts
The script includes alert conditions for:
CRT Bull or Bear flips on the chart’s timeframe
Multi-timeframe consensus reaching a user-defined threshold
Users can create alerts through the TradingView alert menu once the indicator is added to the chart.
Note:
The script includes a non-repaint mode for alert stability. This mode ensures only confirmed candle closes are used in calculations.
Chart Use
The script displays a fixed panel on the chart.
Users may select the panel’s position to avoid covering price action.
Users are advised to publish with a clean chart where only this script is active, unless pairing is required for explanation.
Toggles:
Close Candle(Non Repaint)
Monitor: BTCUSD along w RSI
Monitor 2: Any Coin
Flip M1-D1
Fast CRT
Final Notes
This script does not forecast future price movement and does not claim accuracy, profitability, or performance results.
It is a diagnostic tool that organizes real-time price behavior across multiple timeframes.
Users should apply their own judgment and risk management.
Panel

RSI Diode PanelA small and clean RSI panel that simultaneously shows the 15m, 30m, 1h, 2h, 4h, and 1d timeframes, which can help you with basic trend orientation.

Smooth Moving Average (SMA) MTF Trend PanelDescription:
The SMA MTF Trend Panel is a multi-timeframe (MTF) trend visualization tool designed to help traders quickly assess market conditions across multiple timeframes based on the Simple Moving Average (SMA). This script calculates the trend direction (Bullish, Bearish, or Neutral) and the trend strength percentage for each selected timeframe. It displays the information in an intuitive panel that is dynamically updated in real-time.
How It Works:
1. SMA Calculation:
• For each timeframe, the script calculates the SMA based on a user-defined length (default: 50).
2. Trend Identification:
• Compares the current price to the SMA and assigns a label: “Bull,” “Bear,” or “Neutral.”
3. Panel Display:
• Displays trends, strengths, and shifts for each timeframe in an interactive table.
4. Real-Time Updates:
• Continuously monitors price movements and updates the panel to reflect the latest data.
Customizable Inputs:
1. Panel Settings:
• Orientation: Choose vertical or horizontal layout.
• Position: Select panel location on the chart.
• Border Width/Color: Adjust panel borders for better visualization.
2. Trend Colors:
• Define custom colors for bullish, bearish, neutral, and shift conditions.
3. SMA Length:
• Adjust the SMA period to suit your trading style (e.g., short-term scalping or long-term trend following).
4. Timeframes:
• Set specific timeframes to analyze based on your trading strategy.

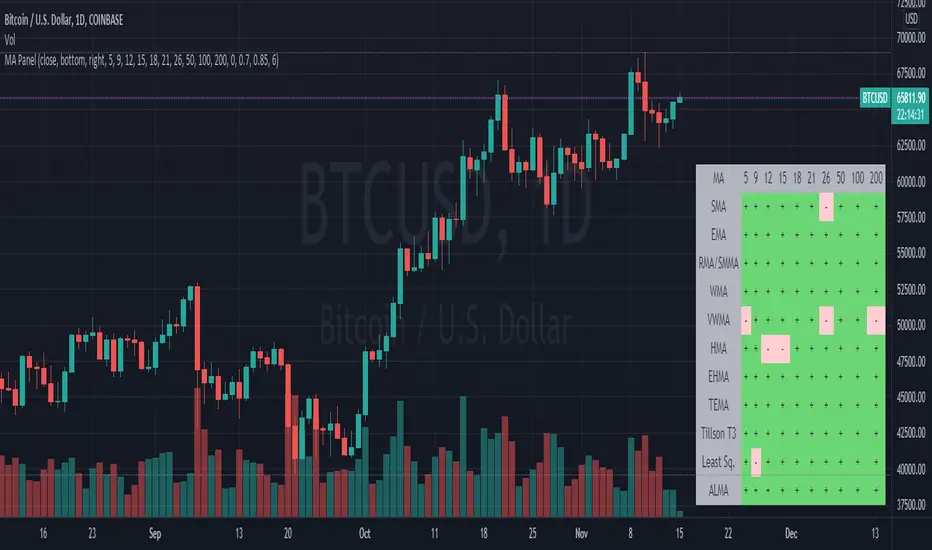
Black Moving AveragesGENERAL OVERVIEW
The moving average (MA) indicator is a foundational yet versatile tool in technical analysis, used by traders and investors to smooth out price data over a specific time frame. This helps to identify the direction of a trend by filtering out short-term fluctuations or "noise" in the price action. By observing the moving average line, traders can gain insights into potential support and resistance levels, trend strength, and possible trend reversals. Moving averages are especially useful in trending markets, where they can enhance the timing of entries and exits.
The Black Moving Averages indicator is an enhanced Moving Average indicator with unique features in one indicator, features like multi-timeframe, multi-types/length, custom labelling and moving average compact PANEL with multi-symbol support.
📌HOW DOES IT WORK
A moving average is a constantly updated average price calculated by adding up the closing prices of a security over a set period and dividing by the total number of periods.
Uptrend: If the moving average line is sloping upwards and the price is above the moving average, this typically indicates an uptrend.
Downtrend: If the moving average slopes downward with price action mostly below it, a downtrend is likely in effect.
Flat/Sideways Trend: When the moving average is flat, it suggests a range-bound or consolidating market with no clear trend.
Common Moving Average Periods:
The choice of period for a moving average can vary significantly depending on the trader’s strategy:
Short-Term Traders: Often use periods such as 5, 10, or 20 (intraday or daily) to capture quick price movements.
Medium-Term Traders: Typically use 50-period MAs, which can help spot trend changes within a few weeks to a few months.
Long-Term Traders/Investors: Favor 100, 200, or even 250-period MAs to analyze the overarching trend in daily or weekly charts.
📌HOW TO USE IT
When an asset's price crosses above its moving average, it can be a signal to buy, while crossing below can be a signal to sell.
Moving Average Crossovers: When a short-term moving average crosses above a long-term moving average, it generates a “Golden Cross,” indicating a bullish trend. Conversely, when a short-term MA crosses below a long-term MA, this creates a “Death Cross,” signalling a potential bearish trend.
Moving Average Envelopes and Bands: Some traders use moving averages to create envelopes or bands (e.g., Bollinger Bands), which add upper and lower bands around the moving average. These can help to assess the volatility and gauge potential price reversals.
Dynamic Support and Resistance: Longer-term MAs, such as the 200-day SMA, often act as dynamic support or resistance. If the price bounces off this MA several times, it reinforces the indicator’s significance.
Trend Confirmation and Continuation: Traders can confirm trends by observing if the price consistently stays above or below the moving average. This can be a signal to maintain an existing position.
Crossover Signals for Entries and Exits: A crossover strategy, where a shorter MA crosses above or below a longer MA, can serve as a reliable entry or exit point. This is particularly popular for catching early trend changes.
Combining with Other Indicators: Moving averages often yield better results when used alongside other indicators, such as the Relative Strength Index (RSI) for confirming overbought or oversold conditions, or the MACD for gauging momentum.
Limitations of Moving Averages
Lagging Nature: Moving averages rely on historical data, which makes them inherently lagging indicators, meaning they tend to react after a trend is already underway.
False Signals: In range-bound or choppy markets, moving averages can produce false signals, leading to potentially unprofitable trades.
When to be cautious:
When an asset's price is driven by strong momentum, it can remain over-extended for a long time. In this case, slight pauses may be mistaken for reversals.
By refining your understanding of moving averages and using them within the broader context of technical analysis, you can leverage their simplicity and effectiveness to better time entries, and exits, and spot potential reversals in various types of market conditions.
Black Moving Averages Indicator Features:
Multiple Moving Averages with multiple types, lengths & Cross
Multi Timeframe support
Moving Average PANEL with TF, Multi Symbol, Type, Length & Trend Strength
Moving Averages Horizontal Display with Labels (Type, TF, Price)
⚙️Black Moving Average SETTINGS
+ Black Moving Averages Dashboard ◢
- Moving Averages: Enable/Disable the Moving Averages on Chart
- MA Cross: Enable/Disable the Moving Averages Cross plot on the Chart
- MA PANEL: Enable/Disable the Moving Averages Panel on Chart
- VWAP: Enable/Disable the VWAP on Chart
+ Moving Averages Display Settings ◢
- Switch to Horizontal Lines: It switches the moving averages lines into horizontal lines on the charts
- Labels: It allows users to display moving averages labels (TF, type, length), prices or both on the chart
- Label Text Size: The user can select label text size (Tiny, Small, Normal, Large, Huge)
- Label Offset: Input label offset value (distance of label display from moving averages)
+ Moving Average Settings ◢
- Moving Average Length: input value of moving average length
- Color: Color selection for moving average
- Timeframe: Selection of timeframe for the moving average
- Type: Selection of MA type for the moving average
- Source: Selection of MA source(close, open etc) for the moving average
- Style: Display style (Line, Cross, Circle) for the moving average
- Line width: Display width of the moving average
+ Moving Average Cross Settings ◢
- | | Coss A | :
Plots cross of two user-specified moving averages on the chart
- | | Coss B | :
Plots cross of two user-specified moving averages on the chart
- | | Coss C | :
Plots cross of two user-specified moving averages on the chart
+ Moving Average PANEL Settings ◢
- Override Panel Symbol: Enables user to select the symbol for MA PANEL
- MA Panel Symbol: Displays symbol on the MA PANEL
- Panel H/V Position: Displays MA Panel Horizontally or Vertically
- Moving Average Panel Position: Selection of MA Panel position on the chart
- Panel Text Size: The user can select panel text size (Tiny, Small, Normal, Large, Huge)
- Panel Text Color: Color selection for panel text
- Cross A: Displays moving averages bullish/bearish cross on the panel from "Moving Average Cross Settings"
- Cross B: Displays moving averages bullish/bearish cross on the panel from "Moving Average Cross Settings"
- Cross C: Displays moving averages bullish/bearish cross on the panel from "Moving Average Cross Settings"
- Panel MA Length: input value of panel moving average length
- Timeframe: Selection of timeframe for the panel moving average
- Type: Selection of MA type for the panel moving average
- Source: Selection of MA source(close, open etc) for the panel moving average
Feedback & Bug Report
if you found any bug in this indicator or any suggestion, please let me know. Please give feedback & appreciate it if you like to see more future updates and indicators. Thank you

RSI MTF Panel [xdecow]This indicator shows the RSI of up to 10 different timeframes with various customization options:
Panel position
Panel orientation (vertical/horizontal)
Border width and color
Choose up to 10 time frames with RSI length and source
Background and text colors
Thresholds of overbought, oversold, uptrend, downtrend and no-trend zones to change the color of the RSI
Color debug mode

Strategy BackTest Display Statistics - TraderHalaiThis script was born out of my quest to be able to display strategy back test statistics on charts to allow for easier backtesting on devices that do not natively support backtest engine (such as mobile phones, when I am backtesting from away from my computer). There are already a few good ones on TradingView, but most / many are too complicated for my needs.
Found an excellent display backtest engine by 'The Art of Trading'. This script is a snippet of his hard work, with some very minor tweaks and changes. Much respect to the original author.
Full credit to the original author of this script. It can be found here: www.tradingview.com
I decided to modify the script by simplifying it down and make it easier to integrate into existing strategies, using simple copy and paste, by relying on existing tradingview strategy backtester inputs. I have also added 3 additional performance metrics:
- Max Run Up
- Average Win per trade
- Average Loss per trade
As this is a work in progress, I will look to add in more performance metrics in future, as I further develop this script.
Feel free to use this display panel in your scripts and strategies.
Thanks and enjoy :)

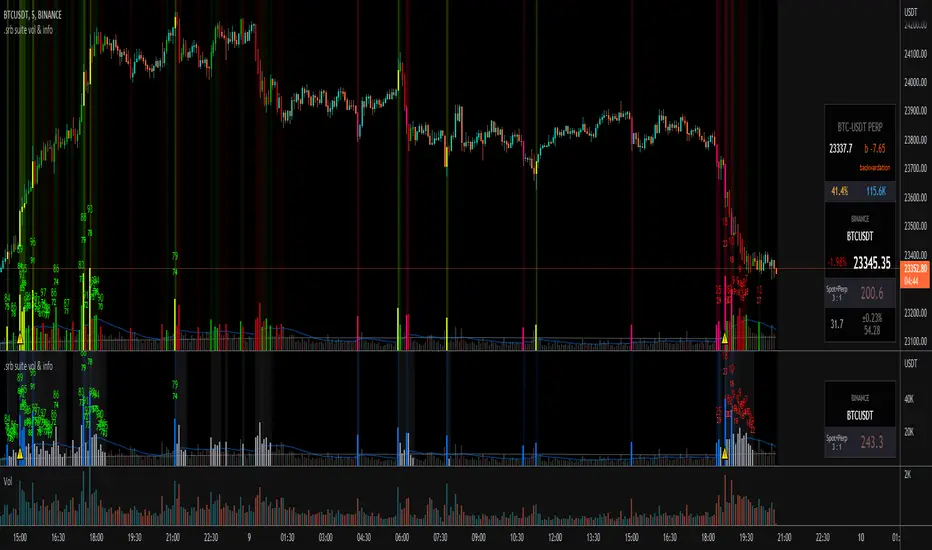
.srb suite vol & infoThe volume indicator
what can replace the built-in volume indicator and It also has some useful features.
and designed to work as overlay in the same pane with open-source indicator by default.
Regular volume Indicator
Volume SMA plot
Large Volume ! emphasize by color & mark.
Ultra Volume ! overlay marking ; x2 x4 x6 lager than regular average volume. it will help you can take the reversal
BTC-agg. Volume
4 BTC-spot & 4 BTC-PERP volume aggregated.
It might helps you don't miss out on important volume flows.
Weighted to spot trading volume when using PERP+spot volume.
If enabled, BTC-agg.Vol automatically applied when selecting BTC-pair.
Information panel (optimized for crypto-currency)
BTC-PERP price & delta (when Binance:BTCUSDT selected)
BTC dominance, Binance:BTCUSDTPERP OI
Symbol, Price, Daily up/down
ATR14 (for checking current volatility)
Recommended setup for .srb suite
tradingview | chart setting > Appearance > Top margin 0%, Bottom margin 0% for optimized screen usage
tradingview | chart setting > Appearance > Right margin 57
.srb suite vol & info --> Visual Order > Bring to Front
.srb suite vol & info --> Pin to scale > No scale (Full-screen)
Reverse Stoch [BApig Gift] - on PanelMssive credit to Motgench, Balipour and Wugamlo for this script. This script is all of their good work.
It is basically just the non-on chart version which I've slightly tweaked off their script. This can be useful to reduce the clutter on the chart itself. Releasing it in the hope that it can be useful for the community
Enjoy!

Moving Average PanelThis indicator calculates many different moving averages and displays whether they are increasing or decreasing as a panel/table instead of a plot. Rows/columns can be removed from the table as needed in the options menu, there is also a mobile friendly/compact option as well as a location option.
Note: This script is large and may take a few moments to load.
Note: If there is not enough data, will default to bearish/decreasing.
Value Added
This is the most complete and transparent moving average panel/table indicator. Unlike things such as the Technical Ratings, you can see what components are increasing or decreasing.
There may be some advantage in judging if a trend is likely to reverse or not based on the MA's with less lag.
Good for quick screening of charts.
Indicators OverlayHello All,
This script shows the indicators in separate windows on the main chart. Included indicators are RSI, CCI, OBV, Stochastic, Money Flow Index, Average True Range and Chande Momentum Oscillator. indicator windows are located at the top or bottom of the chart according to last moves of the Closing price. Different colors are used for each indicator. Horizontal levels are shown as dashed line and label as well.
Using the options;
You can enable/disable the indicators you want to see or not
You can change source and length for each indicator
You can set window length. using this length indicator windows are located on the chart
After you added this indicator to your chart I recommend: right click on any of the indicator windows => "Visual Order" => "Bring to front" as seen screenshot below:
in this example only 3 indicators enabled and period is set as 80:
indicator windows moves to the top or bottom of the chart according to the close price:
P.S. if you want to see any other indicator in the options then leave a comment under the indicator ;)
Enjoy!

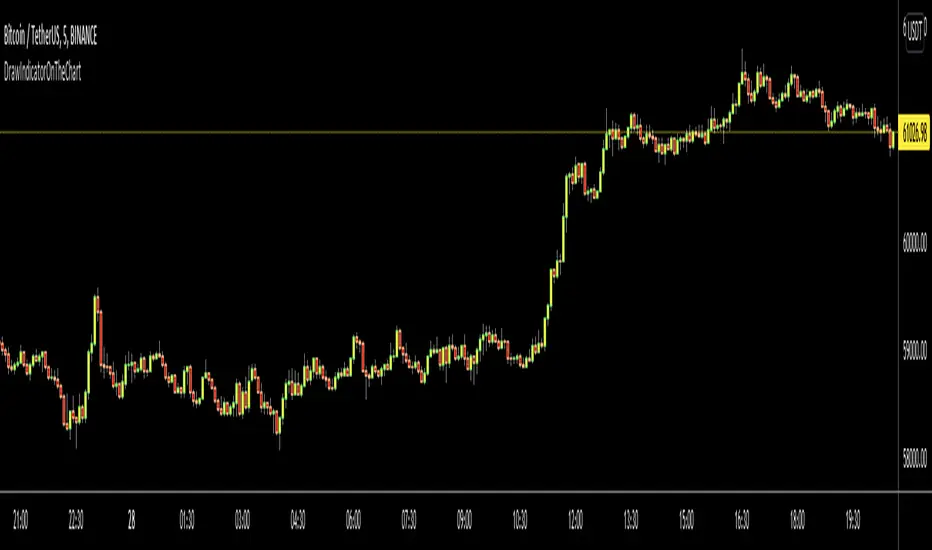
DrawIndicatorOnTheChartLibrary "DrawIndicatorOnTheChart"
this library is used to show an indicator (such RSI, CCI, MOM etc) on the main chart with indicator's horizontal lines in a window. Location of the window is calculated dynamically by last price movemements
drawIndicator(indicatorName, indicator, indicatorcolor, period, indimax_, indimin_, levels, precision, xlocation) draws the related indicator on the chart
Parameters:
indicatorName : is the indicator name as string such "RSI", "CCI" etc
indicator : is the indicator you want to show, such rsi(close, 14), mom(close, 10) etc
indicatorcolor : is the color of indicator line
period : is the length of the window to show
indimax_ : is the maximum value of the indicator, for example for RSI it's 100.0, if the indicator (such CCI, MOM etc) doesn't have maximum value then use "na"
indimin_ : is the minimum value of the indicator, for example for RSI it's 0.0, if the indicator (such CCI, MOM etc)doesn't have maximum value then use "na"
levels : is the levels of the array for the horizontal lines. for example if you want horizontal lines at 30.0, and 70.0 then use array.from(30.0, 70.0). if no horizontal lines then use array.from(na)
precision : is the precision/number of decimals that is used to show indicator values, for example for RSI set it 2
xlocation : is end location of the indicator window, for example if xlocation = 0 window is created on the index of the last bar/candle
Returns: none
Hx MTF Sorted MAs Panel with Freeze WarningThis script displays the close price and 4 sorted moving averages of your choice in a small repositionable panel and, when used on a higher timeframe, warns you when values may be different from actual values in the higher timeframe, inciting you to double check the actual values of the moving averages in the higher timeframe the panel is supposed to reflect.
The 4 moving averages and close are sorted together, providing you with a bird’s-eye view of their relative positions, the same way moving averages and last price values are displayed on the right scale.
The black header reminds of:
(1) the timeframe (resolution) used in the panel
(2) the remaining time before a new bar is created in the panel timeframe. Note that this remaining time is different from the one on the right scale, since it is only updated when a new transaction occurs.
Below, price and moving averages are sorted, color coded and followed by:
(1) a trend indicator ↗ or ↘ meaning that last change is up or down
(2) the number of bars since the moving average is above or below close (0 means current bar). This is obviously not displayed after the close price line (white background color).
Use
This panel was basically developed to display higher timeframe data but it can also be used with the same timeframe as chart for example if you do not want to plot moving averages on your chart but are still interested in their trends and relative positions vs price.
If you see something strange (like header is not black and displays NaN), it just means you requested moving averages that are not available in the panel timeframe. This may happen with newly introduced cryptos and “long” MA timeframes.
Different Timeframe
If you choose to use the panel on a different timeframe than the current one, be aware that you should only use timeframes higher than the current one, as per Tradingview recommendations.
If you select a lower timeframe than the current one, the panel timeframe header cell will turn to the alert color you set (fuchsia by default).
After tinkering for a while with the security function, I noticed that sometimes indicator values “freeze” (i.e. stop udating) and I have found no workaround.
What I mean is that when you look at a sma on a 5 minutes timeframe (the reference) and look at this same sma on a 5 minutes timeframe but from a lower timeframe through the security function set with a timeframe of 5 minutes, values returned by the security function are not always up to date and “freeze”. That’s the bad news.
Freeze warning
The better news is that this unexpected behaviour seems to be predictable, at least on minutes timeframes and I implemented an indicator that endeavors to detecting such situations. When the panel believes data may be frozen, the ‘Remaining Time’ header cell will turn to the alert color.
This feature is only implemented on minutes timeframes and can be switched on or off.
Other points of interest in this script
If you code, this function may also interest you:
sortWithIndexes (arrayToSort) returns a tuple (sortedArray, sortedIndexes) and therefore allows multi-dimensional arrays sorting without actually implementing a sorting algorithm 😉.
Default Settings
The default settings provide an example of commonly used moving averages with associated colors ranked from Hot (more nervous) to Cold (less nervous).
These settings are just an example and are NOT meant to be used as a trading system! DYOR!
Hope it will be useful.
Does the Freeze warning work for you? What do you think of my pseudo sorting algorithm?
Enjoy and please let me know what you think in the comments.

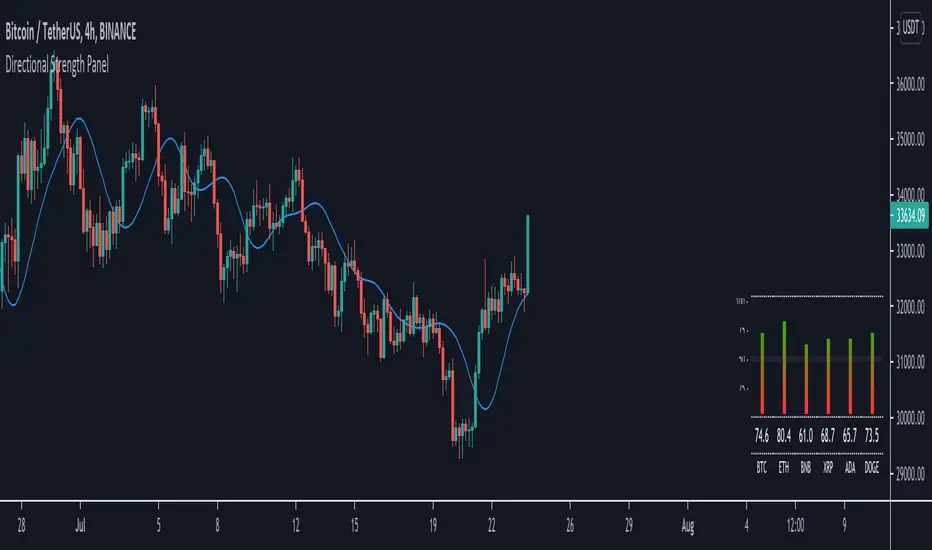
Directional Strength Panel█ OVERVIEW
The panel display trend momentum of selected coins/symbol (up to 6) based on the Arnaud Legoux Moving Average (ALMA). I'm using ALMA to measure the trend because it resolves 2 main issue of the more common moving averages, smoothing and responsiveness. By removing the minor fluctuations in price without sacrificing the responsiveness, the trend become much more clearer and easier to be measured.
In essence, as the meter approaches 100, it means the ALMA is pointing up (0 means pointing down)
█ Features
- Adjustable ALMA settings with options to turn on/off display the ALMA on current chart
- Select 6 symbols of your choice to be monitored in the settings (You have to manually update the label to display)
- Working on all timeframes
- Switch the panel color to suit background chart theme (Light/Dark)
█ Developer Notes
I'm working with table a lot lately and decided to publish this as a sample if anyone wishes to edit the script to display whatever they want. main calculation in get_data() function should be clamped to value between 0-100. As for the panel size, you can edit the row_max (currently set to 20 and 40) if you need it to be smaller or bigger (**i feel anything smaller than 16 is ugly)
█ Disclaimer
Past performance is not an indicator of future results.
My opinions and research are my own and do not constitute financial advice in any way whatsoever.
Nothing published by me constitutes an investment recommendation, nor should any data or Content published by me be relied upon for any investment/trading activities.
I strongly recommends that you perform your own independent research and/or speak with a qualified investment professional before making any financial decisions.
Any ideas to further improve this indicator are welcome :)
Filters MonitorThis script provides the directional bias based on common filters as labelled. As these filters are optimized with some of my custom functions so the code cannot be set public, I hope that you understand, and I believe that it will still bring values to you. Overall, the dots will track the price very closely.
Usage:
- If the majority of the dots are in green, bullish bias should be established. The opposite is true for red color
- If you find a mix of colors, it is good practice that you be patient not to enter the trade
- I recommend that you use this script as a confirmation to your strategy, and not take the signal blindly. Though I try to make it track the price closely, some lagging in inevitable.
Extra filters that give good directional bias may be added along the way.
May you be on the right side of the trade.
MTF Price/Volume % [Anan]Hello friends,
This is a multi-timeframe table with these features:
Display price change percentage compared with the last timeframe candle close.
Display price change percentage compared with the last timeframe candle close MA.
Displays change percentage compared with the last timeframe candle volume.
Displays change percentage compared with the last timeframe candle volume MA.
Change type/length of MA for Price/Volume.
Full control of Panel position and size.
Full control of displaying any row or column.

Tickers PanelCONCEPT
It's a very straight forward panel with tickers for both BTC and ETH (you can switch in the settings).
The background colouring changes based on how individual markets are trading compared to a market average.
It shows green if a market is trading above the average price and it shows grey if it's trading below the average.
This makes it easy to spot which markets are cheap/expensive.
This is jus a random idea, but the source code is open so that you can make your own changes if you like.
FEATURES
Tickers for six different markets.
By default it shows BTC prices, but you can also choose for it to show ETH prices.
Sometimes it gets blocked by price.
So there's an option to put it at the bottom of the screen.
There's more possible, just look at the source code.
I use a widescreen so for me the size of the boxes is perfect, but if you're on different resolution it might look weird.
Also if you split your screen in half for example it probably won't perfectly fit anymore.
In the settings you can easily change the colours, width, height, border thickness, ...
So yeah, just a fun panel with some crypto tickers.
Have a look at the source code it's pretty easy to understand, have fun playing around with it.
The indicator is free so just add it to your favourites and you can start using it (you might have to refresh Tradingview before it works).
Cheers.

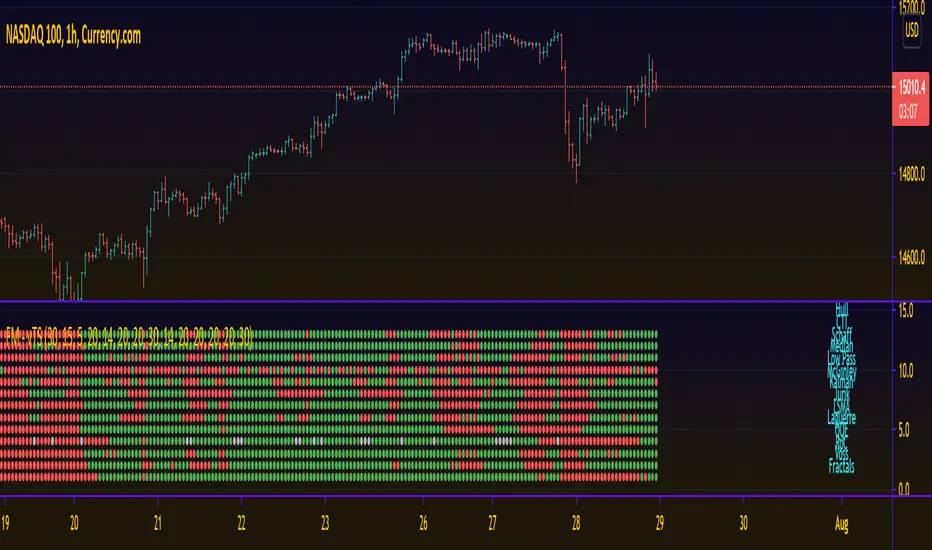
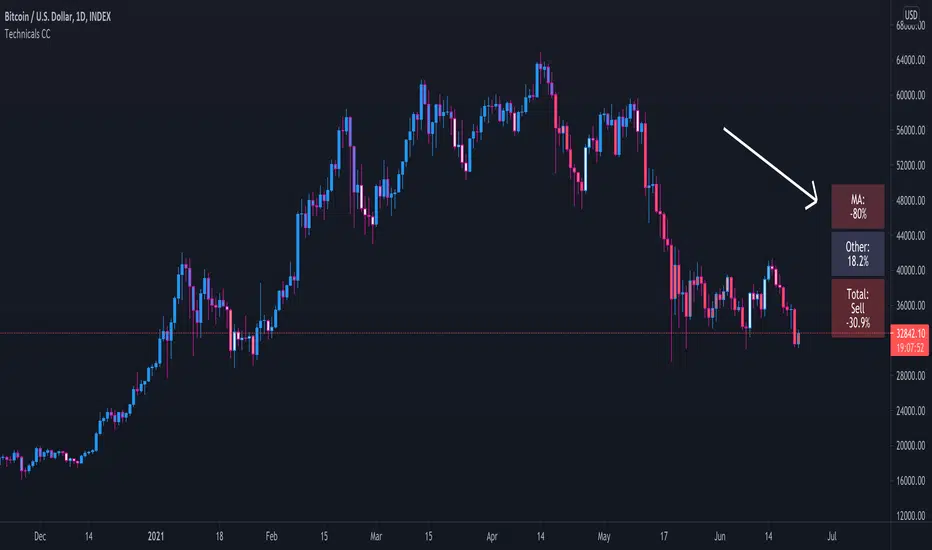
Technical Ratings Colored CandlesFor those that want technical ratings but don't want waste valuable screen real estate. Candles are colored to the rating strength. It also plots the results for "total", "MA" and "other" in a table on right of screen. Table and candle coloring can be turned off in style settings. This script uses the built in Technical Ratings indicator. For more informations on Technical Ratings please refer to official documentation.
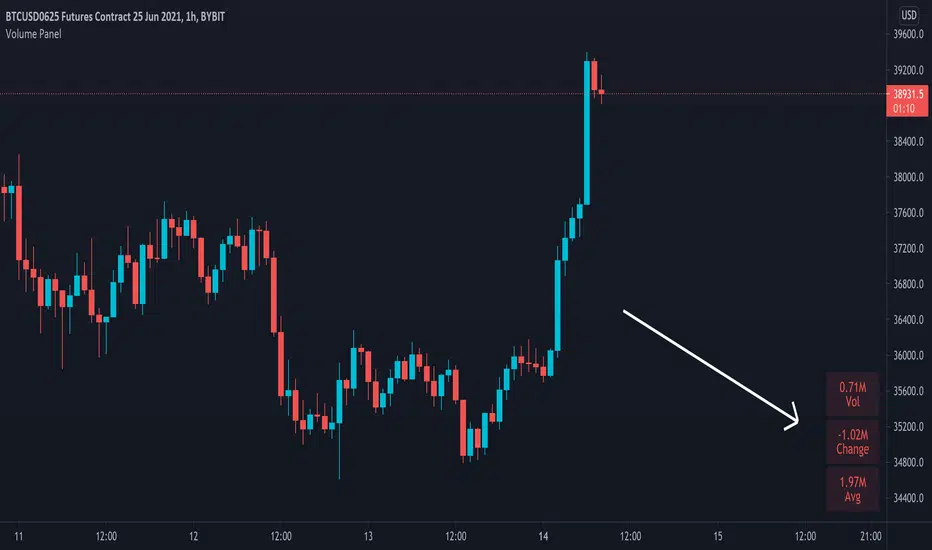
Volume PanelDisplays volume data in panel on bottom right of screen. Shows current bar, change from last bar and average of last 20 bars. This number can be changed in settings if you wish to have the average calculated on a different amount of bars.

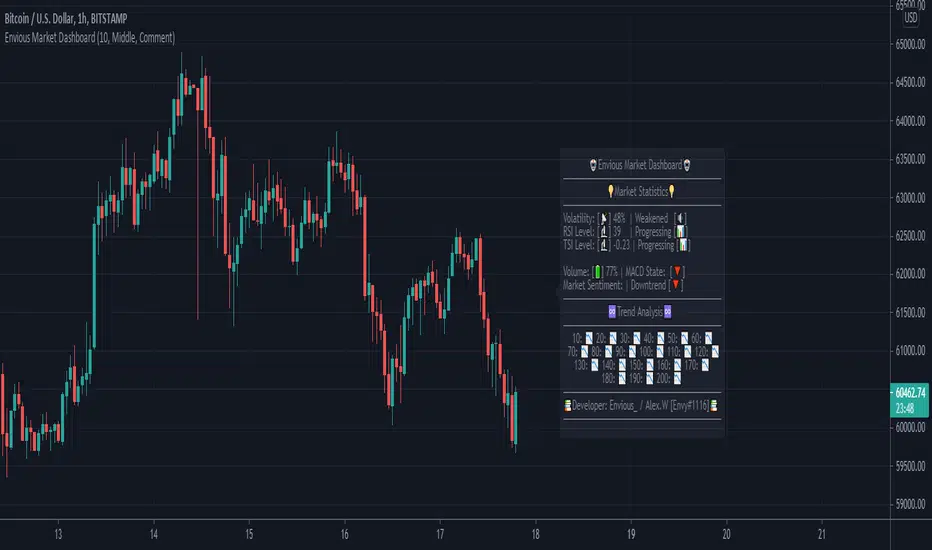
Envious Market DashboardHey traders, this is a market dashboard that can be useful to have on top of your charts. It provides information of the trends discovered, the volatility, the current MACD Trend, the current trend, RSI level, RSI Overbought / Oversold state, TSI level, TSI Overbought / Oversold state, the volume percentage, and more. You can customise the dashboard location, the colour of the dashboard, the background of the dashboard and its background colour. Hope this is useful to you traders :).
[Zekis]ScreenerA simple screener that scan thru multiple pairs for a setup.
The screener have as example an EMA 50 cross, so you have to change it with your indicator/strategy.
You can use a maximum of 40 security() function, right now there are 20, so you can have a total of 40 pairs.

Supertrend Screener PanelScript to display Supertrend trend state of 8 different securities in a panel. Timeframe & Tickers which are to be displayed can be configured from settings.
Part of code is from the ADX DI Monitoring Panel script by u/wugamlo with his permission. Thanks to him for that and do please check out his work also.

SMA Directional Matrix [LuxAlgo]This script was created in collaboration with alexgrover and displays a simple & elegant panel showing the direction of simple moving averages with periods in a user-selected range (Min, Max). The displayed number in the panel is the period of a simple moving average and the symbol situated at the right of it is associated with the direction this moving average is taking.
Settings
Min: Minimum period of the moving average
Max: Maximum period of the moving average
Src: Source input of the moving averages
Number Of Columns: Number of columns to be displayed in the panel, handy when using a large range of periods.
Usage
Looking at the direction of moving averages with different periods is extremely useful when it comes to having information about the short/mid/long term overall market sentiment, and can also tell us if the market is trending or ranging.
Here we use periods ranging from 25 to 50, we can see that shorter moving averages react to the recent upward price variation, longer-term moving averages however are still affected by the overall downward variation you can see on the image. We can as such get information about the presence of potentials divergences, with shorter-term moving averages reacting to the divergence while the longer-term moving averages will still display the direction of the main trend.
As such the indicator can give information about how clean a trend is, with a clean trend being defined as a variation containing no retracements. When our trend contains no retracement, the mid/long term moving averages will all have the same direction, however, when a retracement is present, the midterm moving averages might be affected by it, thus displaying a direction contrary to the main trend.
When the market is ranging we can expect the panel to display an equal number of decreasing/increasing moving averages.
Possible Issues
When using a large range of periods, you might have an error message showing: "String is too long", try lowering the range of periods by increasing Min or decreasing Max .
If the script displays the error message "Loop is too long to execute", try resetting the settings and change them back to the one you wanted to use.
