RSI DINGUE - 3³ DivergenceThis is the updated version for PineScript V5
3x RSI indicator into 1. You can turn on or off all of them.
Each RSI has 2 individual Moving Averages that can also be changed to be "Full RSI" in the settings.
This makes 3x3 = 9 indicators on screen at the same time. (you can turn them on or off)
It has Bullish and Bearish divergence and hidden divergence as well.
Several visual options to show crosses between RSIs and or MAs fill in colors, background colors, midline. Overbought and Oversold levels with signals when entry and exit.
---------------------
In closing, no indicator can give perfect signals, you need to use them in conjunction with other information to make better decisions.
I hope you like my indicators and that they help your trading.
If you have any questions please ask.
Thank you.
Rsi_overbought

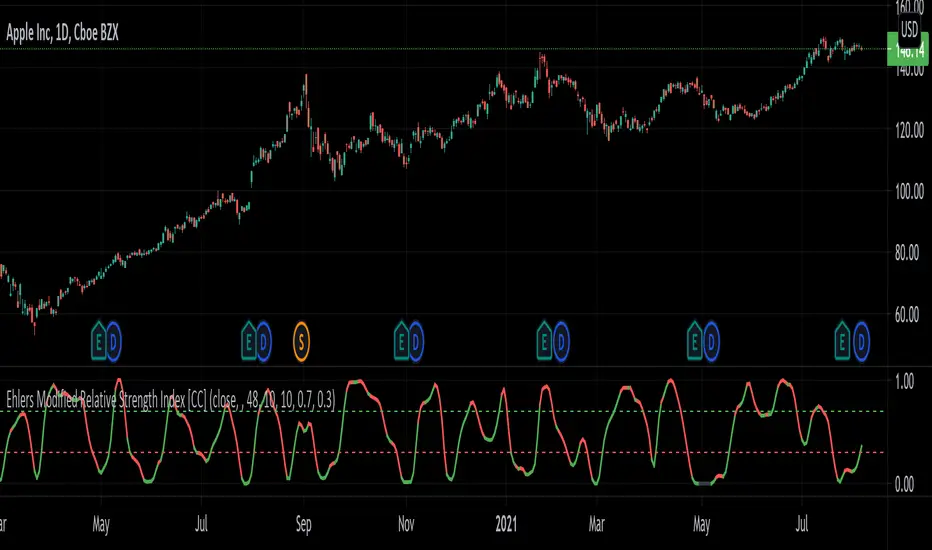
Ehlers Modified Relative Strength Index [CC]The Modified Relative Strength Index was created by John Ehlers (Cycle Analytics For Traders pgs 87-88) and this is a typical RSI that uses his roofing filter as the input. He smooths it with his own super smoother filter to provide signals. This indicator is extremely reactive and works in cycles so keep that in mind. I haven't been able to come up with clear buy and sell signals at this point so let me know if you any suggestions but I'm publishing the code to complete my goal of publishing all of his work one day. I will be publishing a bunch of Ehlers scripts in the next few weeks so stay tuned. What I recommend for buy and sell signals at this point are to buy when the indicator goes below the oversold line and starts going up and sell when the indicator goes below the oversold line a second time. Vice versa for sell signals.
Let me know if there are any other scripts you would like to see me publish!
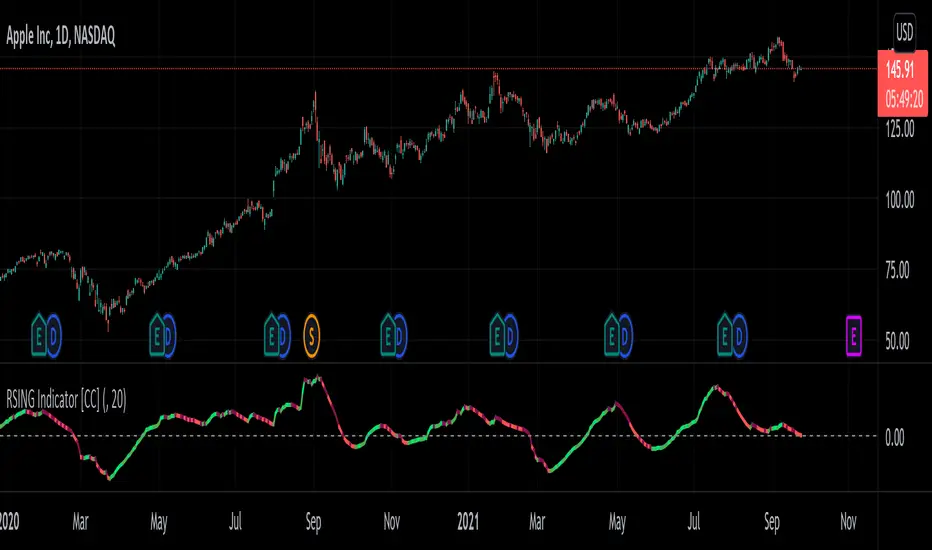
RSING Indicator [CC]The RSING indicator was created by Alon Horesh (Stocks & Commodities March 2021 pg 11) and this aims to be a better version of rsi that adapts to volume as well as a focus on overall strength. This is trying to fix the issues with the traditional RSI with a lack of volume and the issue where you could have the indicator stay in overbought or oversold territory but the upward or downward momentum continues. This indicator takes ratios of the current volume to it's moving average, the overall momentum of the stock, and the current range in comparison to the std deviation of it's past range and multiplies them all together to create this new indicator. I smooth it with a moving average for easier to read buy and sell signals. I have included strong buy and sell signals as darker colors and normal buy and sell signals as lighter colors. Buy when the line turns green and sell when it turns red.
Let me know if there are any other indicators you would like to see me publish!
Inverse Fisher Transform on RSI for backtest w/alertsThis version of the Inverse Fisher Transform on RSI comes with support for
1) Backtesting with Gavin's backtest script
2) Bypass, you can use another indicator to pause buy signals from this indicator. Just create another indicator that plots "1" whenever you want to activate the bypass on the IFTRSI signal.
3) Independent buy and sell level thresholds. Some tokens perform better with a higher sell level, even levels as high as 0.996, sometimes the buy level can also be relaxed to even 0.6 and get incredible results on the 5 minute chart.
4) alerts for Buy and Sell signals
Make sure you add Gavin's backtest and select external signal and this indicator as the source.

CCI/MFI/VZO/RSI - HEATMAPHeatmap I made/reverse engineered.
Currently tracks the 4 following oscillators:
- CCI (Channel Commodity Index)
- MFI (Money Flow Index)
- VZO (Volume Zone Oscillator)
- RSI (Relative Strength Index)
Any feedback or suggestions highly appreciated.
/* Inspiration taken from @ByzantineGeneral (TradingView profile: /u/ByzantineGeneral, indicator: /script/keAGdnWO-Byzantium-Oscillator-Heatmap) */

S73 Colored RSIS73 Colored RSI
Color change is based on above or below 50 mid line.
When RSI is red (below 50), I like to look for shorts, and when RSI is green (above 50), I like to look for longs.
Added extra bands for 10, 20, 80, and 90, so you can easily spot way oversold and way overbought conditions.
I look at taking profit in the overbought, oversold zones.
Hope you like it.
BTC tips - bc1q5eyfentq9mvxmnceh605yd8fted5se5rcta9j7
LTC tips - LXhWhvN86wbLNvacaZpEzhVEcefyMDPtcQ

Stochastic RSI+Applies signal values to significant changes in momentum and can be used in conjunction with other indicators and analysis to improve trade timing.
Both "Signal Up" and "Signal Down" can be used for alerts.
The magnitude of the signal is the difference between K and D.
(See the code for the logic and implementation.)
Signal Up occurs when momentum is within the band and moving upward.
Signal Down occurs when momentum is within the band and moving downward.
Interpretation Note:
The Stochastic RSI is known for false signals, so it should never be used as a pure buy or sell signal. It is useful as a warning or to help with trade timing.
A good example of this is: If you are bullish on a stock, and the signal is negative (signal down), then it may be wise to not buy until the recent change in momentum has dissipated.

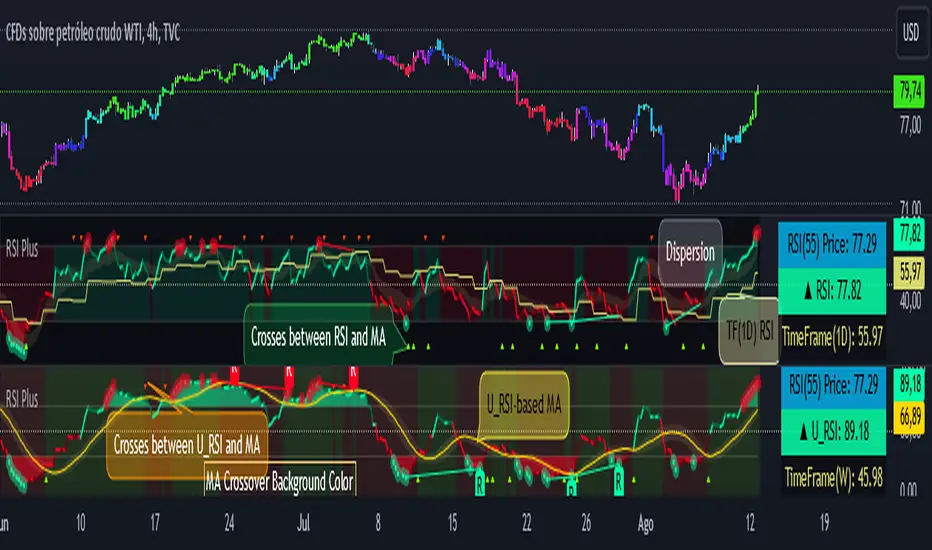
RSI PlusRSI Plus:
☑️ Show the divergences.
☑️ Shows the approximate price of an RSI level (by default it is level 55 but it can be changed for any other level).
☑️ Shows the bulls and bears zones, in green when crossing level 50 up and red when crossing down.
☑️ Circle the highest and lowest levels as possible purchases and sales.
☑️ Includes a smoothed RSI.
RSI Plus:
☑️ Muestra las divergencias.
☑️ Muestra el precio aproximado de un nivel del RSI (por defecto viene el nivel 55 pero se lo puede cambiar por cualquier otro nivel).
☑️ Muestra la zonas de toros y osos, en verde cuando cruza hacia arriba el nivel 50 y rojo cuando cruza hacia abajo.
☑️ Marca con un circulo los niveles mas alto y mas bajos como posibles compras y ventas.
☑️ Incluye un RSI suavizado.
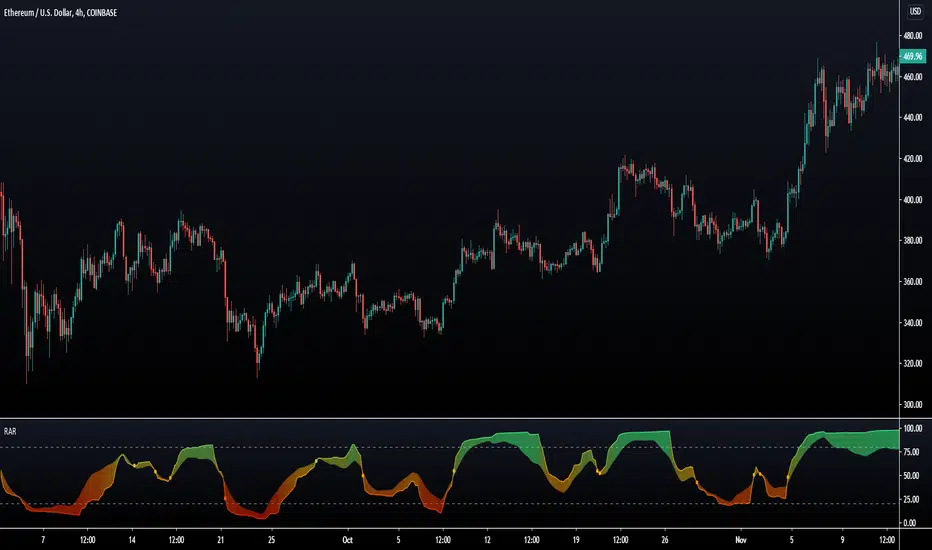
Rainbow Adaptive RSI [LuxAlgo]The following oscillator uses an adaptive moving average as an input for another RSI oscillator and aims to provide a way to minimize the impact of retracements over the oscillator output without introducing significant lag.
An additional trigger line is present in order to provide entry points from the crosses between the oscillator and the trigger line. More details are given below.
Settings
Length : period of the oscillator
Power : controls the sensitivity of the oscillator to retracements, with higher values minimizing the sensitivity to retracements.
Src : source input of the indicator
The indicator also includes the following graphical settings:
Gradient : Determines the color mode to use for the gradient, options include "Red To Green", "Red To Blue" and "None", with "None" displaying no gradient.
Color fill : Determines whether to fill the area between the oscillator and the trigger line or not, by default "On".
Circles : Determines whether to show circles highlighting the crosses between the oscillator and the trigger line.
Usage
The indicator can be used like any normalized oscillator, but unlike a classical RSI, it does not converge toward 50 with higher length values. This is caused by the RSI using a smooth input.
The power setting will minimize the impact of certain variations on the oscillator:
Here the oscillator at the bottom uses a power value of 1.5.
The trigger line is a smoothed RSI using an EMA as input, and it won't remain as near to 100 and 0 as the main oscillator. Using a moving average of the main oscillator as a trigger line would create faster crosses, but this approach allows us to have no crosses when a retracement is present.
Details
As previously discussed the main oscillator uses an adaptive moving average as input; this adaptive moving average is computed using a smoothing factor derived from an RSI oscillator, a similar adaptive moving average known as ARSI, but unlike ARSI which uses a classical RSI of the closing price for the calculation of the smoothing factor, our smoothing factor makes use of RSI on the adaptive moving average error, which provides a higher level of adaptiveness.
RSI_OverValue with Engulfing candleThis script detects potential trend reverse and Buy or Sell spots.
It works with finding overvalued RSI and Engulfing candle after that and plotting "Buy" or "Sell" signal on price chart.
* Users can change RSI values easily from setting.
Enjoy

VWAP Relative Strength Index [CC]This is a custom indicator of mine that uses the volume weighted average price instead of the close price as the source for calculations of the relative strength index. Buy when the indicator line is green and sell when it is red.
This was a custom request so let me know if there are any other scripts you would like to see me do or if you want something custom done!

Double Smoothed Relative Strength IndexThe Double Smoothed RSI Indicator was created by William Blau (Stocks & Commodities V. 9:5 (202-205)) and is a variation of the classic RSI using his Momenta Indicator and his Momenta RSI formula. I have color coded everything to make it very easy to determine buy and sell signals.
Let me know if you would like to see me write scripts for other indicators!

Momenta Relative Strength IndexThe Momenta RSI Indicator was created by William Blau (Stocks & Commodities V. 9:5 (202-205)) and is a variation of the classic RSI using his Momenta Indicator formula. I have color coded everything to make it very easy to determine buy and sell signals.
Let me know if you would like to see me write scripts for other indicators!

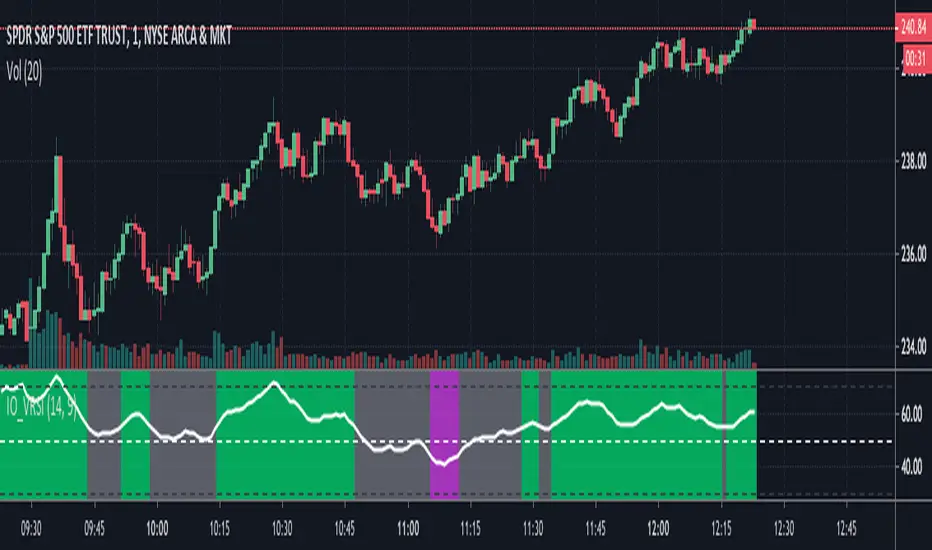
IO_VRSIOriginal Idea by Invsto
In this indicator, I explore the core concepts of RSI and extend it with smoothening to determine volatility.
Usage:
LIME/GREEN : High Volatility and BULLISH trend
RED/FUCHSIA : High Volatility and BEARISH trend
GRAY: Low volatility/Potential Chop Zone
Relative Strength Index with Highlights and Success TestThis script does two things:
1- Highlights extreme levels on RSI
2- Calculates what % of the time, price closed higher (lower) with some minimum threshold when RSI was below oversold (overbought) level in a predefined number of bars.
I use this to understand if buying the dip/selling the rip works for a security and on what time frame and if it could be a profitable strategy that can generate large enough moves.
No guarantees on the accuracy of the code. Let me know if you see anything wrong
Relative Strength Index with HighlightsThis script highlights the indicator background when the RSI exceeds oversold and overbought thresholds making it easier to spot them.
Good for strategies that rely on extreme RSI readings

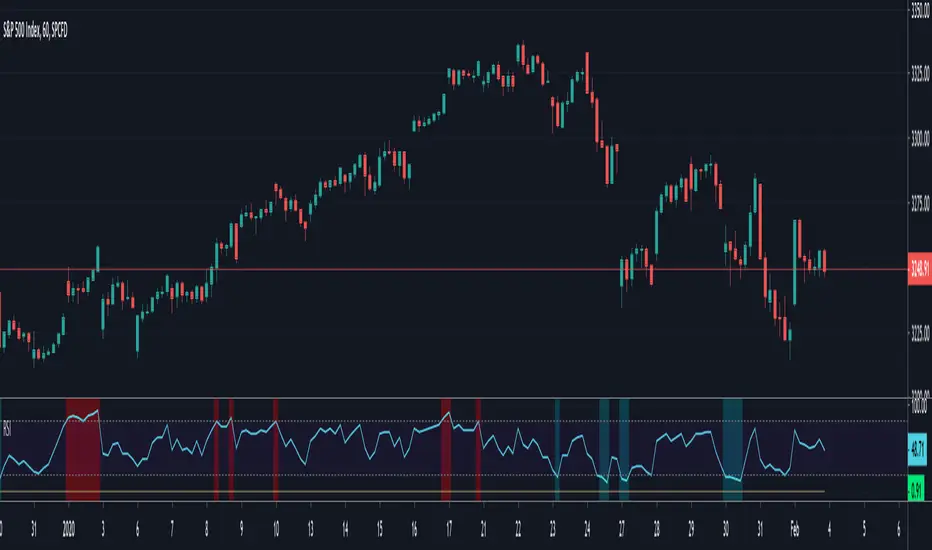
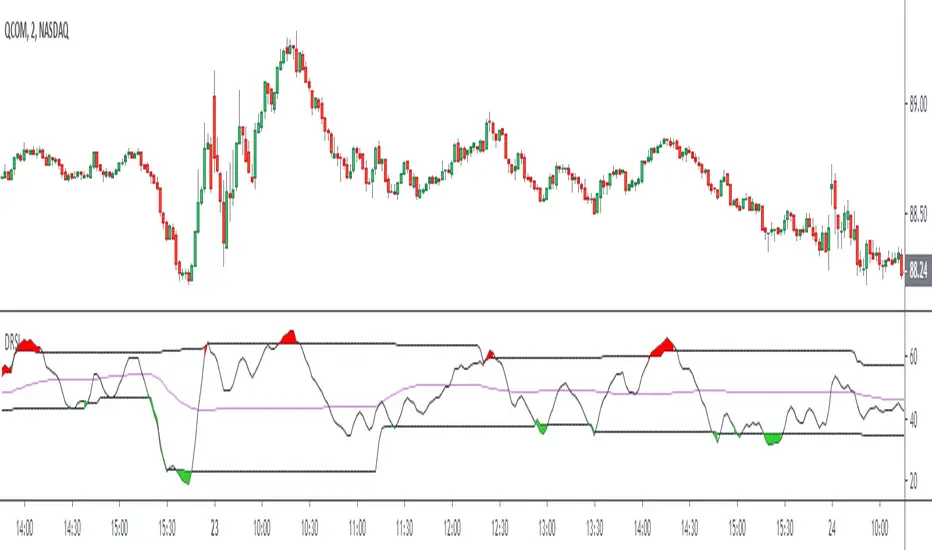
Dynamic RSIThe Dynamic RSI indicator is a kind of exponential RSI. The overbought and oversold levels (respectively HiLine and LoLine) are calculated according to the recent highest and lowest values of the Dynamic RSI line.
RSI with Moving Averages[UO]This RSI indicator is one of my favorite indicators. This powerful indicator is implemented by Phi-Deltalytics. I modified the drawing so that it is easier (at least for me) to see the signals and trends (it would not matter if you're doing algorithmic trading).
Trends and signals. For detailed instructions and tutorial see Phi-Deltalytics page

Fibonacci RSI Ribbon (UO)All levels and RSIs are calculated using Fib numbers. RSI hitting a Fib level is more useful than just hitting 70 or 30

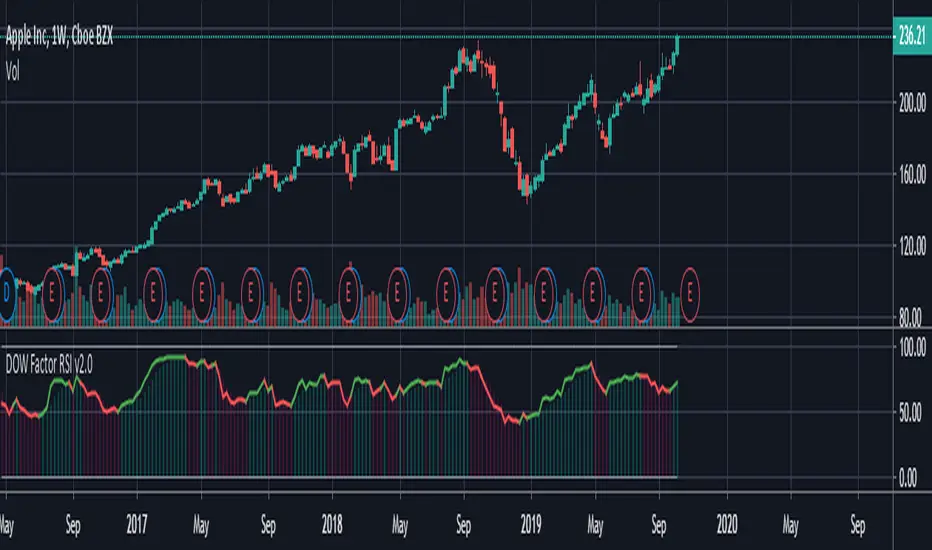
Dow Factor Relative Strength IndexThis script was written to create a new, rapid relative strength index inspired by the Dow Theory.
More info about Dow Theory : www.investopedia.com
According to the Dow Theory, volume should confirm market trends.
The correlation coefficient between prices and volume is negative in weakening trends and negative trends , positive in strengthening or positive trends.a factor was formed based on the correlation coefficient between volume and prices.
This factor was added to the relative strength index.
Period 5 is selected because the volume is very volatile and can be slow.
You can use the period you want, but I recommend the period as a minimum of 5.
It is suitable for all instruments and timeframes and thanks to its design, it provides control over gradual buying and selling points.
I haven't fully tested it, it's open to updates. For now, just use it to create ideas.
If I find it necessary,
I'll update after the tests.
If you have suggestions on these issues,
Leave your comments in the comment window.
This code is open source under the MIT license. If you have any improvements or corrections to suggest, please send me a pull request via the github repository github.com
Stay tuned , best regards.
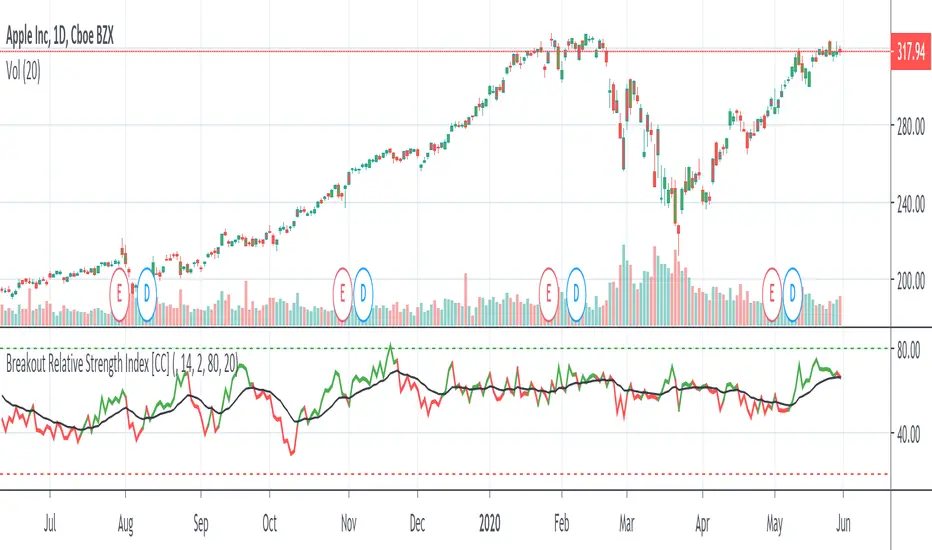
Breakout Relative Strength IndexIt isn't easy to determine if the price of a stock is about to break out. Here’s one way you can determine the relative strength of a breakout, enabling you to act early and realize higher profits.
This indicator was originally developed by Howard Wang Stocks & Commodities V. 33:09 (60–62)
RSI Top & Bottom Warning [aamonkey]An enhancement of my RSI Bottom Indicator.
This one finds you Tops & Bottoms.
This indicator uses the RSI and prints you top & bottom warnings directly on the price chart.
The other special thing about this is that the RSI pulls the data from the weekly chart no matter on what timeframe you are on.
The preferred timeframe can, of course, be changed in the settings as well as any thresholds for tops and bottoms.
The default settings are very good for btc, but be free to try and test this indicator with different settings on different charts.

Parabolic DetectionThis method of trend analysis draws the RSI channel from 50 to 60 on the chart. If it's over 60, the channel is green.
When Bitcoin goes on its insane runs, the RSI on the 3 day chart will often be pegged at extreme values. Our goal is to visually represent these moments.
By default, this uses the 3 day resolution for its calculations. Feel free to disable this and it will work on any timeframe.
