Ichimoku Cloud and Bollinger Bands (by Coinrule)The Ichimoku Cloud is a collection of technical indicators that show support and resistance levels, as well as momentum and trend direction. It does this by taking multiple averages and plotting them on a chart. It also uses these figures to compute a “cloud” that attempts to forecast where the price may find support or resistance in the future.
The Ichimoku Cloud was developed by Goichi Hosoda, a Japanese journalist, and published in the late 1960s. It provides more data points than the standard candlestick chart. While it seems complicated at first glance, those familiar with how to read the charts often find it easy to understand with well-defined trading signals.
The Ichimoku Cloud is composed of five lines or calculations, two of which comprise a cloud where the difference between the two lines is shaded in.
The lines include a nine-period average, a 26-period average, an average of those two averages, a 52-period average, and a lagging closing price line.
The cloud is a key part of the indicator. When the price is below the cloud, the trend is down. When the price is above the cloud, the trend is up.
The above trend signals are strengthened if the cloud is moving in the same direction as the price. For example, during an uptrend, the top of the cloud is moving up, or during a downtrend, the bottom of the cloud is moving down.
The Bollinger Bands are among the most famous and widely used indicators. A Bollinger Band is a technical analysis tool defined by a set of trendlines plotted two standard deviations (positively and negatively) away from a simple moving average ( SMA ) of a security's price, but which can be adjusted to user preferences. They can suggest when an asset is oversold or overbought in the short term, thus providing the best time for buying and selling it.
This strategy combines the Ichimoku Cloud with Bollinger Bands to better enter trades.
Long orders are placed when these basic signals are triggered.
Long Position:
Tenkan-Sen is above the Kijun-Sen
Chikou-Span is above the close of 26 bars ago
Close is above the Kumo Cloud
The closing price is greater than the upper standard deviation of the Bollinger Bands
Short Position:
Tenkan-Sen is below the Kijun-Sen
Chikou-Span is below the close of 26 bars ago
Close is below the Kumo Cloud
The upper standard deviation of the Bollinger Band is greater than the closing price
The script is backtested from 1 January 2022 and provides good returns.
The strategy assumes each order is using 30% of the available coins to make the results more realistic and to simulate you only ran this strategy on 30% of your holdings. A trading fee of 0.1% is also taken into account and is aligned to the base fee applied on Binance.
This script also works well on BTC 30m/1h, ETH 2h, MATIC 2h/30m, AVAX 1h/2h, SOL 45m timeframes
在脚本中搜索"TRENDLINES"

Price Action in action
What?
Price Action in Action is an indicator to help Price Action learners and practitioners to get everything related for Price Action in one place.
Price Action is:
Price + Volume = Action
In this indicator, we have the following features available:
Support/Resistance
Using the RSI with different periods in a multiple of 7 (7, 14, 21, 28), we first determine the overbought (above 70, customizable) and oversold (below 30, customizable) regions. Then we pick up the highest point and lowest point in the RSI values in the overbought and oversold regions, respectively. These are the point, historically supply/demand emerged for surety to push down/up the RSI indicator and the corresponding price. So, these are the most accurate way, we believe, to draw support/resistance (or demand/supply) in the chart. By default, the Support is green color and Resistance is red color. To give a visual representation, we differentiate the different shades of green and red. For example, for Level-1 (i.e. 7 by default) we use the darkest shade (0 transparency) and Level-4 (i.e. 28 by default) we use lighter shade (60 transparency). Note please: you can customize the color of support and resistance lines (say if you want resistance as green and support as red). The respective shades (transparency) will be automatically adjusted accordingly. But those shade (transparency) levels are not customizable, they are fixed (please bear with it for version-1 at least).
Strength of Support/Resistance
In the chart above/below the Resistance / Support lines you can see the tiny labels with some numbers like 1, 2.
We found out how many times a particular support/resistance is appearing across multiple RSI periods. E.g. if price P1 appears 2 times among 4 different RSI periods, the number will be 2 for that calculation, and so on.
There can be multiple presence of these numbers in a support/resistance line (i.e. multiple tiny labels). Something like: 1, 1, 2 (into different candles). This means the same support/resistance is tested so many times in different occasion (means there is a RSI max/min coincides in this level over multiple occasions) at different candles.
This will help you to intuitionally gauge the “strength” of a support/resistance line.
The more the marrier, unworthy to mention.
Candle Stick Patterns
Well: we don’t need to tell anything about the Candlestick. All of you know it better than us. And it’s a time proven, zero-lag mechanism to judge the Price-Action is unfolding in the market. We do not know if there is anything better possible than this time tested patterns to judge the prevailing sentiments of market.
Price-Action does not complete without finding out the Candlestick Patterns correctly.
And in this indicator your will get all of these: Single Candle such as Doji (default off), Marubozu, Spinner, hammers, inverted-hammer etc. ; 2 candles like Tweezer, Inside Candle, Engulfing; 3 candles like morning star/evening star.
In the multi candle patterns (2/3 candles), we are grouping the candles with a dotted rectangle such that it is clear which 2/3 candles are part of the pattern. E.g. Morning Star: 3 candles are grouped in a dotted rectangle and the Morning Star label will come to the latest candle (3rd most – as the pattern is detected reliably only on the completion of the 3rd final candle).
Of course, any program can not eliminate your trained eyes and brain to capture the patterns. But we have provided sufficient knobs to adjust various parameters to tweak the candle-pattern detection. Such as Strict Inside Candle(Harami) Boolean knob where the whole current candle including wicks will be inside the body part of the previous big candle. For non-strict mode, the current candle just inside the previous candle, possibly by wicks.
To make it better usable, for every such knobs (which are not obvious) we have added user-friendly tooltip (just mouse hover the question mark (?) besides the control/switch). There are plenty of it.
Volume
Here we have a rudimentary (yet effective) way to judge the volumes.
We find out the Volume Weighted Moving Average (VMWA) of the 20-period (default, but customizable) and the latest volume. If the latest volume is more than the 20 period vwma, we just add a grey diamond on the top of the candle to denote it’s attracting volumes. Of course, we provide a Weight coefficient (default is set to 1). So if the current bar’s volume on bar’s completion is more than the 20 period volume vmwa times the weigh-cofficient, we mark it with a tiny grey diamond.
Points to be noted:
In all places we mark the indication only on the completion of the bar (technically speaking we have checks, as far as possible, with barstate.isconfirmed). However, if you wish, you can turn it off for Candlestick (as some experts may want to check candlestick on the real time, even before the closing of bars).
In case if you see the chart looks cluttered (because of many information, specially in smaller timeframes like 5 min), there are controls given in the settings to toggle each and every features.
By default, we turn off Doji candles (all 3 types of Doji’s – normal, Gravestone & Dragonfly) as they are mainly indecision. However, you can toggle it to turn it on.
It does not give you any Buy/Sell call. The interpretation it does not have.
Why?
What’s unique in it?
As we already mentioned our intention is to include Price (in forms of Support / Resistance), Volume and Action (sentiments in terms of Candlestick patterns) into a single place. And so far, to the best of our knowledge, we could not come across a single indicator provides all of these.
There were works available to determine the RSI based support / resistance zones. Those are great piece works at that time (lets say 3 years back when PineScript was in earlier versions). To the best of our knowledge those does not cover up finding out the lowest / highest point of RSI and the corresponding price to get the simplistic and distinct support/resistance lines.
We have the intuitive support/resistance strength included which we could not found out in current set of available indicators.
To the best of our knowledge, there seems no indicator can detect 3-candle patterns which are extremely popular to detect trend reversals (such as Morning Star or Evening Star). Moreover for the multi-candle patterns we are grouping the candles part of the pattens (2-candles or 3-candles) using a dotted rectangle such that it’s visually clearly (and a well educative material for Price-Action learners also).
Mentions:
There are many works which inspire us along the way. Honestly: we sometimes forgot which all indicators we experimented with. We are sincerely apologetic in case we forgot to mention. A few note-worthy:
There is an indicator from user “repo32” named as “Candlestick Patterns Identified (updated 3/11/15)”. (We could not be able to contact “repo32”). We are inspired from his work that it’s feasible to detect Candlestick patterns.
There is an awesome work done by “RSI Based Automatic Demand and Supply” by user “shtcoinr”. The idea of consulting multiple RSI levels to find out the demand/supply zone we inspired from him. (We did contact “shtcoinr” and got his kind permission to use the concept.)
We are greatly thankful to these abovementioned wizards for their pioneering a-prior work in this front.
And of course, this TradingView platform to provide this abstraction, facilitates and felicitates collaborative contributions.
Ultimately, what’s for you?
That’s the main question. What’s for you?
Price-action comprises of following 3 tasks (at least):
Draw support/resistance lines in the chart.
Once price reaches at the support/resistance line, you fervently look out the candles’ formation to mentally map to the candle patterns. Your aim is divine: You want to judge if the price-action will continue or take a rejection/reversal.
Then you double-confirm with the volume (in a non-overlaid chart below).
Finally take a trade.
For a price-action newbie or seasoned, expert practitioner, you must be doing all the above tasks regularly and manually, in a mechanical, mundane way. There come the humanly subjectivity & the inevitable emotions . This indicator, being a piece of program/code in PineScript latest version v5 , eliminates (or at least, reduces to a great extend) that subjectivity & emotions out of the way of decision making . Thus resulting better yield.
Of course, you can argue that you draw slanted trend lines also. We recommend an already existing indicator by user LuxAlgo named as “Trendlines with Breaks ”, if you wish so.
Disclaimer:
This piece of software does not come up with any warrantee or any rights of not changing it over the future course of time.
We are not responsible for any trading/investment decision you are taking out of the outcome of this indicator.
Happy trading.

VIX - SKEW DivergenceThe CBOE VIX is a well-known index representing market expectations for volatility over the next 30 days.
The CBOE SKEW is an index reflecting the perceived tail risk over the next 30 days.
When the SKEW rises over a certain level (~140/150), that means investors are hedging their exposure with options, because they are worried about an incoming market crash or a "black swan". If that happens when the VIX is very low and apparently there is no uncertainty, this can warn of a sudden change in direction of the market. You will see for yourself that an increasing divergence often anticipates a sharp fall of leading stock indexes, usually within two to four months.
This is probably not very relevant for the short-term trader but mid/long-term traders and market analysts may find it useful to clearly visualize the extent of the distance between the VIX and the SKEW. For that reason, I wrote this highly customizable script with which you can plot the two indexes and fill the space within them with a color gradient to highlight the maximum and minimum divergence. Additionally, you can fill the beneath VIX area with four different colors. It is also possible to plot the divergence value itself, so if you want you can draw trendlines and support/resistance levels on it.
Please note that the divergence per se doesn't predict anything and it's meant to be used synergistically with other technical analysis tools.
More informations here:
www.cboe.com
www.cboe.com

Bollinger Bands and RSI Short Selling (by Coinrule)The Bollinger Bands are among the most famous and widely used indicators. A Bollinger Band is a technical analysis tool defined by a set of trendlines plotted two standard deviations (positively and negatively) away from a simple moving average ( SMA ) of a security's price, but which can be adjusted to user preferences. They can suggest when an asset is oversold or overbought in the short term, thus provide the best time for buying and selling it.
The relative strength index ( RSI ) is a momentum indicator used in technical analysis . RSI measures the speed and magnitude of a security's recent price changes to evaluate overvalued or undervalued conditions in the price of that security. The RSI can do more than point to overbought and oversold securities. It can also indicate securities that may be primed for a trend reversal or corrective pullback in price. It can signal when to buy and sell. Traditionally, an RSI reading of 70 or above indicates an overbought situation. A reading of 30 or below indicates an oversold condition.
The short order is placed on assets that present strong momentum when it's more likely that it is about to decrease further. The rule strategy places and closes the order when the following conditions are met:
ENTRY
The closing price is greater than the upper standard deviation of the Bollinger Bands
The RSI is less than 70
EXIT
The trade is closed in profit when the RSI is less than 70
Upper standard deviation of the Bollinger Band is greater than the the closing price.
This strategy comes with a stop loss and a take profit, and as you can see by the results, it is well suited for a bear market.
This trade works very well with ETH (1h timeframe), AVA (4h timeframe), and SOL (3h timeframe) and is backtested from the 1 December 2021 to capture how this strategy would perform in a bear market.
To make the results more realistic, the strategy assumes each order to trade 30% of the available capital. A trading fee of 0.1% is taken into account. The fee is aligned to the base fee applied on Binance, which is the largest cryptocurrency exchange.

Dynamic Zone of Bollinger Band Stops Line [Loxx]Dynamic Zone of Bollinger Band Stops Line is a Bollinger Band indicator with Dynamic Zones. This indicator serves as both a trend indicator and a dynamic stop-loss indicator.
What are Bollinger Bands?
A Bollinger Band is a technical analysis tool defined by a set of trendlines plotted two standard deviations (positively and negatively) away from a simple moving average (SMA) of a security's price, but which can be adjusted to user preferences.
Bollinger Bands were developed and copyrighted by famous technical trader John Bollinger, designed to discover opportunities that give investors a higher probability of properly identifying when an asset is oversold or overbought.
What are Dynamic Zones?
As explained in "Stocks & Commodities V15:7 (306-310): Dynamic Zones by Leo Zamansky, Ph .D., and David Stendahl"
Most indicators use a fixed zone for buy and sell signals. Here’ s a concept based on zones that are responsive to past levels of the indicator.
One approach to active investing employs the use of oscillators to exploit tradable market trends. This investing style follows a very simple form of logic: Enter the market only when an oscillator has moved far above or below traditional trading lev- els. However, these oscillator- driven systems lack the ability to evolve with the market because they use fixed buy and sell zones. Traders typically use one set of buy and sell zones for a bull market and substantially different zones for a bear market. And therein lies the problem.
Once traders begin introducing their market opinions into trading equations, by changing the zones, they negate the system’s mechanical nature. The objective is to have a system automatically define its own buy and sell zones and thereby profitably trade in any market — bull or bear. Dynamic zones offer a solution to the problem of fixed buy and sell zones for any oscillator-driven system.
An indicator’s extreme levels can be quantified using statistical methods. These extreme levels are calculated for a certain period and serve as the buy and sell zones for a trading system. The repetition of this statistical process for every value of the indicator creates values that become the dynamic zones. The zones are calculated in such a way that the probability of the indicator value rising above, or falling below, the dynamic zones is equal to a given probability input set by the trader.
To better understand dynamic zones, let's first describe them mathematically and then explain their use. The dynamic zones definition:
Find V such that:
For dynamic zone buy: P{X <= V}=P1
For dynamic zone sell: P{X >= V}=P2
where P1 and P2 are the probabilities set by the trader, X is the value of the indicator for the selected period and V represents the value of the dynamic zone.
The probability input P1 and P2 can be adjusted by the trader to encompass as much or as little data as the trader would like. The smaller the probability, the fewer data values above and below the dynamic zones. This translates into a wider range between the buy and sell zones. If a 10% probability is used for P1 and P2, only those data values that make up the top 10% and bottom 10% for an indicator are used in the construction of the zones. Of the values, 80% will fall between the two extreme levels. Because dynamic zone levels are penetrated so infrequently, when this happens, traders know that the market has truly moved into overbought or oversold territory.
Calculating the Dynamic Zones
The algorithm for the dynamic zones is a series of steps. First, decide the value of the lookback period t. Next, decide the value of the probability Pbuy for buy zone and value of the probability Psell for the sell zone.
For i=1, to the last lookback period, build the distribution f(x) of the price during the lookback period i. Then find the value Vi1 such that the probability of the price less than or equal to Vi1 during the lookback period i is equal to Pbuy. Find the value Vi2 such that the probability of the price greater or equal to Vi2 during the lookback period i is equal to Psell. The sequence of Vi1 for all periods gives the buy zone. The sequence of Vi2 for all periods gives the sell zone.
In the algorithm description, we have: Build the distribution f(x) of the price during the lookback period i. The distribution here is empirical namely, how many times a given value of x appeared during the lookback period. The problem is to find such x that the probability of a price being greater or equal to x will be equal to a probability selected by the user. Probability is the area under the distribution curve. The task is to find such value of x that the area under the distribution curve to the right of x will be equal to the probability selected by the user. That x is the dynamic zone.
Included
Bar coloring
Signals
Alerts
3 types of signal smoothing

Auto Support & Resistance Volume Based + ScannerThis indicator tracks large marker maker orders and draws support & resistance levels based on where those orders came in. It allows you to track what the market makers are doing and place your trades in line with them. Look for the lines to suck up to the price and that will show you where large orders are coming in which is where reversals will happen or trend continuation will happen at an accelerated rate. The fat lines are higher timeframe volume spikes and major volume spikes. Look for bounces off of these fat lines. The fatter the line, the bigger the volume spike. The skinny lines are minor volume spikes over shorter time periods. These can be viewed as short term support and resistance levels and consolidation zones.
***HOW TO USE***
Look for bounces off of the fat lines and place trades accordingly. Those levels are where the market makers placed their orders and you will notice how well price reacts to these levels.
Look for the lines to suck up/down to the price. This shows you where volume is coming in which typically means a reversal is about to happen. If a reversal doesn’t happen, then the trend will continue its original direction, but usually move faster. Wait for these lines to suck up to price before trying to buy the bottoms or sell the tops. If you can have the patience to wait for this to happen, it will keep you out of a lot of choppy price action and give you very good places to take trades that move quickly.
When all the levels suck up to the price and all the colors change to red from green or green from red, it is an indication of market sentiment changing and the trend will likely reverse.
For best results, use this on charts for exchanges that have the highest volume and the most institutional buyers as those will give better levels since there are more market makers on those exchanges. Use exchanges such as NYSE, ARCA and NASDAQ for stocks and use COINBASE, BINANCE, MEXC perpetual futures charts or PEPPERSTONE for crypto.
If price breaks out or down from the group of levels and no lines suck up to the price, then it is a low volume breakout and price usually comes right back to the support and resistance levels so beware when this happens.
If there are no levels near the current price, look at the previous levels in that price range as those are still very relevant areas.
You can also draw trendlines from recent high and low points of the lines where they changed, which works very well for finding tops/bottoms in confluence with the real time s&r levels.
I recommend looking at higher timeframes and drawing horizontal lines where the fat lines are that extend for a long period of time. Then you will have those levels on your lower timeframe charts so you don’t miss any major levels that price will likely bounce off of.
Make sure you spend some time looking back at historical data so you can get a feel for how this indicator reacts to volume spikes before using it.
***HIGHER TIMEFRAMES***
This indicator scans higher timeframes for volume spikes, so make sure you update the higher timeframes used when looking at anything higher than the 1 minute timeframe as that is what the settings are optimized for. You can create new chart layouts for each timeframe you use frequently and save your settings on each chart so that you don’t have to update those settings when you switch timeframes.
***SCANNER***
The table at the bottom of the screen scans 8 other tickers for volume spikes. When a volume spike is detected, the color of that ticker will change from blue to orange to notify you. You can customize which tickers the indicator scans within the indicator settings. Make sure to save your chart layout with your updated tickers so you don’t have to change them frequently. Input all tickers from a certain sector to see how that sector is performing overall which can help give you a good idea of the sector as a whole. Save a different chart layout with each different sector you want to scan so you don’t have to switch the tickers frequently.
***ALERTS***
This indicator is set up with alerts that can be turned on to notify you of volume spikes on the ticker that the chart is set to.
***CUSTOMIZATION***
You can customize the colors of the lines and backgrounds in the indicator style tab. You can also turn off the scanner if you want to within the indicator input tab. The tickers to scan can be customized to suit your preferences within the indicator input tab. The higher timeframes used can also be adjusted within the indicator input tab.
***MARKETS***
This indicator can be used on all markets that have volume data, including stocks, crypto, futures and forex.
***TIMEFRAMES***
This indicator can be used on all timeframes as long as there is enough data for the session used.
***TIPS***
Try using numerous indicators of ours on your chart so you can instantly see the bullish or bearish trend of multiple indicators in real time without having to analyze the data. Some of our favorites are our Trend Friend Signals, Volume Profile with Buy & Sell Pressure, RSI Scalper Ribbon and Auto Support & Resistance with Wick Signals to find those major levels that are not associated with volume spikes in combination with this volume based auto support and resistance indicator.

Pullback Viewer by emkaPullback Viewer is designed to show valid pullback points in a bearish or bullish trend.
What is considered a valid pullback?
A valid pullback needs to have a body close outside the previous candle high (in a bearish trend) or previous candle low (in a bullish trend). If the candle wicks out the previous candle, it's not a valid pullback.
Pullback must liquidate the previous candle with a clean candle body close.
When this indicator is useful?
It's useful to understand and spot potential key levels, where you can expect the reaction of the price.
Examples how you can use valid pullbacks:
Identify supply and demand zones
Spot key levels for support and resistance
Use as anchor points for trendlines
This indicator is a valuable guideline to spot the important swing points in trending market.
Timeframes and symbols
Pullback viewer can be used regardless of the timeframe you are using, or symbol that you are trading.

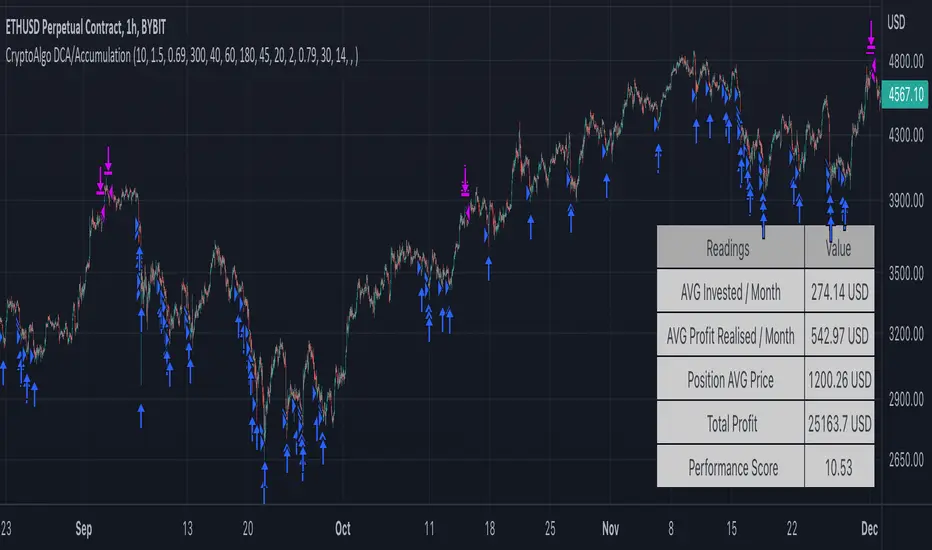
CryptoAlgo DCA / AccumulationThis is a Dollar Cost Average (DCA) / Accumulation strategy. Every time there is a long signal it will buy a fixed USD amount that you have specified in the settings and keep buying at the dips and corrections in the market. This strategy is low-risk, however it assumes you have a long time horizon of at least 2+ years. The longer your holding-period, the better your returns.
There is 3 different entry conditions you can choose from:
The first entry condition is bollinger bands. Bollinger bands is a set of trendlines plotted two standard deviations (positively and negatively) away from a simple moving average (SMA) of an assets price. Every time a candle closes below the lower trendline the strategy will buy.
The second entry condition is the Relative Strength Index (RSI). The RSI is a momentum indicator used in technical analysis that measures the magnitude of recent price changes to evaluate overbought or oversold conditions in the price of a stock or other asset. Every time the RSI is meaning oversold and goes below a point of your choosing the strategy will buy.
The third entry condition is based on pivot points and moving averages that will determine small term trend changes in the market and low price points. Every time there is a bullish trend reversal the strategy will buy.
All three of these entry conditions can be controlled by a higher timeframe RSI that will stop entries when the RSI is above a certain point where the market is overbought and not ideal for accumulation.
The take profits in this strategy is dynamic and will signal trend changes like the third entry condition by using pivot points and moving averages. Since this is a DCA/ Accumulation strategy and will accumulate for the long term it will only exit a small percentage of the accumulated position. This will ensure that you take profit as the asset is appreciating in price while keeping the majority of the position for greater profit in the future.
At the bottom right corner of the chart you will be able to see the key results of the DCA
The first reading is the Average amount USD that the strategy is investing on average every month. This value will help you identify the best settings for you and what USD amount the strategy should enter at the signals so that it stays below the amount you are willing to invest every month. Keep in mind that this is an average and that there will be a lot of deviation up or down based on where the market is going. If the market is having a correction the strategy will signal a lot more entries than when it is going up.
The second reading is the average profit per month. This is also an average and the result will go up exponentially from the starting point as the strategy accumulates and the market appreciates in price.
The third reading is the position average price. This is the average price all the accumulated USD in the asset.
The fourth reading is the total profit. This is the result of both the realised profit from taking profit and the accumulated usd amount left in the position.
The last reading is the performance score. This is a scoring system that i created that looks at the data from the readings and weighs it based on importance and then spits out a number that will help identify the best settings. The higher the number the better the performance, meaning more profit and better DCA.
When you have found the right settings you can insert the messages from your automatic trading platform at the bottom of the inputs and then create an alert with your unique webhook address along with the alert message below:
{{strategy.order.alert_message}}
You will be able to adjust all parameters in the settings.
Enjoy!
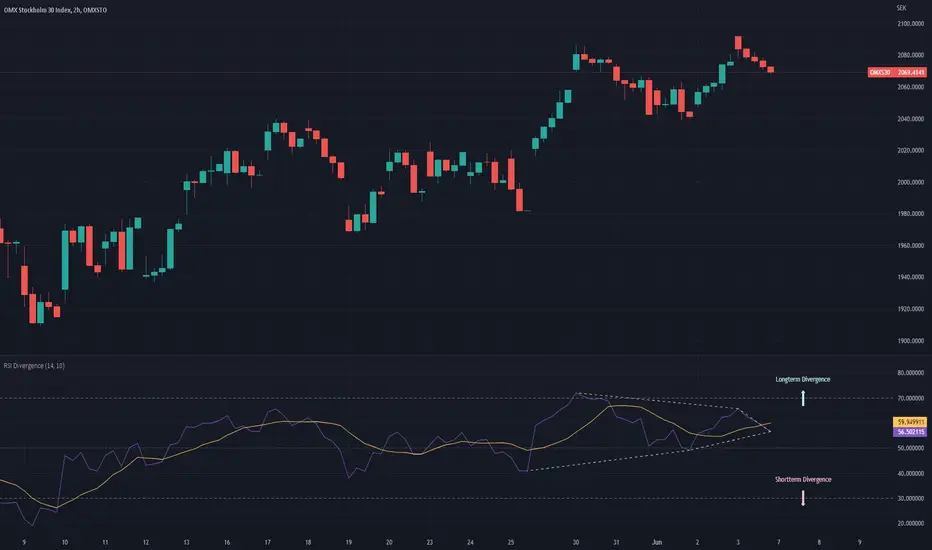
RSI DivergenceThe RSI DIvergence script tries to predict the upper and lower trend-lines for the current security’s RSI.
The script identifies peaks and valleys within the RSI and then tries to draw a trend-line in between the peaks and the valleys. The longest possible trend-line originating from the latest peak/valley will be used to determine whether or not the trend is moving up or down, the slope of the trend-line will then dictate the direction of the trend.
(If no trend line can be drawn from the latest peak/valley, the current value of the RSI will be used as the origin point of the trend-line)
Once the script has identified the trendlines they will be superimposed on the RSI line as dashed lines. The color of the dashed lines will depend on the direction of the trend, an upwards moving trend will be depicted in green,whilst a downwards moving trend will be depicted in red.
Furthermore, the script will draw two arrows, representing the short term trend and the long term trend, as to make it even more clear which direction the two trend-lines have.
If only one trend-line (either upper or lower) can be found, the script will replace the corresponding arrow with a diamond shape instead.
Price Action All In One IndicatorIf you are the one who is "Price Action" style & does not want to use many indicators or complex indicators or you are an ICT (The Inner Circle Trader)
student or ICT charter, this simple beautiful All In One Indicator is right for you.
The indicator has the following functions.
TIME ZONE SETTING
The default timezone is New York Time GMT-4, if you leave the time zone setting blank, it will use the symbol timezone. Note that the trading time changes with one hour delay in winter. so if you just trade forex, and leave the time zone setting blank, TradingView will adjust the symbol timezone automatically for you or don't forget to change the timezone setting GMT-4 or GMT-5 depending on daylight saving time.
STATISTIC PANEL
You can choose which panel to show through settings.
Session Info Panel : pips info of ADR, Asian, London, and New York sessions.
Trend Panel : showing trend (up/down) of
5m/15m/1h/4h/D/W time frames (TF)
4MA (default values: SMA with lengths: 20–50–100–200)
Money Management Panel : in trading, money management is very important. Just put the % risk, & stop loss value below, the indicator will calculate a suitable size/amount for each trade.
Size by Lots: input stop loss in pips
Size by Units: input stop loss in % (of price)
(*)Units size is calculated by % stop loss & current bar close price. You have to determine a stop-loss price to convert to % stop loss by yourself.
TIME SEPARATORS
We can choose which time separators we want to display. The indicator has 5 options: Anchor Time/Day/Week/Month/Quarter. Of course, we can choose to show just one or all 5 of them.
With Anchor Time you can choose which time you want to draw a vertical line for better timing analysis. This can show up to 2 Anchor Time lines. The default values are 00:00 (New York Midnight Opening) and 08:30 (New York Session Opening). You also have an option to show the past lines or not.
About Day Separator, cause TradingView has supported Session Breaks in Setting but if you don't like to use it or when enabling, it distracts you, you can use mine. My favorite trading dates are Tuesday & Wednesday.
PRICE LEVELS
For intraday trading, the high/low/close of the previous day, the previous week, ADR (default period is 5) are very important key levels. You can choose which one you like to show for better analysis. Of course, you can change the color & style of the lines. This is also my favorite indicator.
This indicator also has an option to show up to 2 price lines at a specific time, you can choose the price type (high/low/close/open) that you want to display. The default time values are:
Specific Time 1: 0:00. (New York Midnight Opening Price)
Specific Time 2: 8:30 am. (New York Session Opening Price)
ACCUMULATION ZONE
The market tends to reprice the higher/lower to the old high/low or imbalance/fair value price to promote buy/sell stops or to provide smart money pricing for long/short entries. Typically, it redistributes quickly and you must learn to anticipate them at key levels intraday. Weak short/long holders will be squeezed in the retracement.
Except for the open price, the price changes continuously until the closing time, so the accumulation area can also be changed in real-time, but if you combine it with other information when analyzing, you can predict/determine whether the zone has been established or not with high probability. In short, price needs time to be accumulated, I usually don't pay attention to this daily zone till London open/close or New York sessions
Not only daily zone, but the indicator also supports higher timeframes accumulation zone from
SESSION & STD
There are 3 sessions: Asian, London, New York. The default values are below (New York Time).
Asian: 19:00 ~ 00:00
London Open (London KillZone): 01:00 ~ 05:00
New York Open (New York KillZone): 07:00 ~ 10:00
If you do not want to show the label, just leave the label values blank or change them to whatever you want.
This is one of my favorite functions. I use it on 15m, 30m, 1h TF for Forex intraday trading. My favorite trading sessions are London Open & New York Open.
You also can choose to show or not Standard Deviations (STD). The default values are set for Asian Range STD and max STD levels can be shown are 5. I use the following 3 types of STD (New York Time):
CBDR (Central Bank Deviations) STD: 14:00 ~ 20:00
Flout STD: 15:00 ~00:00
Asian Range STD: 19:00 ~ 00:00
LOOKBACK HIGH/LOW/MID
Can show high/low/mid of the data ranges on the daily/4h chart. The default values are:
- 20–40–60 days back from today for daily TF.
- 30–60–90 bars back from the latest bar for 4h TF.
The default anchor bar for calculating the lookback is the latest one but with:
- 4h TF: we can change the lookback from the 1st day of the week.
- Daily TF: we can change the lookback from the 1st day of the month.
The indicator also has options showing the high/low/mid (equilibrium level) lines for better analysis. Especially, on daily TF, we have the option that can show up to 4 lines (25% for each one) of the data range.
Of course, you can change the colors or the style of the high/low/mid lines.
The lookback can be shown on the lower TFs for better detection when the market structure is shifted.
MAGIC BARS
Fractal bar : The bar's color is changed when the divergence occurs between the price & RSI. You can change the RSI period (default value is 14) & RSI source. (open/high/low/close,…)
Imbalance bar or liquidity void or fair value gap - whatever you call it. This is my favorite indicator when trading on all TFs.You can choose to extend the last n imbalance bars if you like in the settings. I make sure I covered all cases of imbalance/fair value gap.
OLD HIGH/LOW
First, this function is not used as the common Support & Resistance that retail traders usually use, so I call it Old High/Low. I usually use it in 2 ways:
Detect the next buy/sell stops that Market Makers aim to manipulate.
Detect whether market structure shifted or not (Break of structure)
In settings you can:
Set the period to detect high/low levels, the default value is 10. My other favorite values are 6 & 2.
On a lower time frame, you might want to set it to a large number to remove noise.
On a higher time frame, a small number is enough, I think.
Choose the numbers of the last lines you want to show on your chart.
Of course, the style of lines can be changed easily.
TRENDLINES
A very simple trendline with default pivot left strength is 10.
By default, trendline uses high/low price but you have the "Using close price" option.
LINEAR REGRESSION CHANNEL
The Linear Regression Channel is a three-line technical indicator used to analyze the upper and lower limits of an existing trend. It is a statistical tool used to predict the future from past data and is used to determine trend direction or when prices may be overextended.
You can choose
To fill the background or not
To show inner/outer lines or not
To change the colors/line styles of upper zone, lower zone, upper lines, lower lines, midline
DIRECTION BOX
Working on all TFs, this looks like the same with lookback function but if you would like to display them in a box for easily focusing/comparing with other symbols or for detecting divergence in a specific period. The indicator also has a setting to show or hide lines connecting between lows or highs.
Another example of how I use High/Low connecting lines to detect divergence between S&P 500 and NASDAQ 100.
ZIG ZAG
Can show up to 2 ZigZag lines.
This is suitable for traders who have difficulty in detecting key levels (recent high/low) of the prices to confirm market structure or just for drawing Fibonacci easily at those levels.
MA (Moving Average)
I believe that this is one of the most used indicators for every trader. There are 5 types of MA to choose from: EMA, SMA, WMA, VWMA, SMMA(RMA).
This can show up to 4 MAs. You can choose the source (close/high/low,…) for each one. My favorite values are 34 & 89 EMA.
This indicator also supports MA Bands. You can select which MA you want to display the bands, and the "width" of the bands can be changed via the settings.
WATERMARK
It's just a simple function but I think it's very useful for those who want to add Copyright info to the chart, to prevent others from copying it.
Others/known issues/limitations
In forex or stock (things that are traded only on weekdays), TradingView's does not include the latest bars till Monday so the Day Separator cannot fill that space. Because TradingView deals with those bars as Sunday's ones so I set the color of Sunday the same as Friday for good UI/UX. On Crypto charts, the indicator shows without problems.
If you see "Internal server study error", please try closing the current TradingView tab in your browser and reopening it in a new tab. The error will disappear.
Because TradingView does not provide any detailed error information when such "general error" occurs. It's very difficult to detect which function is causing this error or is there something that caused TradingView "overloaded" through a long time running/loading on that tab? Honestly, I don't know exactly the cause, but in my experience, this error often occurs in the following cases:
When you have the TradingView Tab open for hours. In my case, I usually leave TradingView tab open overnight & when I come back the next day, this error might appear. (I'm a Mac user & I almost never shut down my Mac)
When you change settings too many times, especially settings of drawing objects like line width in a using session, it might cause this error.
So, after changing the setting or when you come back for the next trade, please save & close that TradingView tab, and then open a new one, everything will work fine.
You can see the images below that show I have tested my indicator from 1-minute time frame, enabled all functions, change every setting to max values & everything still works fine.

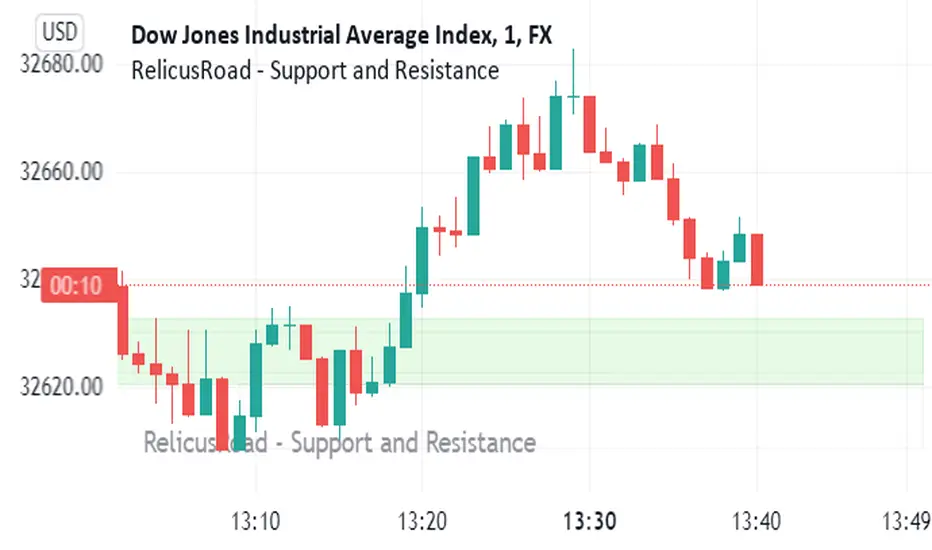
RelicusRoad - Support and ResistanceWe bring you dynamically created fundamental support and resistance analysis required for any instrument a trader trades.
Support & Resistance Concept
The concepts of trading level support and resistance are undoubtedly two of the most highly discussed attributes of technical analysis . As part of analyzing chart patterns, these terms are used by traders to refer to price levels on charts that tend to act as barriers, preventing the price of an asset from getting pushed in a certain direction.
At first, the explanation and idea behind identifying these levels seem easy, but as you'll find out, support and resistance can come in various forms, and the concept is more difficult to master than it first appears, this is where RelicusRoad - Support and Resistance comes in and draws them for you.
Technical analysts use support and resistance levels to identify price points on a chart where the probabilities favor a pause or reversal of a prevailing trend.
Support occurs where a downtrend is expected to pause due to a concentration of demand.
Resistance occurs where an uptrend is expected to pause temporarily, due to a concentration of supply.
Market psychology plays a major role as traders and investors remember the past and react to changing conditions to anticipate future market movement.
Support and resistance areas can be identified on charts using trendlines and moving averages.
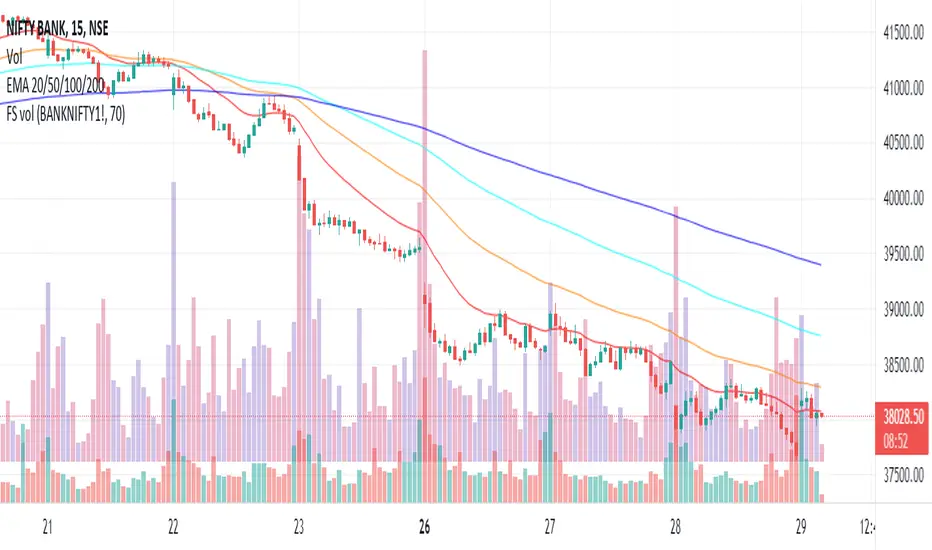
Plot futures volumes with indexMost of the times, F&O traders like to draw their own trendlines or mark other levels on the underlying instrument where volumes of the underlying is a key parameter. When such an instrument is a non-tradeable index, then one needs to switch to the futures chart for volumes. This script plots the volumes from futures on the underlying index so that traders don't need to switch charts just for futures volumes! Hope it is useful to some. Cheers!
[_ParkF]Linreg & Trendlines* The script has been uploaded again.
Linear regression and trendline not only facilitate trend identification,
but also identify support and resistance within it,
and linear regression and trendline departure can detect trend changes, which are useful in trading.
Linear regression and trend lines are shown in the chart.
It offers a variety of options, length, color, thickness, on/off switch, etc.
I hope it will help you with your trading.
hope you become rich!
---------------------------------------------------------------------------------------------------------------------------
* 스크립트가 다시 업로드 되었습니다.
선형 회귀(채널) 및 추세선은 추세 식별을 용이하게 할 뿐만 아니라,
또한 그 안에서 지지와 저항을 식별하고,
선형 회귀(채널) 및 추세선 이탈은 거래에 유용한 추세 변화를 감지할 수 있습니다.
선형 회귀(채널) 및 추세선이 차트에 표시됩니다.
길이, 색상, 두께, 온/오프 스위치 등 다양한 옵션을 제공합니다.
거래에 도움이 되셨으면 합니다.
부자되세요!
---------------------------------------------------------------------------------------------------------------------------
* I would like to express my gratitude to zdmre for revealing the linear regression source.

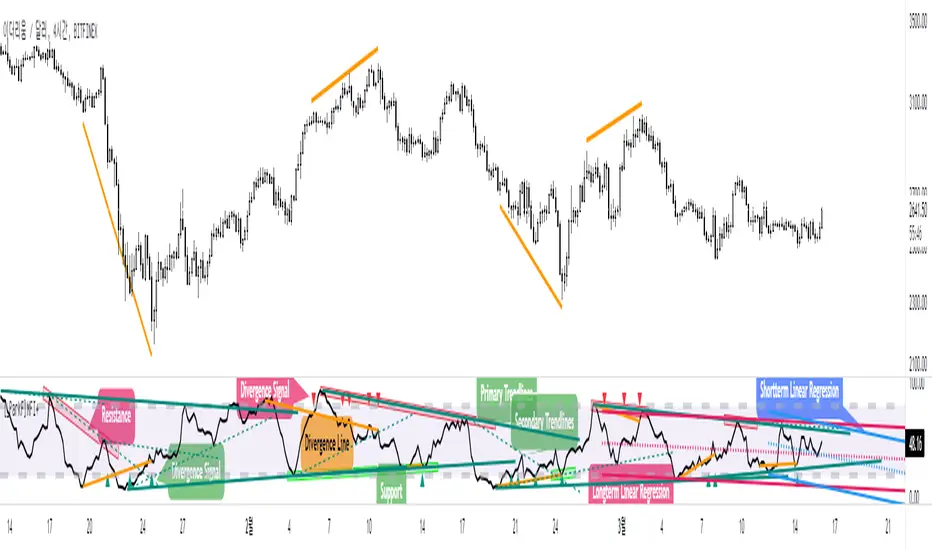
[_ParkF]MFI+Added the Moneyflow Index indicator.
Divergence signals and diversion lines are drawn.
Support and resistance were also confirmed when linear regression and trend lines were used for the Moneyflow Index.
Two linear regression and two trend lines are drawn.
Because the two linear regression values are different, you can see the support and resistance of long-term and short-term linear regression.
Since the periodic values of the two trend lines are also different, support and resistance that could not be identified in linear regression can be identified.
Each linear regression line and trend line can be turned on or off.
In addition, each linear regression line and trend line can arbitrarily modify period values and deviation values.
I hope it will help you trade.
-------------------------------------------------------------------------------------------------------------------------------------------------------------------------------------------
머니플로우인덱스 지표를 추가하였습니다.
다이버전스 신호와 다이버전스 라인이 그려집니다.
머니플로우인덱스에도 선형회귀와 추세선을 이용했을 때 지지와 저항이 확인이 되었습니다.
2개의 선형회귀와 2개의 추세선이 그려지고
두 선형 회귀 값은 서로 다르기 때문에 장기 및 단기 선형 회귀의 지지 및 저항을 확인할 수 있습니다.
두 추세선의 주기 값도 다르므로 선형 회귀 분석에서 확인할 수 없었던 지지 및 저항을 확인할 수 있습니다.
각 선형 회귀선 및 추세선은 켜거나 끌 수 있습니다.
또한 각 선형 회귀선 및 추세선은 주기 값과 편차 값을 임의로 수정할 수 있습니다.
당신의 트레이딩에 도움이 되었으면 합니다.
-------------------------------------------------------------------------------------------------------------------------------------------------------------------------------------------
* I would like to express my gratitude to zdmre for revealing the linear regression source.
* I would like to express my gratitude to aaahopper for revealing the trendlines source.
[_ParkF]RSI+RSI ----- UPGRADE ----> RSI+
-------------------------------------------------------------------------------------------------------------------------------------------------------------------------------------------
The RSI index has been upgraded.
The display function of RSI Candle, RSI Line, Divergence, and Divergence Line, which were previous functions, has been maintained.
As an upgrade, two linear regression and two trend lines are drawn.
Since the two linear regression values are different, support and resistance of long-term and short-term linear regression can be confirmed.
The two trend lines also have different period values, so it is possible to check support and resistance that could not be confirmed in linear regression.
Each linear regression and trend line can be turned on and off.
In addition, each linear regression and trend line can arbitrarily modify period values and deviation values.
Log charts and linear chart switches have been added to the trend line.
I hope it will help you with your trading.
-------------------------------------------------------------------------------------------------------------------------------------------------------------------------------------------
RSI 인덱스가 업그레이드되었습니다.
기존 기능이었던 캔들, 라인, 다이버전스, 다이버전스 라인의 디스플레이 기능은 그대로 유지됐다.
업그레이드로 두 개의 선형 회귀 분석과 두 개의 추세선이 그려집니다.
두 선형 회귀 값은 서로 다르기 때문에 장기 및 단기 선형 회귀의 지지 및 저항을 확인할 수 있습니다.
두 추세선의 주기 값도 다르므로 선형 회귀 분석에서 확인할 수 없었던 지지 및 저항을 확인할 수 있습니다.
각 선형 회귀선 및 추세선은 켜거나 끌 수 있습니다.
또한 각 선형 회귀선 및 추세선은 주기 값과 편차 값을 임의로 수정할 수 있습니다.
로그 차트 및 선형 차트 스위치가 추세선에 추가되었습니다.
당신의 트레이딩에 도움이 되었으면 합니다.
* I would like to express my gratitude to zdmre for revealing the linear regression source.
* I would like to express my gratitude to aaahopper for revealing the trendlines source.

Bitcoin Power Law Bands (BTC Power Law) Indicator█ OVERVIEW
The 'Bitcoin Power Law Bands' indicator is a set of three US dollar price trendlines and two price bands for bitcoin , indicating overall long-term trend, support and resistance levels as well as oversold and overbought conditions. The magnitude and growth of the middle (Center) line is determined by double logarithmic (log-log) regression on the entire USD price history of bitcoin . The upper (Resistance) and lower (Support) lines follow the same trajectory but multiplied by respective (fixed) factors. These two lines indicate levels where the price of bitcoin is expected to meet strong long-term resistance or receive strong long-term support. The two bands between the three lines are price levels where bitcoin may be considered overbought or oversold.
All parameters and visuals may be customized by the user as needed.
█ CONCEPTS
Long-term models
Long-term price models have many challenges, the most significant of which is getting the growth curve right overall. No one can predict how a certain market, asset class, or financial instrument will unfold over several decades. In the case of bitcoin , price history is very limited and extremely volatile, and this further complicates the situation. Fortunately for us, a few smart people already had some bright ideas that seem to have stood the test of time.
Power law
The so-called power law is the only long-term bitcoin price model that has a chance of survival for the years ahead. The idea behind the power law is very simple: over time, the rapid (exponential) initial growth cannot possibly be sustained (see The seduction of the exponential curve for a fun take on this). Year-on-year returns, therefore, must decrease over time, which leads us to the concept of diminishing returns and the power law. In this context, the power law translates to linear growth on a chart with both its axes scaled logarithmically. This is called the log-log chart (as opposed to the semilog chart you see above, on which only one of the axes - price - is logarithmic).
Log-log regression
When both price and time are scaled logarithmically, the power law leads to a linear relationship between them. This in turn allows us to apply linear regression techniques, which will find the best-fitting straight line to the data points in question. The result of performing this log-log regression (i.e. linear regression on a log-log scaled dataset) is two parameters: slope (m) and intercept (b). These parameters fully describe the relationship between price and time as follows: log(P) = m * log(T) + b, where P is price and T is time. Price is measured in US dollars , and Time is counted as the number of days elapsed since bitcoin 's genesis block.
DPC model
The final piece of our puzzle is the Dynamic Power Cycle (DPC) price model of bitcoin . DPC is a long-term cyclic model that uses the power law as its foundation, to which a periodic component stemming from the block subsidy halving cycle is applied dynamically. The regression parameters of this model are re-calculated daily to ensure longevity. For the 'Bitcoin Power Law Bands' indicator, the slope and intercept parameters were calculated on publication date (March 6, 2022). The slope of the Resistance Line is the same as that of the Center Line; its intercept was determined by fitting the line onto the Nov 2021 cycle peak. The slope of the Support Line is the same as that of the Center Line; its intercept was determined by fitting the line onto the Dec 2018 trough of the previous cycle. Please see the Limitations section below on the implications of a static model.
█ FEATURES
Inputs
• Parameters
• Center Intercept (b) and Slope (m): These log-log regression parameters control the behavior of the grey line in the middle
• Resistance Intercept (b) and Slope (m): These log-log regression parameters control the behavior of the red line at the top
• Support Intercept (b) and Slope (m): These log-log regression parameters control the behavior of the green line at the bottom
• Controls
• Plot Line Fill: N/A
• Plot Opportunity Label: Controls the display of current price level relative to the Center, Resistance and Support Lines
Style
• Visuals
• Center: Control, color, opacity, thickness, price line control and line style of the Center Line
• Resistance: Control, color, opacity, thickness, price line control and line style of the Resistance Line
• Support: Control, color, opacity, thickness, price line control and line style of the Support Line
• Plots Background: Control, color and opacity of the Upper Band
• Plots Background: Control, color and opacity of the Lower Band
• Labels: N/A
• Output
• Labels on price scale: Controls the display of current Center, Resistance and Support Line values on the price scale
• Values in status line: Controls the display of current Center, Resistance and Support Line values in the indicator's status line
█ HOW TO USE
The indicator includes three price lines:
• The grey Center Line in the middle shows the overall long-term bitcoin USD price trend
• The red Resistance Line at the top is an indication of where the bitcoin USD price is expected to meet strong long-term resistance
• The green Support Line at the bottom is an indication of where the bitcoin USD price is expected to receive strong long-term support
These lines envelope two price bands:
• The red Upper Band between the Center and Resistance Lines is an area where bitcoin is considered overbought (i.e. too expensive)
• The green Lower Band between the Support and Center Lines is an area where bitcoin is considered oversold (i.e. too cheap)
The power law model assumes that the price of bitcoin will fluctuate around the Center Line, by meeting resistance at the Resistance Line and finding support at the Support Line. When the current price is well below the Center Line (i.e. well into the green Lower Band), bitcoin is considered too cheap (oversold). When the current price is well above the Center Line (i.e. well into the red Upper Band), bitcoin is considered too expensive (overbought). This idea alone is not sufficient for profitable trading, but, when combined with other factors, it could guide the user's decision-making process in the right direction.
█ LIMITATIONS
The indicator is based on a static model, and for this reason it will gradually lose its usefulness. The Center Line is the most durable of the three lines since the long-term growth trend of bitcoin seems to deviate little from the power law. However, how far price extends above and below this line will change with every halving cycle (as can be seen for past cycles). Periodic updates will be needed to keep the indicator relevant. The user is invited to adjust the slope and intercept parameters manually between two updates of the indicator.
█ RAMBLINGS
The 'Bitcoin Power Law Bands' indicator is a useful tool for users wishing to place bitcoin in a macro context. As described above, the price level relative to the three lines is a rough indication of whether bitcoin is over- or undervalued. Users wishing to gain more insight into bitcoin price trends may follow the author's periodic updates of the DPC model (contact information below).
█ NOTES
The author regularly posts on Twitter using the @DeFi_initiate handle.
█ THANKS
Many thanks to the following individuals, who - one way or another - made the 'Bitcoin Power Law Bands' indicator possible:
• TradingView user 'capriole_charles', whose open-source 'Bitcoin Power Law Corridor' script was the basis for this indicator
• Harold Christopher Burger, whose Bitcoin’s natural long-term power-law corridor of growth article (2019) was the basis for the 'Bitcoin Power Law Corridor' script
• Bitcoin Forum user "Trololo", who posted the original power law model at Logarithmic (non-linear) regression - Bitcoin estimated value (2014)

Reversal off EMA-XsEMA-Xs works mostly on Forex due to the small prices and price fluctuations. It does work on Gold, oddly enough, and some others like UKX 100...but mostly on forex. It doesn't work as well on JPY pairs but occasionally does; the JPY pairs give less signals, but when a JPY pair gives a signal, its a high probability setup. Another script EMA-XL works better on the higher priced instruments like S&P, DJI, OIL, BTC etc.
This script will show 3 moving averages: 13, 34, 200 and works on the 5m, 1hr, 4hr, daily charts. Signals "B" or "S" will be on the chart above or below the candles respectively.
When to open:
The script gives buy and sell signals based on a counter-trend move away from the MA's. When the price rises a specific percent above/below the EMA, it'll give a signal. It's best to take a trade when it gives a cluster of consecutive signals near the same price. If using on the 5m, definitely wait for consecutive signals. Also, use this in conjunction with support and resistance areas. Using with fibs for confirmation really makes this a good tool with high probability: IE, when price hits a fib and the script gives a signal, its a high probability setup.
When to close:
1. After a fast move up/down you may use this to counter trade a scalp 10+ pips, but you need to be quick; applies mostly to the 5m chart.
2. If you have the tenacity wait until you see an opposite signal. With this method you may be holding a loosing trade for a while. But what I've noticed is if it trends against you, price usually with come near to the first time it signaled. You may want to stack trades on each cluster of signals. IE first trade is 1000 units, next is 2000 units, etc... then close when prices comes near the first time it signaled. By this time, if you held, you should have profit. This strategy will really test your mental resilience.
3. Wait until it comes back to one of the trendlines; remember this is a counter trend signal so price is moving away from the MA and it always returns to touch one of the MA's...LOL eventually
4. Applying to scalping on the 5m, keep the stops tight because if the instrument trends hard and fast, you'll be upside-down quickly.
If you put a lot of time into using this signal generator, you can really make good profit. But with all tools, you need to master it. There are nuances to the simple logic of this script that can be both fun and frustrating. With all endeavors, if you put the time into it, you will reap the rewards.
Good luck and let me know if you have any questions/comments.

Support and Resistance Based Off Indicators V2Theory Behind It"
There have been hundreds of trading methods and theories that have been proposed by the trading community, each with a unique perspective on trading. One of the most popular theories is known as the Dow theory which was one of the first theories to theorise the concept known today as trends. Now the majority of today's trading strategies are based off the single concept known as "trends."
These concepts and theories have shaped many traders strategies and trading plans to this day. And with a new era of easy access trading, in which nearly anyone with a wifi connection, and computer, or smartphone an trade hundreds of markets brings a light to traders known as retail traders. Which according to Credit Suisse, have accounted for a third of all stock market activity in the United States at points this year. This means that Retail traders are now a community of “market players” that are knowledgeable investors who seek to learn and incorporate their own trading strategies into the market.
This newfound significance of retail traders in the market prompted me to consider a new concept, which I've dubbed the "retail theory." This theory combines the theory that intraday traders move market prices, and if we can figure out what the majority of these retail traders are doing, we can trade based on other traders rather than the actual financial instrument. This notion may be difficult to grasp, so let's break it down.
Let's say there are ten people who can pick any color from a bag. Out of the ten people, Yellow is the favorite colour of two people, blue is the favourite colour of one person, and red is the favourite colour of seven people. Let's pretend we had to bet on which colour the majority of those ten people would choose. While it's evident that we'd all bet on red to win because it's the most popular color, but how does this apply to the markets?
While traders, as we all know, use a variety of indicators to determine where to buy and sell. Some of the most popular indicators that majority of traders use are the moving averages, exponential moving averages, bollinger bands, fib levels, pivot points, vwap, etc. Now tt's impossible to say which indicators are preferred by the majority of traders, but if the majority of indicators align at a certain level, we may infer that the majority of traders will be looking to buy or sell at that level. This is where the indicators-based support and resistance indicator (I know, bad name, but I'm not that creative) comes into play. We can get a good indication of where the bulk of traders will be looking to add or sell by looking at the top indicators on the market and seeing if they are within range of each other. When this is combined with the basic theory of trends, we are able to gain a competitive advantage in the market that few traders have, known as an edge.
If you have any questions based on this theory let me know, but as I said before this theory is based on the concept that we are trading based off majority of what other traders think or are trading off of, not what we think
How It Works:
This indicator checks to see if other types of support and resistance indicators, such as the EMA, VWAP, FIb levels, and so on, are within range of one another. Simply put, when two indicators are within range of each other, a box will appear indicating where they are matching. The color of the box is determined by the number of indicators that line up within the same range, which can be adjusted with user input.
The user also has free range to change all input settings
How To Use:
This is a form of resistance and support indicator that should be used in conjunction with other technical tools. Each box color shows the number of indicators that are aligned with one another. A yellow box, for example, indicates that six or more indicators are within range of each other, but a white box indicates that only two indicators are within range of each other.
These boxes that appear should just be used as a type of support and resistance, but again you can see the strength of the support and resistance by the color.
Notes:
I came out with the concept version about a month ago, and since then it has been nothing but prefect for me. I found with 5 or more indicators line up within each other, then that area tends to be a key "dip buy" area for me. Also acts as a extremely powerful support or resistance if the indicator lines up with trendlines, or horizontal daily supports

TSI in Dynamic Zones with Divergence and Pivot PointsTrue Strength Index , or TSI is considered a "leading indicator" - in contrast to a "lagging indicator" just as Moving Averages it does not show a confirmation what already happened, but it shows what can happen in the future. For example: The chart is climbing while the TSI oscillator is slowly declining, gets weaker and weaker, maybe even prints bearish divergences? That means that a reversal might be occurring soon. Leading indicators are best paired with Stop and Resistance Lines, General Trendlines , Fib Retracements etc. Your chart is approaching a very important Resistance Trendline but the TSI shows a very positive signal? That means there is a high probability that the Resistance is going to be pushed through and becomes Support in the future.
What are those circles?
-These are Divergences. Red for Regular-Bearish. Orange for Hidden-Bearish. Green for Regular-Bullish. Aqua for Hidden-Bullish.
What are those triangles?
- These are Pivots . They show when the TSI oscillator might reverse, this is important to know because many times the price action follows this move.
What are these blue or orange areas?
- Those are dynamic zones. For the analysis of the TSI its important to know if the indicator is in a state of oversold or overbought to filter out ranging price movement. Normally those zones are static, in this version of the TSI oscillator dynamic zones were added to show a dynamic calculation whether the TSI oscillator is oversold, overbought or ranging.
Please keep in mind that this indicator is a tool and not a strategy, do not blindly trade signals, do your own research first! Use this indicator in conjunction with other indicators to get multiple confirmations.

Volume Weighted Balance of PowerAs always, this is not financial advice and use at your own risk. Trading is risky and can cost you significant sums of money if you are not careful. Make sure you always have a proper entry and exit plan that includes defining your risk before you enter a trade.
I have modified the Balance of Power indicator that measures the difference between the open and the close and the high and low of the current bar to incorporate volume information as well. Further, I have smoothed the indicator, which is usually very choppy and difficult to read with a 21 period Least Squares Moving Average to create a Volume-Weighted Balance of Power. Since we are all aware that volume precedes price I figured this could be a neat little trend-confirmation indicator.
Uses:
1) The indicator is fairly straight forward, when it crosses below its zero line, this signals that there is more selling pressure in the current market vs. buying. Conversely, when it crosses above its zero line, this means more buyers have stepped up and are pushing prices higher.
2) It is sensitive enough to volume and price shifts that it produce divergences, which are often thought to be some of the most powerful trading signals in any market.
3) Use this tool to confirm breaks from trendlines or trading ranges to see if there is enough pressure and volume to support the move.
Enjoy and trade responsibly!

Cloud Ribbon ++ by [JohnnySnow]Inspired by my favorite EMA ribbon - "EMA Ribbon " by fskrypt.
This Ribbon ADD the option to choose the avarage algorithm of the ribbon .
Created also to be more friendly to read along with trendlines and Fibonacci retracements.
For those like me that NOT use this ribbon to find exact price action but instead, to have a grasp of possible Support/Resistance strenght ahead.
High transparency lines and a configurable color palette for filling the background give the ribbon a look of support/ Resistance cloud Strenght.
Each MA length, line, and background color can be easily configured.

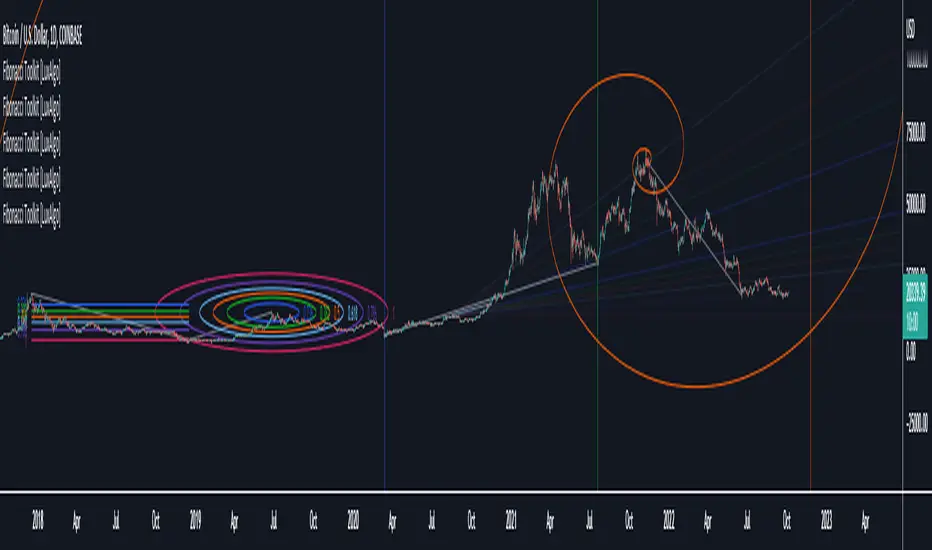
Fibonacci Toolkit [LuxAlgo]This toolkit aims to display multiple Fibonacci drawing tools including retracements, arcs, circles, fans, timezones and spirals.
Usage
Upon adding the indicator to the chart, users will be prompted to choose a starting point and an ending point for the calculation of the drawing tools.
Users can then navigate to the settings of the toolkit and choose which drawing tool to display using the Fibonacci drop-down menu. Users are also free to change the default Fibonacci ratios used by the indicator from within the settings. Each tool is described below.
Retracements
Fibonacci retracements display multiple levels constructed using the starting price point, ending price point, and multiple Fibonacci ratios. These levels can be used as support and resistance.
Arcs
Fibonacci arcs display multiple semi-circles. Each semi-circle crosses the line connecting the starting & end price point at a certain percentage determined by Fibonacci ratios. These arcs can be used as support and resistance.
Circles
The Fibonacci circles are similar to the Fibonacci arcs but display a full circle instead. Users can expect the price to bounce off of the circles.
This tool is less commonly used by traders.
Fan
A Fibonacci fan is a tool displaying trendlines all connected to a starting point and extending to a point determined by Fibonacci ratios. These can also be used as support and resistance.
Timezone
Fibonacci timezones return a series of horizontal lines. The distance of the lines increases by a factor given by the numbers in the Fibonacci sequence.
This tool can be useful to highlight points where a trend might reverse assuming that their duration increases over time.
Spiral
The Fibonnaci spiral displays a spiral that grows by a factor given by the golden ratio. This indicator returns a spiral using 7 turns (5 internal) and sets the origin of the spiral to the ending point which is selected by the user. The height of the spiral is based on the price range between the starting point and ending point.
Note that potential display artifacts can be seen when fitting the spiral on stocks and forex pairs.
Volume Price Trend with Divergence and Pivot Points The volume price trend indicator is used to determine the balance between a security’s demand and supply. The percentage change in the share price trend shows the relative supply or demand of a particular security, while volume indicates the force behind the trend. The VPT indicator is similar to the on-balance volume (OBV) indicator in that it measures cumulative volume and provides traders with information about a security’s money flow.
This is Volume Price Trend or VPT recalculated to be an Oscillator, a Divergence hunter was added, also Pivot Points and Alerts.
VPT is considered a "leading indicator" - in contrast to a "lagging indicator" just as Moving Averages it does not show a confirmation what already happened, but it shows what can happen in the future. For example: The chart is climbing while the VPT oscillator is slowly declining, gets weaker and weaker, maybe even prints bearish divergences? That means that a reversal might be occurring soon. Leading indicators are best paired with Stop and Resistance Lines, general Trendlines , Fib Retracements etc...Your chart is approaching a very important Resistance Trendline but the VPT shows a very positive signal? That means there is a high probability that the Resistance is going to be pushed though and becomes Support in the future.
What are those circles?
-These are Divergences. Red for Regular-Bearish. Orange for Hidden-Bearish. Green for Regular-Bullish. Aqua for Hidden-Bullish.
What are those triangles?
- These are Pivots . They show when the VPT oscillator might reverse, this is important to know because many times the price action follows this move.
Please keep in mind that this indicator is a tool and not a strategy, do not blindly trade signals, do your own research first! Use this indicator in conjunction with other indicators to get multiple confirmations.
