Cryptocurrency trend following EMA Ribbon LONG only strategyThis strategy is based on EMA Ribbon and uses multiple indicators to find optimal time to enter/exit the trade and filter out false signals. The script with default setting is developed mainly for trading altcoins/stable coin pair such as ADA/USDT etc on 4h timeframe but it can be applied to any pair/any timeframe with some settings adjustments.
For plot on chart features make sure that you have both study and strategy scripts on chart with same settings.
Strategy settings description:
1. Signal EMA Length - Value for exponencial moving average (slowest from EMA Ribbon)
1a. Buy price toleration (%) - Price deviation for filtering bounces of EMA - price must close defined percents above EMA to open long trade
1b. Sell price toleration (%) - Price deviation for filtering bounces of EMA - price must close defined percents bellow EMA to close long trade
1c. EMA deelay - EMA id delayed by defined bars for smoothening
2. Filter by Fast EMA - Strategy filters signals to prevent buy while coin is dropping
2a. Fast EMA Length - Value for fast exponencial moving average
3. Filter by SMA - Strategy filters signals to confirm trend change
3a. SMA Length - Value for simple moving average
4. Filter by RSI - Strategy filters signals to prevent buing/selling overbought/oversold coins
4a. RSI Length - Length of RSI identificator
4b. RSI Source candle - What price of candle is used for RSI calculation (open, close, high, low)
4c. RSI Long condition - When buy, RSI indicator must be below this value to prevent of buying already overbought coin
4d. RSI Short condition - When sell, RSI indicator must be above this value to prevent of selling already oversold coin
5. RSI Close Trade Condition - Strategy sell coin once RSI reach defined value
5a. RSI close trade condition - Sell once RSI indicator acquires defined value
6. Close trade by Take Profit or Stop Loss Condition (STRATEGY ONLY) - Strategy sell coin once defined take profit / stoploss level is reached
6a. Take Profit (%) - Take profit value in percent
6b. Stop Loss (%) - Stop loss value in percent
6c. Plot targets on chart - defined targets will be plotted as lines on chart
7. Date range from
7a From Year - To run strategy in interval
7b From Month - To run strategy in interval
7c From Day - To run strategy in interval
8. Date range to
8a To Year - To run strategy in interval
8b To Month - To run strategy in interval
8c To Day - To run strategy in interval
9. Wait to confirm the signal
9a Wait candless to buy - strategy will wait defined candless to confirm the signal before buy
9b Wait candless to sell - strategy will wait defined candless to confirm the signal before sell
10. Plotting on chart (STUDY ONLY)
10a Plot signal line channel with bows on chart
10b Plot simple moving average on chart
10c Plot EMA Ribbon on chart
10d Plot recent support and resistance levels on chart
11. Show Every signal (STUDY ONLY) - Unchecked shows only first signal based on strategy. But if you use take profit/stoploss settings within your bot, you might want to rebuy on next signal. Checked shows signal on each candle.
Throw on chart also buld-in RSI indicator and set the same as strategy
Notice that there might be false signals, especially when the coin is not trending or is strongly manipulated. Overall strategy is profitable though. You just take some minor loses and wont miss the big move.
You may also consider to compare buy&hold return vs profit from trading this strategy. In downtrend as we have seen recently, profit may not be as high as you expect but it is still much better than just hold and hope.
You can use the strategy script for fine tunning settings and find best settings for yourself.
Study script helps you to automate trading with use of alerts perharps with 3commas bot or even trade manually based on email/sms notification setted by tradingview
Notice that study script does not handle takeprofit/stoploss order. That is why sell arrows could be plotted by study script later than strategy script. To rebuy after takeprofit/stop-loss use "11. Show Every signal (STUDY ONLY)" setting
Make sure that you keep same settings for strategy and study scripts.
If you need any help with settings do not hesitate to ask. I would also appriciate any feedback and ideas how to improve this script.
Here is backtest result from 1. Nov 2018 using constant 100USD Buy ammount:
在脚本中搜索"crypto"

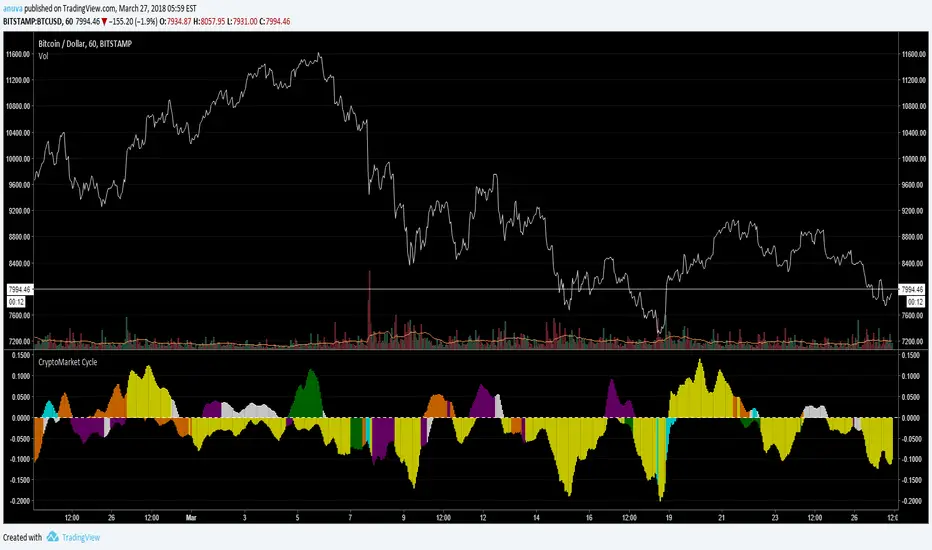
Cryptocurrency Profitability Rankings with Popular ListA good cryptocurrency may multiply your earnings - with the same effort.
This indicator helps crypto traders to find the trading securities that suit their profitability and volatility preference.
This indicator calculates and generate a ranking of profitability from a popular list of crypto currencies, based on MACD cycles within user-defined time span.
Multiple time frames: This indicator is designed for day trading, so suggested time frames are: 3m, 5m, 15m, 30m, 1H. Users can try other time frames (< 1D) if they find it useful.
Developed based on Profitability Meter for Day Trading PRO
About popular list of Cryptocurrency:
The author has the right to change the list from time to time without notice.
PRO Version of this Indicator: (invite-only)
Advanced functions:
Customisable(User-Defined) Cryptocurrency List
Option to select Open or Close price as start point for calculation.
Flexible Time Span Type: Hours and Bars, besides Days
More statistics options: Display price change(%) of latest rising/falling MACD cycle
Format Configuration:
Profitability Threshold: a percentage of price movement within a MACD cycle that a user thinks can be used to define profitability, defval: 0.8%.
Statistics Options
timeSpan: time span for statistics
timeSpanType: time span type for statistics
Related Indicators:
Profitability Meter for Day Trading PRO - Calculating and evaluating individual trading securitie's profitability.
About Loading Time: It may take up to 2 minutes for your browser to load a new format setting, depending on the your computer and network speed.
List of the author's Indicators
www.tradingview.com
Disclaim: By using or requesting access to this indicator, you acknowledge that you have read and accepted that this indicator is for study purposes only and it does NOT guarantee you will make money.
I am not financial adviser and I am NOT responsible for any profits or losses you may incur by using this indicator!
Users should make their own decisions, carefully assess risks and be responsible for investment and trading activities.
The latest updates override the previous description. Please check the updates.
加密货币赢利潜力排行指标 热门列表
优质的交易币种可能倍增你的收益-在付出同样的努力的情况下。
该指标基于Profitability Meter for Day Trading PRO开发,帮助加密货币玩家找到适合其赢利性和波动率偏好的币种。
该指标根据用户定义的时间跨度内的MACD周期,计算和比对一组虚拟货币,生成一个赢利潜力排名。
多时间维度:本指标为日内交易设计,因此建议使用时间维度:3m,5m,15m,30m,1H; 如果用户需要,也可以用于其他小于1D的维度。
关于加密货币的热门列表:
作者有权随时更改列表,恕不另行通知。
该指标的PRO版本:Cryptocurrency Profitability Rankings PRO with Customisable List (Invite-Only)
可自定义加密货币列表,上至10个
可选择开盘价或收盘价作为计算起点。
灵活的时间跨度类型:小时,蜡烛数,天数
更多统计选项:显示最近上涨/下跌的MACD周期的价格变动(%)
格式配置:
盈利能力阈值:用户自定义的MACD单次波动的可赢利的百分比,默认为0.8%
统计选项
timeSpan:统计功能的时间跨度
timeSpanType:统计功能的时间跨度单位
相关指标:
日内交易盈利潜力指示仪PRO (Profitability Meter for Day Trading PRO):用于计算和评估单个交易品种的盈利能力
关于载入新设置:每次载入新的设置可能需要0-2分钟,取决于用户的电脑配置和网络速度。
试用开发者的其他指标
www.tradingview.com
免责声明:在要求获得本指标使用权之前以及在使用本指标之前,用户认可已经完全了解和接受:本指标仅供教育和研究目的, 它不提供任何赢利的可能性。
本指标的开发者并非专业投资顾问,因此不对用户的任何赢亏负责。
用户应独立判断,审慎评估并自负投资和交易风险!
最新更新会覆盖之前的说明。 请检查更新。

Cryptocurrency trend following LONG only strategyThis strategy uses multiple indicators to find optimal time to enter/exit the trade. The default setting is mainly for trading bitcoin/stable coin pair such as USDT etc on 1h timeframe but it can be applied to any pair/any timeframe with some settings adjustments.
Strategy settings description:
ID Name Descrption
1 FastMA - Value for fast exponencial moving average
2 SlowEMA - Value for slow exponencial moving average
3 SMA - Value for simple moving average
4 RSI Length - Length of RSI identificator
5 RSI Source candle - What price of candle is used for RSI calculation (open, close, high, low)
6 RSI Long condition - When buy, RSI indicator must be below this value to prevent of buying already overbought coin
7 RSI Short condition - When sell, RSI indicator must be above this value to prevent of selling already oversold coin
8 RSI close trade condition - Sell once RSI indicator acquires defined value
9 Take Profit (%) - Take profit value in percent
10 Stop Loss (%) - Stop loss value in percent
11 Long price toleration (%) - Price deviation for filtering bounces of simple moving average - price must close defined percents above SMA to open long trade
12 Short price toleration (%) - Price deviation for filtering bounces of simple moving average - price must close defined percents bellow SMA to close long trade
13 From Year - To run strategy in interval
14 From Month - To run strategy in interval
15 From Day - To run strategy in interval
16 To Year - To run strategy in interval
17 To Month - To run strategy in interval
18 To Day - To run strategy in interval
19 Show every signal? - (Study only) Unchecked shows only first signal based on strategy. But if you use take profit/stoploss settings within your bot, you might want to rebuy on next signal. Checked shows signal on each candle.
Notice that there are also false signals, especially when the coin is not trending or is strongly manipulated. Overall strategy is profitable though. You just take some minor loses and wont miss the big move.
You may also consider to compare buy&hold return vs profit from trading this strategy. In downtrend as we have seen recently, profit may not be as high as you expect but it is still much better than just hold and hope.
You can use the strategy script for fine tunning settings and find best settings for yourself
Study script helps you to automate trading with use of alerts perharps with 3commas bot or even trade manually based on email/sms notification setted by tradingview
Make sure that you keep same settings for strategy and study scripts.
If you need any help with settings do not hesitate to ask. I would also appriciate any feedback and ideas how to improve this script.
Here is backtest result from 23.08.2017:
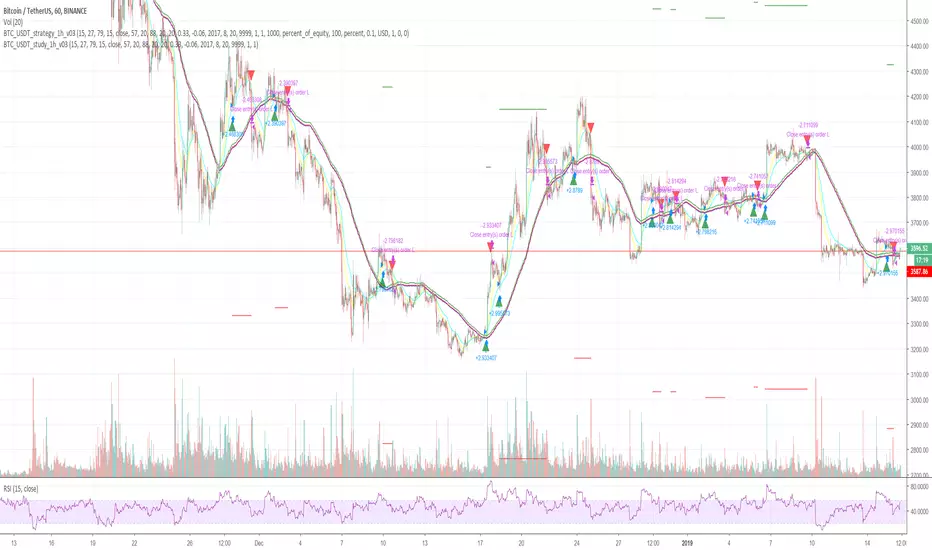
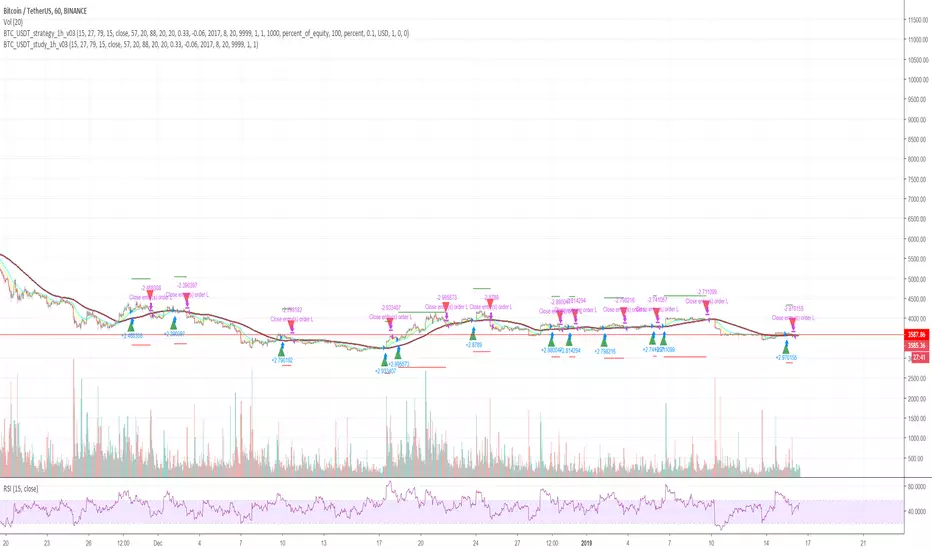
Cryptocurrency trend following LONG only studyThis strategy uses multiple indicators to find optimal time to enter/exit the trade. The default setting is mainly for trading bitcoin/stable coin pair such as USDT etc on 1h timeframe but it can be applied to any pair/any timeframe with some settings adjustments.
Strategy settings description:
ID Name Descrption
1 FastMA - Value for fast exponencial moving average
2 SlowEMA - Value for slow exponencial moving average
3 SMA - Value for simple moving average
4 RSI Length - Length of RSI identificator
5 RSI Source candle - What price of candle is used for RSI calculation (open, close, high, low)
6 RSI Long condition - When buy, RSI indicator must be below this value to prevent of buying already overbought coin
7 RSI Short condition - When sell, RSI indicator must be above this value to prevent of selling already oversold coin
8 RSI close trade condition - Sell once RSI indicator acquires defined value
9 Take Profit (%) - Take profit value in percent
10 Stop Loss (%) - Stop loss value in percent
11 Long price toleration (%) - Price deviation for filtering bounces of simple moving average - price must close defined percents above SMA to open long trade
12 Short price toleration (%) - Price deviation for filtering bounces of simple moving average - price must close defined percents bellow SMA to close long trade
13 From Year - To run strategy in interval
14 From Month - To run strategy in interval
15 From Day - To run strategy in interval
16 To Year - To run strategy in interval
17 To Month - To run strategy in interval
18 To Day - To run strategy in interval
19 Show every signal? - (Study only) Unchecked shows only first signal based on strategy. But if you use take profit/stoploss settings within your bot, you might want to rebuy on next signal. Checked shows signal on each candle.
Notice that there are also false signals, especially when the coin is not trending or is strongly manipulated. Overall strategy is profitable though. You just take some minor loses and wont miss the big move.
You may also consider to compare buy&hold return vs profit from trading this strategy. In downtrend as we have seen recently, profit may not be as high as you expect but it is still much better than just hold and hope.
You can use the strategy script for fine tunning settings and find best settings for yourself
Study script helps you to automate trading with use of alerts perharps with 3commas bot or even trade manually based on email/sms notification setted by tradingview
Make sure that you keep same settings for strategy and study scripts.
If you need any help with settings do not hesitate to ask. I would also appriciate any feedback and ideas how to improve this script.
Here is backtest result from 23.08.2017:

Crypto USD Pairs CorrelatorHey there!
This tool helps to identify the best positive and negative correlated pairs from 38 crypto */USD pairs.
By default it will find the best correlations for your current ticker.
If you are a newbie in Correlation Analysis you can find a brief explanation here .
Settings
Lookback for correlations (default: 14 )
Option to use or not to use current ticker (default: true )
Custom ticker (default: BTCUSD )
Choose as many pairs as you want from 38 available pairs.
Available pairs
ADAUSD
BATUSD
BCDUSD
BCHUSD
BCNUSD
BNBUSD
BTCUSD
BTGUSD
BTSUSD
DASHUSD
DCRUSD
DGBUSD
DOGEUSD
EOSUSD
ETCUSD
ETHUSD
ICXUSD
IOTAUSD
LSKUSD
LTCUSD
MKRUSD
NANOUSD
NEOUSD
OMGUSD
ONTUSD
PAXUSD
QTMUSD
TRXUSD
VETUSD
WAVESUSD
XEMUSD
XLMUSD
XMRUSD
XRPUSD
XTZUSD
ZECUSD
ZILUSD
ZRXUSD
Good luck!

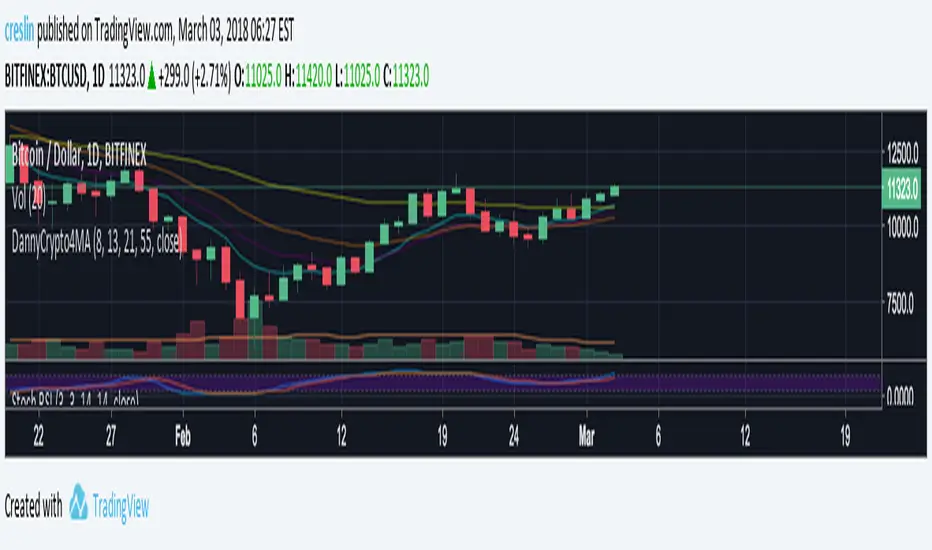
Krown Trading Moving AveragesKrown Trading 4 Exponential Moving Averages and 2 Simple Moving Averages as displayed on Krown's Crypto Cave YouTube Channel.

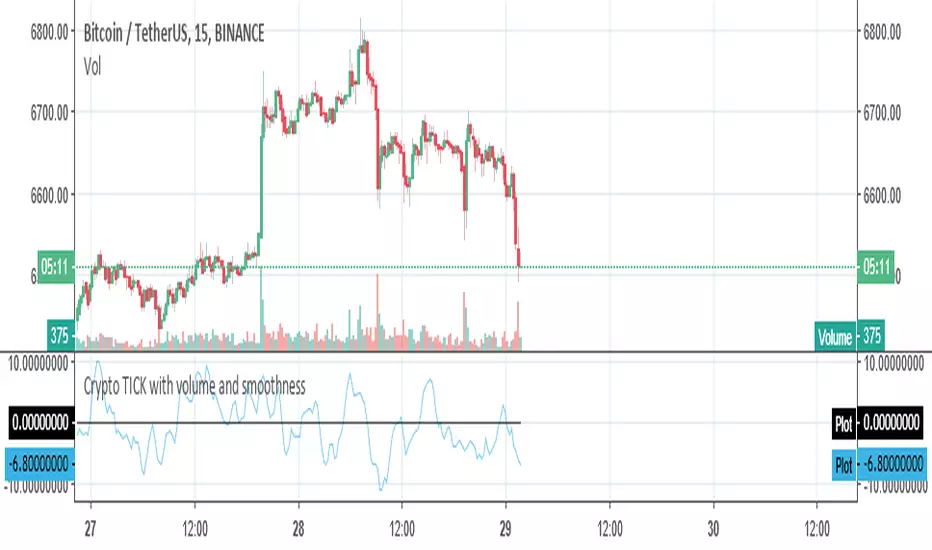
Crypto TICK with volume and smoothnessThis is more or less the TICK index calculated for the cryptos related to USDT pairs in binance. You can change the coins listed in the coins for the ones you want to use. I STRONGLY recommend you leave the default ones or use pairs against USD instead of BTC.
You can see volume ticks and price ticks together or separately and you can smooth both the base data and the indicator.
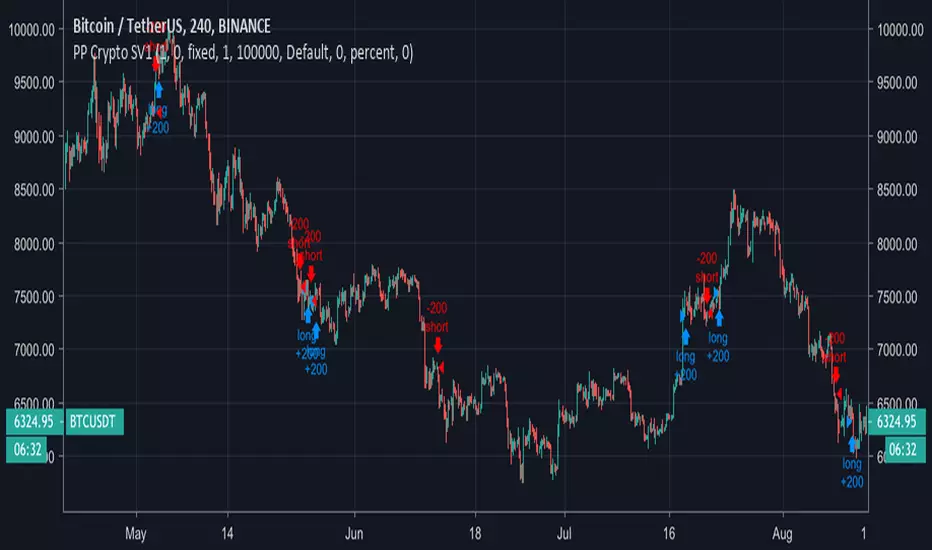
Crypto TS - Ultimate BTCUSDThis is an "advanced" trend follower Trading system, specifically developed for Bitcoin.
In this project the strategy combines two time frames, daily and 4h bars.
Bitcoin's trend is analyzed in background with Normal candlestick and Heikin-Ashi candlestick.
The operations start from the first trading day (01/01/2017) but you can change this by the following input variables:
From Month
From Day
From Year
First trading day: 01/01/2017
Initial Capital: 1000 $
net profit: 1254 %
To use this Trading system open the BTCUSD 4h Bitfinex chart and apply this strategy.
This Trading system can be fully automated to buy and sell automatically on major exchanges.

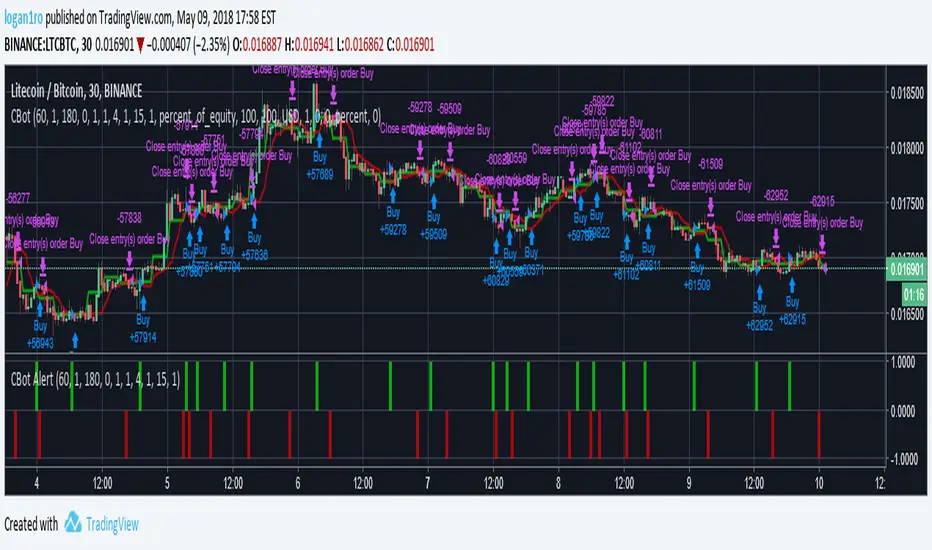
Crypto Boston MethodThis is one update to the EMA cross+future triggers
It follows the Travis Swing Method, with the next prices for the EMA crosses, green for the 1st in, blue for the 2nd in, and silver -0.64% for the all in.
Red for the sell price, orange is others (actually the sell price for second in and all in)
Update:
I added the cross price for the next day, it shows what will be the next cross price for Sell (red cross), green for 1st in (green cross), blue for the 2nd in (blue cross) and silver -0.64% for the all in ( silver -0.64% cross).
The difference is this indicator is dynamic and depends on the actual price, the first indicator relay only on the price of the candles before, this indicator gives you the info based in the actual price.
Also the Title was updated
Thanks to Travis and Hanaan for their great work!
//Tip Jar for the Author:
//ETH/ERC20 wallet: 0xb01159a43cc4cc11d9751ae12c340b5dd493ac35
//BTC: 1AnaZMNRJWPtkLC6NQvgBzyqXBnL3DXEa6
//BCC: 1AnaZMNRJWPtkLC6NQvgBzyqXBnL3DXEa6
//LTC: LZwzgQRezaYHpae9c8ZSWYHyheadtyutqA

MACD CrossOver/CrossUnder Alert ScriptThe script let you know when to sell or buy around MACD indicator.

Crypto Spiper Killer Pro [PlungerMen]Hello!
Crypto Spiper Killer Pro is a upgrade version of a Crypto Spiper Killer
Crypto Spiper Killer Pro can use for every coin
Crypto Spiper Killer Pro is available for all frames
This Script is perfectly functional and works well by me and the best way to use this script is to use it with “Bitmex Long Short" script, both compliment for each other. the "Bitmex Long Short" script is Free, you can find it by searching “Bimex”
If you want to be more accurate and more efficient, more comfortable when you do not want to see too many other indicators, you can register for our Professional edition.
- The Professional Edition supports Level 1 and Level 2 commands ( display at chart : LONG+, long-, SHORT,+,short- ), which are very effective in allocating funds and optimizing your profits
Besides that,You will be supported by personal preferences, profit maximization
- Register for a Professional version will be used 2 Script, Bitcoin -0.95% -3.33% -3.27% Scalping Pro and Bitmex Long Short Pro
- We will invite you to the signal channel Telgram with the announcement of the bottom and the peak of the BTC -0.95% -3.33% -3.27% 0.60% -0.13% ,the big variable variable has exists
**We hope you enjoy this script. Your support will help us develop more good quality scripts in the future to serve the community **
**Remember, Like this script and posivite feedback if you are satisfied**
if you have any questions, post a comment ... below here
*********** Guide:
+ option for all frames : Click setting and input high and low for time inteval
+ hide wave trend : Click setting -> click Style --> Up trend Fill or Down trend fill
******
New features: this time we add two lines that can help traders trader safer. When the red line cross above the green line means we are in the downtrend and when the green line cross above the red line, which means we are in a uptrend. This new features will help traders do a safer trade at small time frame.
We have the Script free for the user pass, search keyword " Crypto Spiper Killer Pro "
-->> 0.2 eth/1 month will be used 2 Script: Crypto Spiper Killer Pro and Bitmex Long Short Pro - and Super Bot telegram

Crypto Low Frequency Trader [ALERTS] - NO REPAINTLow Frequency Trading Signals - Safe to trade with low leverage leverage and make a retirement fund.
Absolutely NO REPAINT.
Very conservative approach.
Works best on 1H chart.
This is the alerts indicator, check my profile for the strategy with backtest.
This Level of Strategy, will not be free. PM for access - Monthly Subscription.

Crypto Buy/Sell Signals[alt] Autoview/Gunbot -CryptoProToolsA second version of Buy/Sell signals with the basis being EMAGain with an EMA channel filter.
I'm having success using this one to ladder in and out of the market.

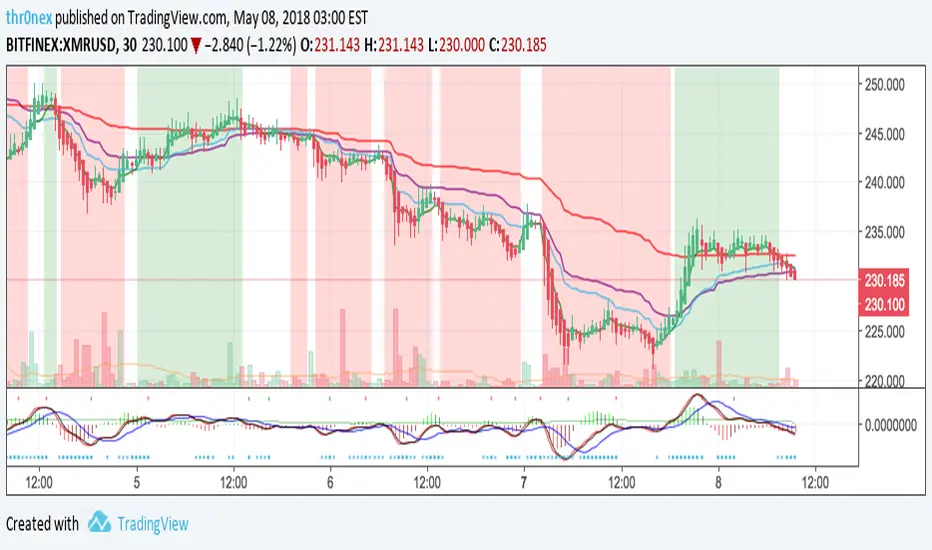
Spreads + MA + Bollinger Bands [USDBRL] Crypto
Cryptocurrency adoption is on a constant upward trajectory. The interest for trading 'crypto assets' could not stay anywhere behind. The amateur nature of the market together with huge 'price inefficiencies' is always giving rise to excellent arbitrage opportunities throughout the globe. This code aims to help traders to make money placing safe and profitable trades which will eventually help the community to move towards more efficient price discovery.
The script combines up to three assets to be monitored at the same time. It also allows the trader to plot Simple or Exponential Moving Averages and Bollinger Bands (BB) for each asset he wants to trade.
Instructions:
* International/local -- it allows the trader to switch between international spreads and local (currency) spreads, considering the market he is targeting. The default value is international. Unchecking the field will set the script for local trades.
* Fees -- enables one to add his effective operational cost directly on the chart. This feature might be potentially relevant for traders who engage with fast-moving markets which demands action to be taken right away. The logic for calculations when fees are in place is the following (fee ≠ 0): if (spread > 0), then (spread - fee). If (spread < 0), then (spread + fee). When the spread is too short, the code may plot somewhat weird charts. In this case, it might be interesting to keep fee = 0.
* Standard/ Absolute BB -- it changes from standard Bollinger Bands (default value) to absolute Bollinger Bands . The standard version calculates the bands over the moving average. The absolute version calculates each band in isolation taking absolute values as arguments. Play with the two options (and deviation) to see which is better regarding your market and the instrument of your choice. Uncheck the field to get the absolute version. Feedback on this point is particularly appreciated.
* Expon. Ma -- it switches everything from Simple Moving Averages ( SMA ) to Exponential Moving Averages ( EMA ). Default value: SMA .
I hope you guys manage to make money using the script. And if you do, feel free to show your appreciation. Any amount is welcome! Let's take advantage of what crypto enabled us.
Tips : =>
BTC: 33RUY4AXBEL89gEsoqDpXRgvdZWePhLrqc
LTC: M9mBqVhxWNuZuCPEsrRtH3ygxNYnCdMEki
LTC: 36btZsgNxqiPibag6quTEtdX367wXskUnJ (old format)
ETH: 0x1D3E1701F1A0C379e7Fcb60BADBcd14AcE8160c4
DASH: XnKHHcmhZmR2SAqavP1x6FbEBrqTYa4kTk
If you want to use the script, please, let me know leaving a comment below.
Trade wisely and good luck out there.
Spreads + MA + Bollinger BandsCryptocurrency adoption is on a constant upward trajectory. The interest for trading 'crypto assets' could not stay anywhere behind. The amateur nature of the market together with huge 'price inefficiencies' is always giving rise to excellent arbitrage opportunities throughout the globe. This code aims to help traders to make money placing safe and profitable trades which will eventually help the community to move towards more efficient price discovery.
The script combines up to three assets to be monitored at the same time. It also allows the trader to plot Simple or Exponential Moving Averages and Bollinger Bands (BB) for each asset he wants to trade.
Instructions:
* International/local -- it allows the trader to switch between international spreads and local (currency) spreads, considering the market he is targeting. The default value is international. Unchecking the field will set the script for local trades.
* Fees -- enables one to add his effective operational cost directly on the chart. This feature might be potentially relevant for traders who engage with fast-moving markets which demands action to be taken right away. The logic for calculations when fees are in place is the following (fee ≠ 0): if (spread > 0), then (spread - fee). If (spread < 0), then (spread + fee). When the spread is too short, the code may plot somewhat weird charts. In this case, it might be interesting to keep fee = 0.
* Standard/ Absolute BB -- it changes from standard Bollinger Bands (default value) to absolute Bollinger Bands. The standard version calculates the bands over the moving average. The absolute version calculates each band in isolation taking absolute values as arguments. Play with the two options (and deviation) to see which is better regarding your market and the instrument of your choice. Uncheck the field to get the absolute version. Feedback on this point is particularly appreciated.
* Expon. Ma -- it switches everything from Simple Moving Averages (SMA) to Exponential Moving Averages (EMA). Default value: SMA.
I hope you guys manage to make money using the script. And if you do, feel free to show your appreciation. Any amount is welcome! Let's take advantage of what crypto enabled us.
Tips : =>
BTC: 33RUY4AXBEL89gEsoqDpXRgvdZWePhLrqc
LTC: M9mBqVhxWNuZuCPEsrRtH3ygxNYnCdMEki
LTC: 36btZsgNxqiPibag6quTEtdX367wXskUnJ (old format)
ETH: 0x1D3E1701F1A0C379e7Fcb60BADBcd14AcE8160c4
DASH: XnKHHcmhZmR2SAqavP1x6FbEBrqTYa4kTk
If you want to use the script, please, let me know leaving a comment below.
Trade wisely and good luck out there.
Crypto - Open Close Cross V6.3Focused on crypto.
Based on an Cpen Close Cross Strategy, augmented by AO and EMA 50/100 crosses.

Crypto - Open Close Cross With EMA - V6.3Designed around Crypto.
Based on an Open Close Cross strategy. Uses AO and EMA50 crosses to reduce risk.

Crypto Quad EMA 8,13,21,55Displays 8,13,21,55 EMAs on a single indicator.
Useful for Crypto trading and reduced the number of indicators needed to view multiple EMAs
When shorter EMAs cross over the longer its a good sign of Bullish/Bearish reversal.
This sentiment is more true at longer timeframes, such as daily candles, as the trend has more momentum.