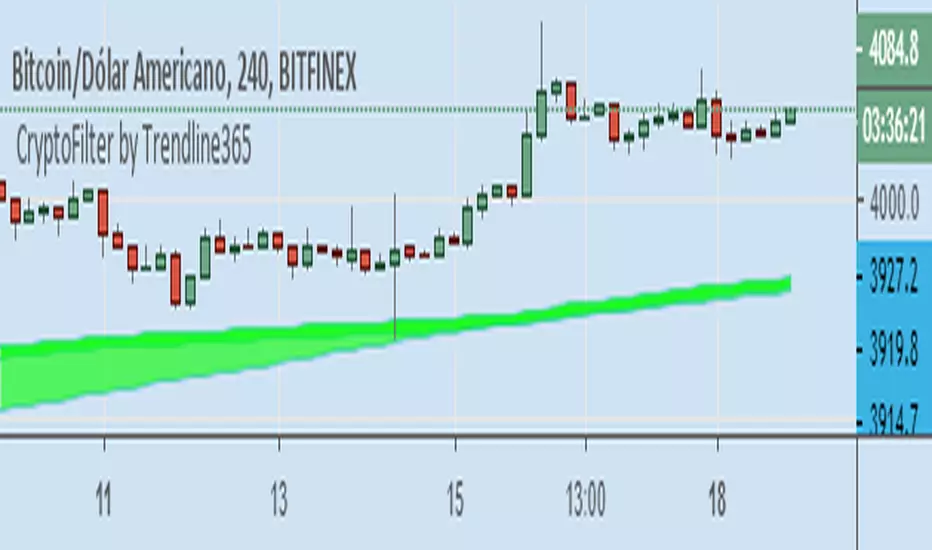
Cryptofilter by Trendline365Cryptofilter: Indicator filter trend for Crypto-Market.
With this indicator it is possible to read the trend of the graphical time,
so that the user can compare with other graph times and check if the market is aligned or not.
Thus it is possible to define if the market is aligned in several times of reading, following the same direction, mainly the sequential times, or 1/5 / 15min and 5/15/60 min.
Cryptofilter is not recommended for use as a point of entry or exit indicator.
在脚本中搜索"crypto"
CMC Top 5 RSI ScannerScan the RSI for the top 5 cryptos now!
No need to switch between charts anymore. You just need to activate this script and you will have a global view of the current RSI status for your favorite coins. Feel free to edit the source code yourself to add / remove more coins to the scan list.
The transparency will change if the RSI go over the overbuy / oversell zone (default 80/20)
Also, you should display the label names and values on the chart (click on the gear settings at the bottom of your chart > Select "Labels" > Select "Indicator Name label" & "Indicator Last Value Label")
Enjoy!


Top 5 coins cummulated Upvol/Dnvol and Money FlowThis script reads price and volume information for the top 5 coins (on 9 exchanges, a total of 29 pairs), calculates the cummulative upvolume and downvolume according to the Money Flow (MFI) formula, and shows upvolume and downvolume separately on the chart as a green and a red line.
The coins used are BTC, ETH, LTC, XRP and EOS. They are the top 5 coins by daily volume, as of 24th of February 2019.
Because of the many security() calls needed, the script is VERY slow, so have lots of patience.
I find it useful as a broad crypto market indicator - for example to compare the current pump with the pumps in the past.
Can also calculate the aggregated Money Flow (MFI) if you check that option in the indicator's configuration. Make sure to wait for recalculation and rescale the chart afterwards - MFI has a value from 0 to 100 and you may need to zoom in.


Average True Range (ATR %) Stop Loss CalculatorThis indicator takes the average of a series of ATR to calculate what I would consider an optimum stop loss placement represented in percentage (read below for full overview).
While the data is plotted what is most helpful are the actual numbers presented and for my charts I remove most of the plotting.
This indicator is most helpful on the daily timeframe but can be used for all timeframes such as the 4HR, 1HR or even 15M.
This indicator should not be used alone. It should be used in conjunction with proper price action analysis. It’s also a great indicator if you chart using Value Channels. Ideally you want your stop placement to be below at least one core Value Channel boundary range. In addition to standard support and resistance and some key moving averages the market respects. This also works best when trading with the prevailing BIAS of the instrument (bull or bear).
Cryptos: Generally, that means you’re buying on retracements that fit the end of a structured move. The other option is using this in a clear up trending market where the pull backs are clearly being supported with buying.
FOREX: I built another indicator for FOREX search: ATRPIPS with SL
WTI: Helpful but I have different rules for when I trade WTI. I rely upon VCs and diagnal VCs much more when trading this.
Equities: Helpful but with the increase of volatility as well as uncertainty of Bias of the market-- this should be used as more of a guide than
What is most important is the actual percentage numbers but I've found graphing 1-3 of the actual ATRs is helpful. The rest just uncheck the checkbox in the options.
Indicator Overview:
Value 1 - 3 Period ATR (maroon)
Value 2 - 7 Period ATR (green)
Value 3 - 30 Period ATR (blue)
Value 4 - 90 Period ATR (blue, bold)
Value 5 - 1 Period ATR (green)
Value 6 - 1 Period ATR (red)
Value 6 – Prime Stop Loss Placement (maroon). This is the average of all above ATRs multiplied by 1.5
Value 7 - Move Left (red). Experimental value. This is the difference between (prime stop loss) and 1 day period move. Two ways to use this value. Use as a tighter stop loss placement. The other option is to use as a retrace target for purchase and using the Prime Stop Placement value as you’re stop loss.
All ATRs use the LOW price of the period. After testing both the low and close I’ve settled on the low to capture the most volatility you will typically experience.
Once again, this indicator should be used in conjunction with your proven trade system.
Also, by knowing what the values are within the indicator you could just eye ball what would be the best stop placement depending on the ATR or 1 or 2 ATRs you find most represent the volatility of what you are trading.
I will be expanding on this indicator by bringing in average measured moves as well as volume analysis and most likely with color changes and modifications.
Background:
While using and refining my trade system I've noticed that most moves happen in 3 periods. So we start there. The 7 period is good for a 24 hour market such as crypto (although weekend trading can be a hit or miss) and to some extent FOREX. The longer periods of 30 & 90 are to smooth out the data set. The final value of the 1 period is to bring a little more recency to the calculation.
Why multiply the average by 1.5? I've found in my own trading and system I built to be the best placement (in conjunction with VCs) to ensure you're stop isn't to close and is within the instrument you are trading volatility .
I'm looking at making this more intelligent as well as take into account volume and structured moves.

Current volatilityHello everyone.
Today an other small indicator that show the current volatility .
It works on all tickers ( crypto-currencies / others ) .
Method :
- ((high-low) * 100) / open
Hope it will be useful for you :)

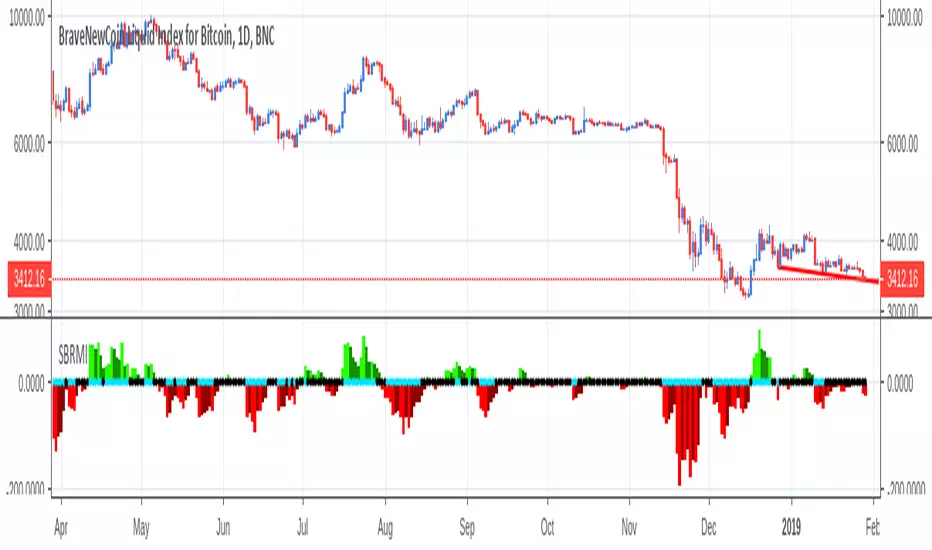
Saracino Bitcoin Relative Momentum IndexThis is a technical indicator developed by Andrea Saracino. It gives buy and sell signals and works best on the daily charts.
This indicator is better suited for Bitcoin. In fact, throughout the history, it gave very consistent buy and sell signals on this asset. Could also be used in other cryptocurrencies.
It consists of two components: the histogram and the dots.
HISTOGRAM
The histogram shows the actual momentum of a given price trend and can be used to check if the trend is strong or if it's getting weaker overtime. When the momentum is to the upside it is green, while it is red if the momentum is to the downside.
DOTS
This is the actual signal part. It consists of a series of dots that become blue if there is a clear signal in either way.
For example: if the momentum is going up and the dots become blue it is a buy signal, or a sell signal if momentum goes down.
DISCLAIMER
This is NOT the Saint Grail indicator. You must not open any trade using just this indicator. Create a strategy instead.
TJ Money FlowTJ Money Flow, one of the most frequently used indicators by me.
This indicator is a modification of the CMF and it has great use and multiple interpretation possibilities.
I like treating it like the addition of StochRSI to RSI, just that TJ-MoneyFlow works like a "behind the scenes tool" of the volume indicator.
The first most important thing about it are the spikes. I like seeing a movement either up or down, confirming it with a spike in the TJ-MF.
The next sparkle about it is the modification of movements down and movements up.
When it moves down, it is in blue color, when it moves up it is in green color.
This lets me compare the candle direction to the Money Flow direction.
Bigger clouds of the same color indicate strength in the direction.
One more step that I like using the TJ-MoneyFlow for is for divergences. Either divergences on a cloud itself, regardless from its color.
Or divergences over two separate clouds. The idea is, if there is a significant trend, then it should be confirmed by the MoneyFlow.
Like and Follow me and you will find this page interesting because I am a TA expert and professional day trader in crypto since 2012 that does daily updates and new posts about the hottest and most discussed coins.
Cheers, TJ

TJ-StochFinally I am setting this beast free.
This is one of my favorite indicators and it has everything what there is to Stochastic and Stochastic RSI.
The TJ-Stoch is a heavy mod and merge of Stochastic and Stochastic RSI.
There are some very important modifications on it.
- The green and red line at 40 and 90 points.
The stochastic lines like getting rejected at both lines.
A rejection at the 40 point line, from above or from below, mostly has an impulse move to it.
The same applies to the 90 point line.
The 90 point line nevertheless, has mostly an impulse move, when it is getting crossed down.
The stochastic lines staying above the 90 point line, are an indication for upcoming impulse moves.
- The lines itself
The stochastic lines have their original colors; blue for K , the faster moving line and orange for D the slower moving line.
Nevertheless, you can identify the original colors only, when those are ascending.
When the K and the D line are descending, those turn red, so you can immediately see what move is what and where it is actually descending or ascending.
- The crosses
One of the most important treats that Stochastic and Stochastic RSI have, are the crossovers. Sometimes these are hard to identify.
Therefore, a crossover is marked with a green cross at the top. A cross-down is marked with a red cross at the top.
Like and Follow me and you will find this page interesting because I am a TA expert and professional day trader in crypto since 2012 that does daily updates and new posts about the hottest and most discussed coins.
Cheers, TJ

Lazy Trend System 2019latest, more powerful and applicable on FX, indices, stocks and cryptocurrencies!

CryptoField - TREND Mode indicatorThe CryptoField TREND Mode indicator identifies the trend direction (uptrend or downtrend) and the mode (trending or sideways) of the market.
Uptrend when green
Downtrend when red
Sideways when orange
Trending when green or red
Basically the indicator works like a double moving average, but the algorithm reacts faster on movements and it tolerates "noisy"/volatile markets better which makes it more effective on crypto markets.
It can be applied to strategies or other indicators as a trend direction or market mode filter.

Ginux Strategy for CryptoDay trading for crypto currency
Tips are appreciated!
BTC: 3FzN8HipN4iXHUWgc5hkithbTQKfjjYHRW
ETH: 0x4B345f58D07Ae9608BBA3184B7FF16Ac07120e35

Aggregated Volume LTCBTCAggregates the LTC/BTC volume from multiple exchanges into a single indicator.
# Exchanges and Pairs
Included are only exchanges supported by TradingView:
* Binance
* Bitstamp
* Bittrex
* Coinbase
* Gemini
* Bitfinex
* Kraken
* Poloniex
* HitBTC
Many other top exchanges are not included, because they are not supported by TradingView.
# Inputs
By default the spot exchanges are selected. You can select also the other margin trading and derivatives exchanges.
# Contribute
Feel free to share any ideas and issues you have.
# Open Source
The code is open source @ github.com and uses the commonpine library github.com

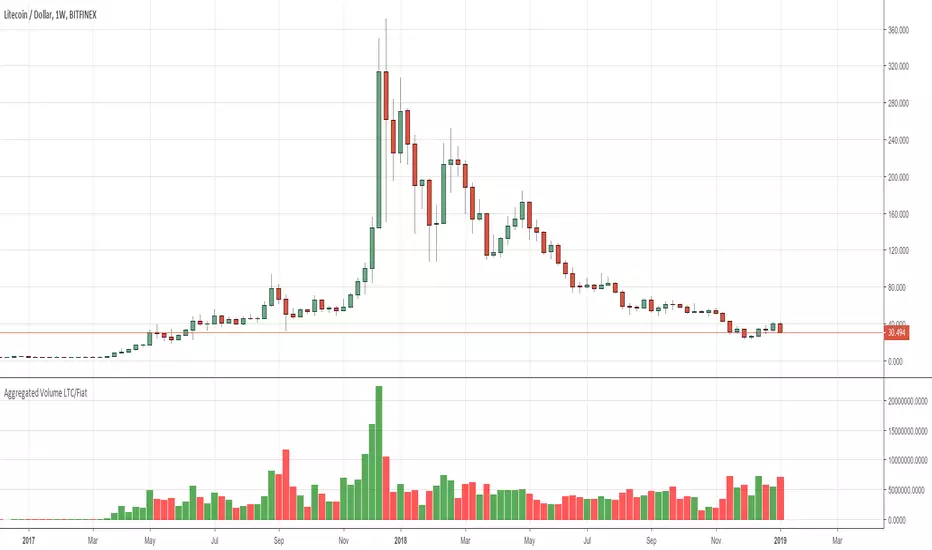
Aggregated Volume LTC/FiatAggregates the LTC/Fiat volume from multiple exchanges into a single indicator.
# Exchanges and Pairs
Included are only exchanges supported by TradingView:
* Binance
* Bitstamp
* Bittrex
* Coinbase
* Gemini
* Bitfinex
* Kraken
* Poloniex
* HitBTC
Many other top exchanges are not included, because they are not supported by TradingView.
The pair LTC/BTC is not included.
# Inputs
By default the spot exchanges are selected. You can select also the other margin trading and derivatives exchanges.
# Contribute
Feel free to share any ideas and issues you have.
# Open Source
The code is open source @ github.com and uses the commonpine library github.com
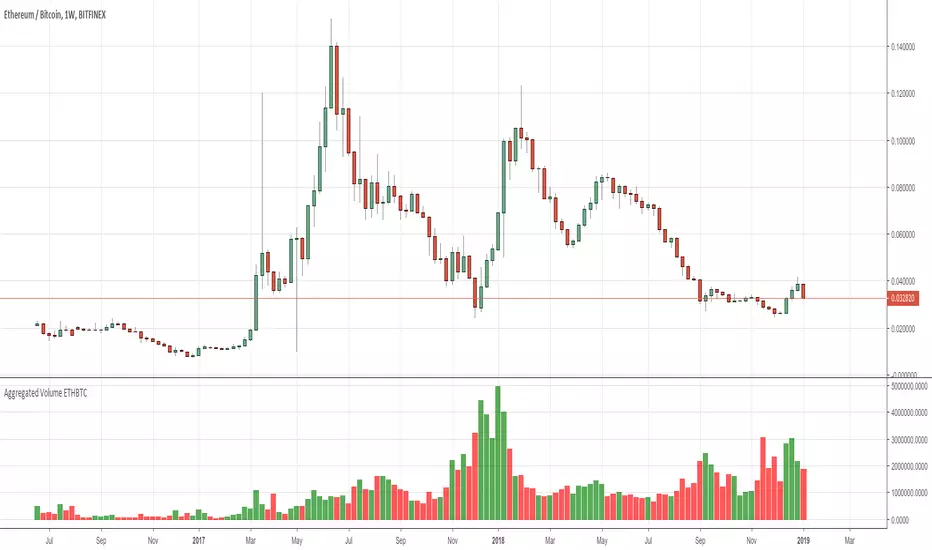
Aggregated Volume ETHBTCAggregates the ETH/BTC volume from multiple exchanges into a single indicator.
# Exchanges and Pairs
Included are only exchanges supported by TradingView:
* Binance
* Bitstamp
* Bittrex
* Coinbase
* Gemini
* Bitfinex
* Kraken
* Poloniex
* HitBTC
Excluded low volume exchanges (not in CMC Top):
* CEX.IO
Many other top exchanges are not included, because they are not supported by TradingView.
# Inputs
By default the spot exchanges are selected. You can select also the other margin trading and derivatives exchanges.
# Contribute
Feel free to share any ideas and issues you have.
# Open Source
The code is open source @ github.com and uses the commonpine library github.com
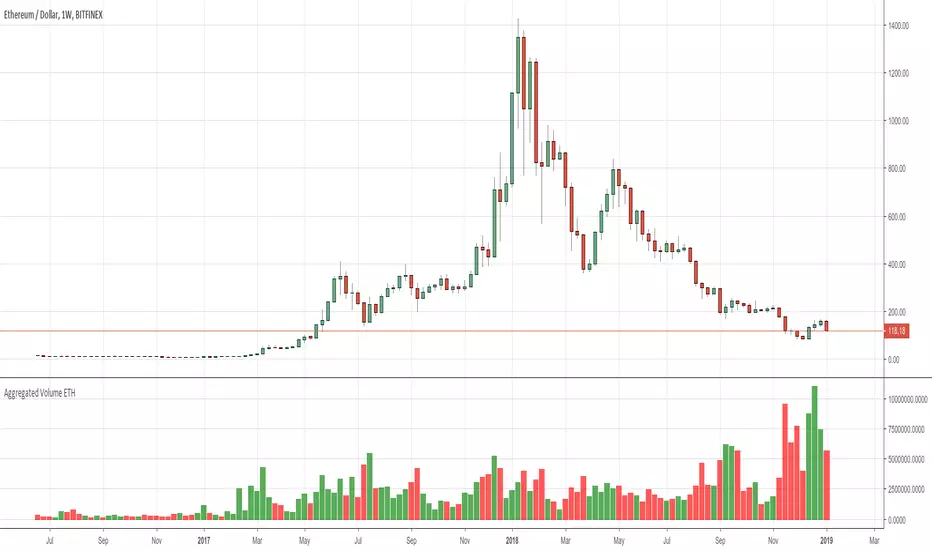
Aggregated Volume ETHAggregates the ETH/fiat volume from multiple exchanges into a single indicator.
# Exchanges and Pairs
Included are only exchanges supported by TradingView:
* Binance
* Bitstamp
* Bittrex
* Coinbase
* Gemini
* itBit
* Bitfinex
* Kraken
* Poloniex
* BitMEX
Excluded low volume exchanges (not in CMC Top):
* CEX . IO
* Coinfloor
Excluded exchange due to volume calculation by TV:
* HitBTC
Many other top exchanges are not included, because they are not supported by TradingView.
# Inputs
By default the spot exchanges are selected. You can select also the other margin trading and derivatives exchanges.
# Contribute
Feel free to share any ideas and issues you have.
# Open Source
The code is open source @ github.com and uses the commonpine library github.com
StratXPro Signals - Create your Strats like a ProStratXPro Signals - Create your Strats like a Pro
StratXPro introduces trading with multiple indicators and indicator settings for Buy, DCA and Sell orders.
Create your own strategy and combine up to five different indicators - each for buy, sell and dca buy in different time periods (one min - one week) in one chart at the same time!
We have implemented more than 15 major indicators that you can easily combine in your strategy and act like a pro.
All indicators are reimplemented and do not use the default TradingView indicators to overcome the inaccuracy when using different time periods.
With our backtesting version of this script (backtest.stratxpro.com) you can easily find your best strategy, find out about the indicators and visually check your best strategy.
Finally, run this script and create alerts to trade on the signals.
Have fun and discover the tremendous possibilities of StraXPro.
For access to the full version of StratXPro, please visit stratxpro.com for information.
DISCLAIMER
The creators of this script are not financial advisors, and as such, this script is no financial advice.
Anything seen or used within this script is here simply for educational purposes and it is up to you to decide what to do with this information and its results.
Please do your own research and verify any statements made before deciding to act upon them.
Do not commit any of your own resources to any trading or cryptocurrency activities without first verifying the accuracy of the information and know that your decisions are your own.


RSC Trend Trading Strategy v1.0Ready Set Crypto Trend Trading Back-testing Strategy v1.0
This is a backtesting strategy for those who are familiar with Doc Severson's (Ready Set Crypto) Trend Trading Class offered at Ready Set Crypto . It is published with permission.
I highly recommend that you attend the class to understand this strategy and use this to your advantage. There is way more than just some indicators to utilise this trading strategy successfully.
Please also see the matching indicator for this strategy: Ready Set Crypto Trend Trading Indicator .
Buy and Sell Calls are based on the following:
An Upper Donchian Channel of 20 days (default) or more, used to indicate buy signals
A Lower Donchian Channel of 10 days (default) or more, used to indicate exit signals
A 50 day Simple Moving Average (for entry filtering)
A 200 day Simple Moving Average (for entry filtering)
How to do back-testing with this:
Once you add this strategy to your chart, go to the " Strategy Tester " section at the bottom of the screen to see it's performance.
You will need to configure the strategy (just like you'd configure any indicator) to tailor it to your specific scenarios.
Note following:
TradingView does not support BTC, ETH, etc as currencies, so BTC and other trading pairs are not available for back-testing; You will have to use USD pairs
The backtesting will apply to your chart's time frame (candle times) - use daily time candles as the starting point
You will need to tailor the " Input " and " Properties " options (click on the little gear icon) to adjust to suit your needs/scenarios
The default settings are as follows:
Backtest the current chart/ticker for the period of 2016 to 2020,
With a single position of US$1000 and a 0.1% commission (no pyramiding, i.e. multiple buy entries),
By entering a single position (buy) when the price is above SMA 50 and 200 and a candle high touches DC 20,
And exiting the position when a candle low touches DC 10.
Look under the " Strategy Tester " pane for the back-testing overview, performance and list of trades. Or if you are looking at the Published Idea , the back-testing results are displayed at the bottom of the page.
Please like, Share and Comment, if you like this indicator.
Warning
The Buy and Sell calls are meaningless and must not be auctioned without a thorough understanding of this trading strategy and the full consideration of the entry and exit conditions.
Please use this indicator at your own risk. The publisher does not accept any responsibility for its performance or any implications.

Cyatophilum Bands Pro Trader [ALERTSETUP]A Multi Timeframe Indicator for trading cryptocurrency and other assets
Presentation Page
HOW IT WORKS
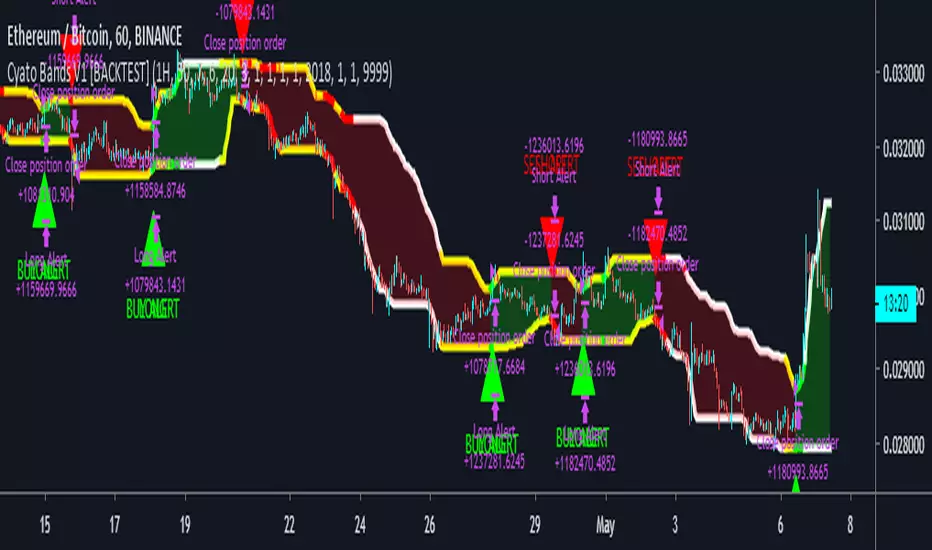
The indicator mainly consists of what I call "Cyatophilum Bands", who can be used as either Trend lines or Support/Resistance. The color indicates the current Trend. Buy and Sell signals trigger upon Trend Reversal Breakouts.
These alerts can be used with automated trading systems. They correspond to the big green and red triangles.
For daytraders, there is an option to activate Long and Short signals during a Trend. It can also be used as re-entry points if you missed a major breakout. They correspond to the small triangles.
If you trade BTCUSD, I created an option that will allow you to configure your script on any timeframe from 5M to 1D in one click.
If you do not trade BTCUSD, you can use a custom setup (See the Presentation Page )
This indicators also works on other assets such as Oil Futures or other cryptocurrency pairs such as ETH/BTC.
The script comes with two versions:
The alert Setup is used creating automated alerts
The Backtest Version that will help you see the results on past data. You can choose to enable or disable shorts results.
HOW TO USE
Once I granted you access, you will receive a notification. Add both indicators to the chart. Use the Backtest version to find the best configuration (BTCUSD is already pre-configured. I post configurations on my Discord Server, and you can ask me for help). Then apply this configuration to the Alert Setup script. Finally, create the alerts.
Before you ask, the script does not repaint. I made sure to not use the security function which I know is bugged right now.
Get the indicator today !
Purchase on my website
NOTE
If you purchase the Indicator you will get access to my past indicators as well!

Cyatophilum Bands Pro Trader [BACKTEST]A Multi Timeframe Indicator for trading cryptocurrency and other assets
Presentation Page
HOW IT WORKS
The indicator mainly consists of what I call "Cyatophilum Bands", who can be used as either Trend lines or Support/Resistance. The color indicates the current Trend. Buy and Sell signals trigger upon Trend Reversal Breakouts.
These alerts can be used with automated trading systems. They correspond to the big green and red triangles.
For daytraders, there is an option to activate Long and Short signals during a Trend. It can also be used as re-entry points if you missed a major breakout. They correspond to the small triangles.
If you trade BTCUSD, I created an option that will allow you to configure your script on any timeframe from 5M to 1D in one click.
If you do not trade BTCUSD, you can use a custom setup (See the Presentation Page )
This indicators also works on other assets such as Oil Futures or other cryptocurrency pairs such as ETH/BTC.
The script comes with two versions:
The alert Setup is used creating automated alerts
The Backtest Version that will help you see the results on past data. You can choose to enable or disable shorts results.
HOW TO USE
Once I granted you access, you will receive a notification. Add both indicators to the chart. Use the Backtest version to find the best configuration (BTCUSD is already pre-configured. I post configurations on my Discord Server, and you can ask me for help). Then apply this configuration to the Alert Setup script. Finally, create the alerts.
Before you ask, the script does not repaint. I made sure to not use the security function which I know is bugged right now.
Get the indicator today !
Purchase on my website
NOTE
If you purchase the Indicator you will get access to my past indicators as well!