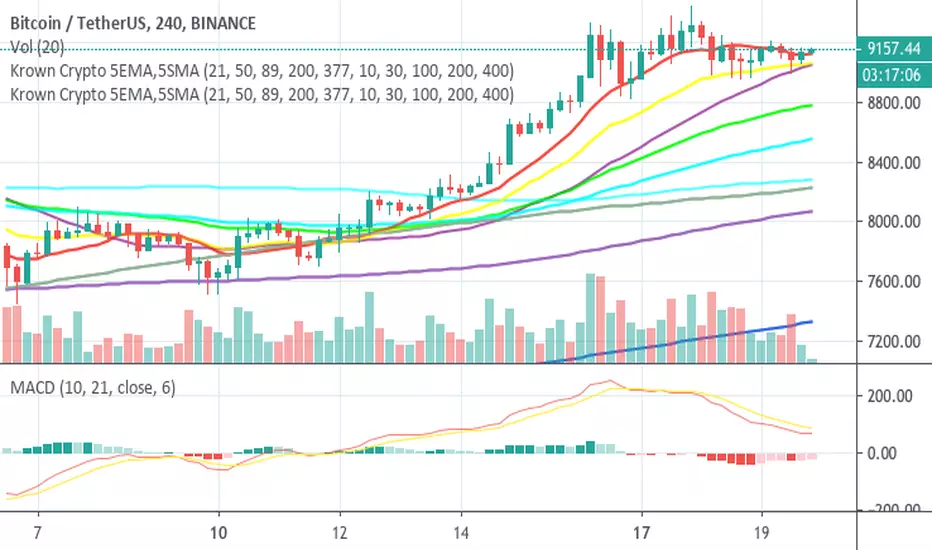
Krown Crypto 5EMA,5SMAScript contains 5 Exponential Moving Averages and 5 Simple Moving Averages with adjustable colours and values.
Script has been checked to ensure correct input variables, with a minalmised title.
The default colours and values have been inspired by Krown Crypto Cave; which can be found on youtube.
在脚本中搜索"crypto"
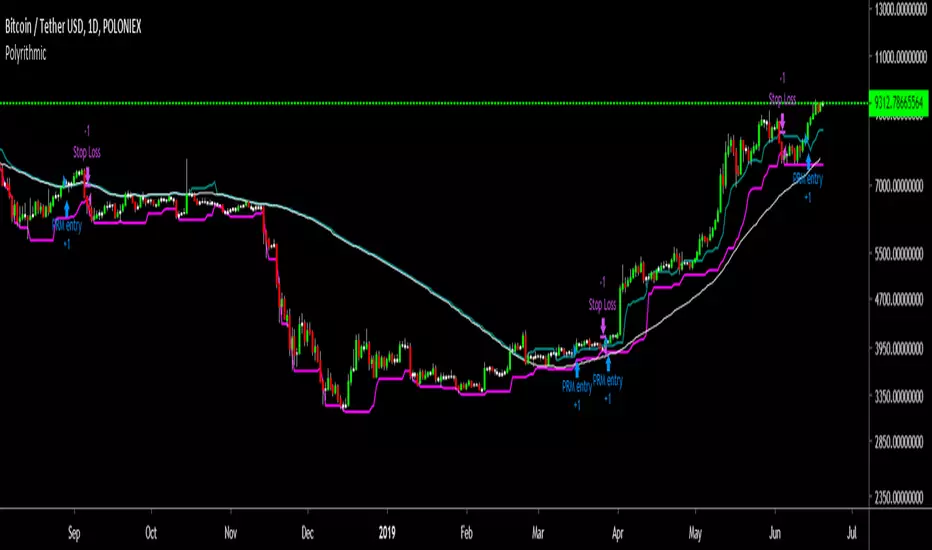
Polyrithmic Trend 2This script is designed to work on cryptocurrency.
This idea is to capture large amounts of the trend but to be able to get out when the support begins to break.
To use this script:
Buy signal:
- When the price is above the white moving average
- When the price goes over the buy line (higher / blue)
- When trading view says buy
Sell signal
- Move a stop up with the pink line and wait to be stopped out
SuperSpecial_Buy_And_Sell Indicator (Crypto,Forex,Stocks)This indicator can be used on Crypto coins, Forex and Stocks. Don't work as expected in volatile market where there are sudden dips or lifts.
Please trade with care and after reading other indicators in conjunction with this.
Disclaimer: Please use the indicator at your own risk, the publisher don't take any responsibility for your loss.

Main Indicators @ MadnessCryptoInspired by veteran contributors of tradingview
Indicators list:
1. Main indicators: Moving average collection, Ichimoku, Bollinger Bands, fibonanci, simplize candlestick price action...
2. Price Action indicators: Candlesticks of (almost) any kinds. Harmonic Patterns: ABCD, Alt Bat, Butterfly, Crab, Wolf Wave, Head and Shoulders, Triangle...
3. Advanced indicators: top/bot finder, breakout detector, unpopular indicators
4. Signal & backtest tools: focus on two main factors: percent profitable & profit factor
Cheers,
Madness Crypto
-----------------------------------------------------------
Incase if those's scripts are useful, you can buy me a coffee
ETH & ERC20 tokens: 0xA2F57Cc46A5268F16A0224a81EDe7154218Ce890
Bitcoin: 1PTSbWK6snVSULBXhfx5TD9pJkkYCDe4PC
Binance & BEP2 tokens: bnb1tlxgpnguzq0w3w6myhd0t3d2j9wqd2pzpkudpc

Equilibrium - Strategy This is a straight forward strategy:
1. Buy at signal
2. Set stop-loss at red line
3. Sell at signal or when stop-loss triggers
Designed for 30min. crypto charts
Always backtest before use

Pump Finder v1.0Generally speaking, when a big pump occurs one can expect the price to trend upward.
This script is by default well suited for timeframes larger than 15m. Use on smaller timeframes at your own risk.
When combined with basic TA like trendlines, support and resistance this can be a very powerful indicator.
This indicator performs well for the larger volume crypto's like BTC, BNB, ETH etc. See snapshots below.
Be aware:
- After multiple pumps, the chance of trend reversal becomes more likely.
- False breakouts.
- Always do your own research.
If you have any suggestions, feel free to let me know.

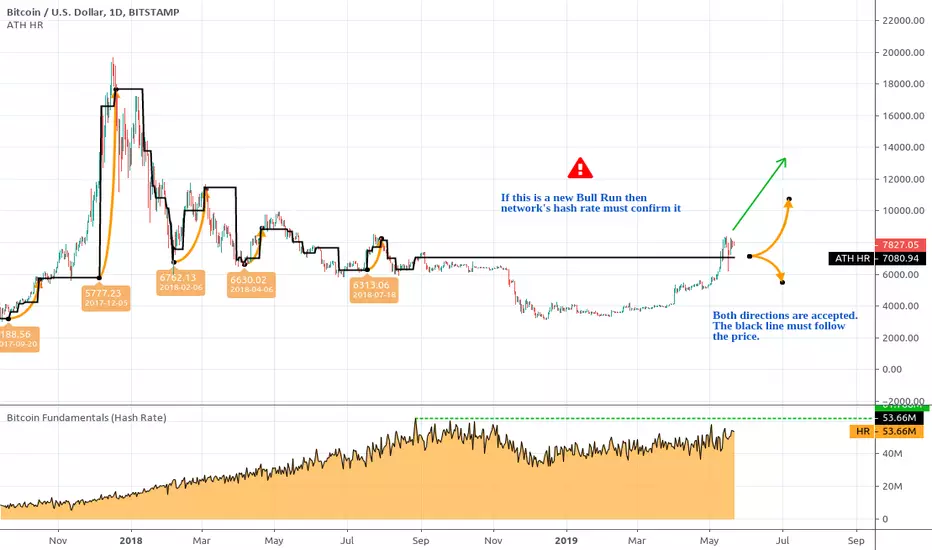
Bitcoin All-Time High (ATH) Hash Rate Level An experimental Bitcoin TotheMoon confirmation tool. Represents a mapping of Bitcoin's All-Time Hash Rate to the corresponding Bitcoin's price on the chart.
As always, you can support the author with donations via PayPal or crypto.
Ichimoku Analyzer☑️Ichimoku Analyzer
-This indicator automatically analyzes the Ichimoku conditions.
- Long and Short signals.
- Allows you to add an MA filter.
-Works in any timeframe or market like Forex, Crypto, Commodities even Stocks.
-Recommended manual trading and bots.
Do you need an Script or an expert adviser for Forex, contact our coding service!
Get this indicator today! contact us.

Market God v6Advance your trading game by applying our TA based indicator-study on your charts. Market God v6 is a tool that can be added to any chart, timeframe, or ticker on https://tradingview.com, and suggests the situation at hand as an opportunity to buy or sell you interests.
Market God v6 Product Description
Advance and Improve your understanding of price movement using the Market God v6 Trading Study (accessed via tradingview.com)
* Set alerts to be delivered via email or SMS (See TradingView.com for limitations that may apply, based on your Tradingview account type)
* Quickly identify market trends with visual buy/sell alerts on chart
* Access charts on-the-go via Tradingview mobile app
* Apply study to any symbol within the entire Tradingview library
* Use on any timeframe available to you on Tradingview
Through use of tradingview.com’s advanced Pine Script programming language, I have spent thousands of hours to find the rights combination that has resulted in the indicator study you see today. That said, it is imperative to understand that this study is not a guarantee profit & should be far from the only reason you enter a trade. It is highly recommended that you backtest, or paper trade before using this study, as it is intended to be a tool, and not the end-all-be-all.
When starting, my goal was clear: to create a study that could suggest consistent, reliable, and accurate trades, at a rate of success that was either equal to, or better than if I were doing it myself. Ideally, I figured that if I could take my own personal buy/sell criteria, standardize it, and create an system that informed me once my own criteria was met, it would allow me to succeed on a more consistent basis, and allow me to focus on other projects.
But lets pull it back to way before this indicator was even on the map – to the middle of 2018, specifically the middle of crypto-winter. Like many, I started by doing something I believe every trader or investor should do: writing down the exact criteria that I would ultimately require that I hold myself, in order to enter or exit a position. I then demanded that I abide by that criteria when making any decision in trading. This was relatively easy, and also forced me to really understand where I went wrong, each time I would losing trade.
While establishing the trade plan, I ran through every study/indicator I used personally already, and utilized online resources to understand what made those indicators give the readings they do, and the various ways price movement and volume can be used to calculate trends.
By taking the wealth of knowledge available online, we have successfully created a study that applies these methods of TA, and standardizes a system of trading that was successfully established in the bear market.

TrendMaster EquilibriumTrendMaster Equilibrium
TrendMaster Equilibrium is a composite of MokuMaster and KishokuMaster in one indicator. It is designed to complement our flagship indicator, TrendMaster, allowing the user to examine all three indicators on a single chart. The purpose of TrendMaster Equilibrium is to provide a sentiment filter when assessing possible Trendmaster entries. When all three indicators align, we have equilibrium and can feel confident to take the trade. The indicator is optimised for weekly, daily and 4-hour candlesticks and can be used for all trending markets.
MokuMaster
MokuMaster is based on Ichimoku and its colours are derived from Ichimoku's depiction of trend conditions. When examining charts for directional bias you can simply check the colour of MokuMaster.
Bright Green - Resolutely Bullish
Green - Bullish
Blue - Neutral
Pink - Bearish
Red - Resolutely Bearish
These categories represent the interactions between Price, the Tenkan-sen, the Kijun-sen, the Kumo and the Chikou Span. This can be overwhelming if you are not an accomplished Ichimoku trader.
MokuMaster allows you to view these interactions without the difficulty of interpreting what they mean.
KishokuMaster
KishokuMaster is a very simple indicator designed to provide an immediate representation of the ‘mood’ of the market. It provides an optimal balance of lag and smoothing to help traders establish a Bullish or Bearish bias. The underlying logic is based on Alan Hull's weighting techniques. KishokuMaster generally gives an early warning of a trend reversal.
Confluence
When assessing a TrendMaster entry, you can use TrendMaster Equilibrium as a simple checklist as shown in the annotated chart below. By taking entries that satisfy all criteria, you increase your likelihood of a successful outcome.
Our Story
Founded in 2018 by IchimokuScholar and C00kie, TrendMaster is a team that produces technical analysis indicators with an emphasis on simplicity and noise reduction. We support a large community with educational content, automated market scanners and mentoring in our private chat rooms. We produce technical analysis indicators geared primarily towards the emerging Cryptocurrency asset class. We provide educational material to assist trader development and host a large online trend following community. All of our products are designed to help traders distinguish relevant information from background noise. Our indicators encourage disciplined trade management to maximise the opportunity captured while minimising losses.
IchimokuScholar
IchimokuScholar – In 2017 I retired from a career in higher education to focus on Trading. I like to trade long term trends, focusing primarily on continuation setups. I am dedicated to sharing my knowledge of trading and take great pleasure in simplifying technical analysis for newer traders.
C00kie
I started trading crypto in 2017 and immediately started coding a bunch of tools to improve my quality of life. Some definitely worked out better than others. Like to trade the higher timeframes and drawing horizontal lines on charts. I am also pretty much obligated to like cookies.

TrendMaster PremiumTrendMaster
TrendMaster is a complete trend following system with strict entry, exit and trade management criteria. The indicator is optimised for weekly, daily and 4-hour candlesticks and can be used for all trending markets. It was developed primarily for less experienced traders that struggle to determine relevant information from irrelevant information when viewing a candlestick chart. The indicator was built to solve the problem that all new traders face.
Setting Up The Indicator
After purchase, open the TradingView indicator library. Under the Invite-Only Scripts section, you will see TrendMaster. Add it to your chart. Next, you must customise your theme settings to allow TrendMaster to take over control of your candle colours. You can find a complete set-up tutorial on our website.
The Cloud
The indicator includes a moving average cloud which serves as a visual guide to local support and resistance. For a signal candle to print, price must trade above the moving average cloud and above the medium-term trend. By requiring multiple criteria we drastically reduce false entries. When price exits the cloud to the upside it typically trends above and finds support at the cloud during retracements.
Candle Colours
By default, TrendMaster will colour your candles in black and white. White candles indicate an uptrend in an asset and the candles will not change colour until the trend has reversed and a counter-trend signal has been printed. Black candles indicate a downtrend, they will remain black until a counter-trend long signal candle has been printed.
Signal candles
A signal candle is printed when the price of an asset closes above or below the moving average cloud and the medium term trend moving average. By requiring two criteria for a single candle to print we will see a drastic reduction in the number of false signals.
The TrendMaster entry technique further reduces the likelihood of false entries. To enter a trade we do not buy the signal candle immediately. Instead, we treat the signal candle as an indication that a trend change is possible. We want to see confirmation of this trend before making an entry. To enter we place a pending order a few ticks above or below the high or low of the signal candle. By doing this we only enter a trade when the asset has shown a continuation in the direction of the suggested trend change.
Once a trade has been taken we remain in that trade until either we have been stopped out on the break of a Williams fractal or the trend has reversed by printing an opposite to trend signal candle. It is important that we remain with the trend to ensure that we capture the maximum opportunity available.
If you would like to use TrendMaster or any of our other Indicators, please visit my site. Here you can purchase one of our packages which include indicators, market scanner bots and a large Discord community. You will also find educational content and how to guides for our indicators.
Our Story
Founded in 2018 by IchimokuScholar and C00kie, TrendMaster is a team that produces technical analysis indicators with an emphasis on simplicity and noise reduction. We support a large community with educational content, automated market scanners and mentoring in our private chat rooms. We produce technical analysis indicators geared primarily towards the emerging Cryptocurrency asset class. We provide educational material to assist trader development and host a large online trend following community. All of our products are designed to help traders distinguish relevant information from background noise. Our indicators encourage disciplined trade management to maximise the opportunity captured while minimising losses.
IchimokuScholar
IchimokuScholar – In 2017 I retired from a career in higher education to focus on Trading. I like to trade long term trends, focusing primarily on continuation setups. I am dedicated to sharing my knowledge of trading and take great pleasure in simplifying technical analysis for newer traders.
C00kie
I started trading crypto in 2017 and immediately started coding a bunch of tools to improve my quality of life. Some definitely worked out better than others. Like to trade the higher timeframes and drawing horizontal lines on charts. I am also pretty much obligated to like cookies.

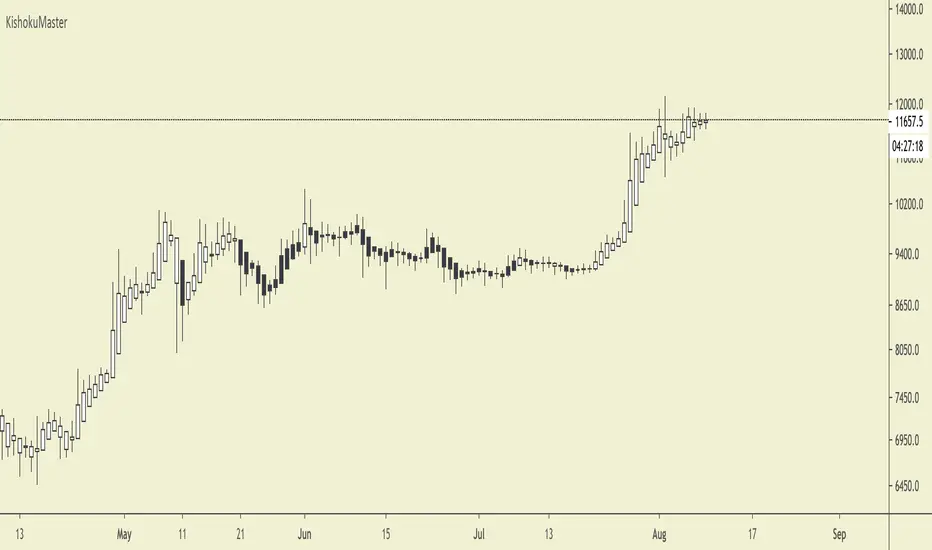
KishokuMasterKishokuMaster
KishokuMaster is a very simple indicator designed to provide an immediate representation of the ‘mood’ of the market. It provides an optimal balance of lag and smoothing to help traders establish a Bullish or Bearish bias. The underlying logic is based on Alan Hull's weighting techniques.
The indicator is optimised for weekly, daily and 4-hour candlesticks and can be used for all trending markets such as crypto, forex or stocks. It can be used as a standalone indicator, or to provide confluence when assessing TrendMaster entry opportunities.
Setting Up The Indicator
KishokuMaster can be used with either regular Japanese candlesticks or Heikin-Ashi candlesticks. Using Heikin-Ashi decreases the likelihood of whipsaw losses and provides a more stable visual representation of the trend. You can customise to any theme of your choice provided the candle borders and wicks are set to a uniform colour that contrasts the chart background.
Candle Colours
By default, KishokuMaster will colour your candles in black and white. White candles indicate an uptrend in an asset and the candles will not change colour until the trend has reversed. Black candles indicate a downtrend, they will remain black until a trend reversal occurs.
Our Story
Founded in 2018 by IchimokuScholar and C00kie, TrendMaster is a team that produces technical analysis indicators with an emphasis on simplicity and noise reduction. We support a large community with educational content, automated market scanners and mentoring in our private chat rooms. We produce technical analysis indicators geared primarily towards the emerging Cryptocurrency asset class. We provide educational material to assist trader development and host a large online trend following community. All of our products are designed to help traders distinguish relevant information from background noise. Our indicators encourage disciplined trade management to maximise the opportunity captured while minimising losses.
IchimokuScholar
IchimokuScholar – In 2017 I retired from a career in higher education to focus on Trading. I like to trade long term trends, focusing primarily on continuation setups. I am dedicated to sharing my knowledge of trading and take great pleasure in simplifying technical analysis for newer traders.
C00kie
I started trading crypto in 2017 and immediately started coding a bunch of tools to improve my quality of life. Some definitely worked out better than others. Like to trade the higher timeframes and drawing horizontal lines on charts. I am also pretty much obligated to like cookies.
TrendMaster TrialTrendMaster Trial
This is the trial version of TrendMaster. It includes the Cloud and the candle colouring rules but does not provide the entry, exit and stop loss management of the full version.
TrendMaster is a complete trend following system with strict entry, exit and trade management criteria. The indicator is optimised for weekly, daily and 4-hour candlesticks and can be used for all trending markets such as crypto, forex or stocks. It was developed primarily for less experienced traders that struggle to determine relevant information from irrelevant information when viewing a candlestick chart. The indicator was built to solve the problem that all new traders face.
The Cloud
The indicator includes a moving average cloud which serves as a visual guide to local support and resistance. When price exits the cloud to the upside it typically trends above and finds support at the cloud during retracements.
Candle Colours
By default, TrendMaster will colour your candles in black and white. White candles indicate an uptrend in an asset and the candles will not change colour until the trend has reversed and a counter-trend signal has been printed. Black candles indicate a downtrend, they will remain black until a counter-trend long signal candle has been printed.
Setting Up The Indicator
TrendMaster is optimised for Heikin-Ashi candles. Using candles with smoothing applied decreases the likelihood of whipsaw losses and provides a stable visual representation of the trend. Ensure you have applied Heikin-Ashi candles to your chart before continuing. You can customise to any style of your choice provided the candle borders and wicks are set to a uniform colour that contrasts the chart background.
Entries and Exits
A long signal candle is a white Heikin-Ashi candle that closes above the cloud. A short signal candle is a white Heikin-Ashi candle that closes below the cloud. Entries are taken with a pending order placed at the wick with a reasonable margin for error.
Upgrading
The full version of TrendMaster contains significantly more functionality including coloured signal candles, stop loss and trailing take profit management, alerts and much more.
Our Story
Founded in 2018 by IchimokuScholar and C00kie, TrendMaster is a team that produces technical analysis indicators with an emphasis on simplicity and noise reduction. We support a large community with educational content, automated market scanners and mentoring in our private chat rooms. We produce technical analysis indicators geared primarily towards the emerging Cryptocurrency asset class. We provide educational material to assist trader development and host a large online trend following community. All of our products are designed to help traders distinguish relevant information from background noise. Our indicators encourage disciplined trade management to maximise the opportunity captured while minimising losses.
IchimokuScholar
IchimokuScholar – In 2017 I retired from a career in higher education to focus on Trading. I like to trade long term trends, focusing primarily on continuation setups. I am dedicated to sharing my knowledge of trading and take great pleasure in simplifying technical analysis for newer traders.
C00kie
I started trading crypto in 2017 and immediately started coding a bunch of tools to improve my quality of life. Some definitely worked out better than others. Like to trade the higher timeframes and drawing horizontal lines on charts. I am also pretty much obligated to like cookies.

MokuMasterMokuMaster
MokuMaster is an advanced indicator built on Ichimoku Kinko Hyo.
Perhaps the most powerful function of Ichimoku charts is their depiction of trend conditions at a single glance. This is likely the original purpose of the technique, Ichimoku Kinko Hyo loosely translates to ‘one glance equilibrium chart’. When examining charts we use Ichimoku to determine directional bias. Should we be, 'Resolutely bullish', 'Bullish', 'Neutral', 'Bearish' or 'Resolutely Bearish'.
These categories are derived from the interactions between Price, the Tenkan-sen, the Kijun-sen, the Kumo and the Chikou Span. This can be overwhelming if you are not an accomplished Ichimoku trader.
MokuMaster allows you to view these interactions without the difficulty of interpreting what they mean. The definitions displayed below demonstrate how to use MokuMaster to determine directional bias.
Bright Green - Resolutely Bullish
Green - Bullish
Blue - Neutral
Pink - Bearish
Red - Resolutely Bearish
MokuMaster is designed to assist traders in establishing directional bias and not to replace traditional entry and exit techniques. We recommend using it in conjunction with TrendMaster for best results.
Our Story
Founded in 2018 by IchimokuScholar and C00kie, TrendMaster is a team that produces technical analysis indicators with an emphasis on simplicity and noise reduction. We support a large community with educational content, automated market scanners and mentoring in our private chat rooms. We produce technical analysis indicators geared primarily towards the emerging Cryptocurrency asset class. We provide educational material to assist trader development and host a large online trend following community. All of our products are designed to help traders distinguish relevant information from background noise. Our indicators encourage disciplined trade management to maximise the opportunity captured while minimising losses.
IchimokuScholar
IchimokuScholar – In 2017 I retired from a career in higher education to focus on Trading. I like to trade long term trends, focusing primarily on continuation setups. I am dedicated to sharing my knowledge of trading and take great pleasure in simplifying technical analysis for newer traders.
C00kie
I started trading crypto in 2017 and immediately started coding a bunch of tools to improve my quality of life. Some definitely worked out better than others. Like to trade the higher timeframes and drawing horizontal lines on charts. I am also pretty much obligated to like cookies.

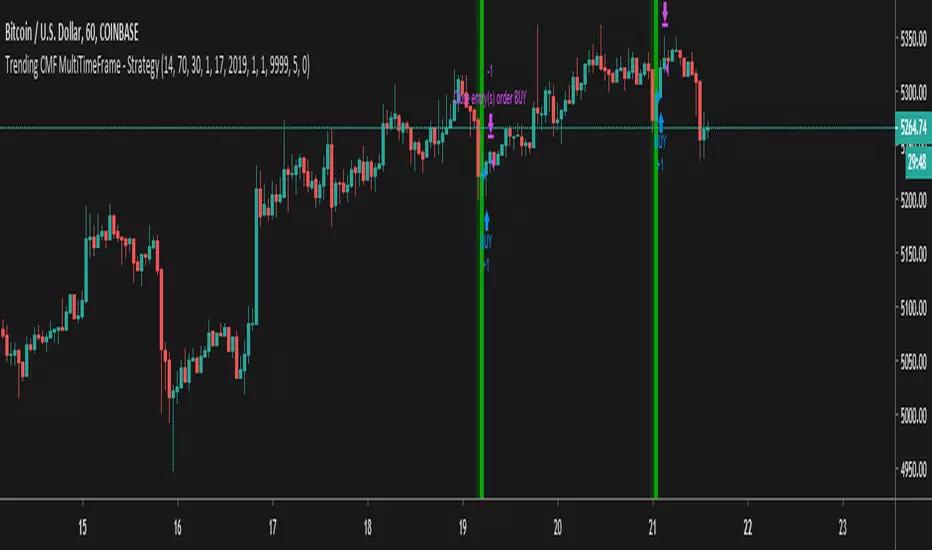
Trending CMF MultiTimeFrame - Strategythis is the strategy for the script below
Multi time frame crypto trader
SHA & MMAR Strategy Alert IndicatorIndicator w/ alerts for 'Slow-Heiken Ashi & Madrid Moving Average Strategy'.
High win-percentage with cryptocurrencies on a 1H timechart.
Ichimoku Cloud Trend Long AlertsFantastic trading system allowing for high probability trading.
I prefer to use lesser timeframes, like in this example, for lower probability per trade but higher % profits over time. On some timeframes probability can be between 70-100%.
Settings for cryptocurrency:
Conversion: 20
Base: 60
Span B: 120
Displacement: 30
Enjoy!
TIP: I've noticed that when a new coin launches after IEO this script can work on small timeframes (15m) and with the Base and Span settings halved. This usually gives good results if ran for approx. five days from launch. Particularly with Huobi and Binance launches.

Ichimoku Trend Long StrategyFantastic trading system allowing for high probability trading.
I prefer to use lesser timeframes, like in this example, for lower probability per trade but higher % profits over time. On some timeframes probability can be between 70-100%.
Settings for cryptocurrency:
Conversion: 20
Base: 60
Span B: 120
Displacement: 30
Enjoy!
Please contact me for version with alerts for use on bots like ProfitTrailer, 3Commas, Gunbot etc.

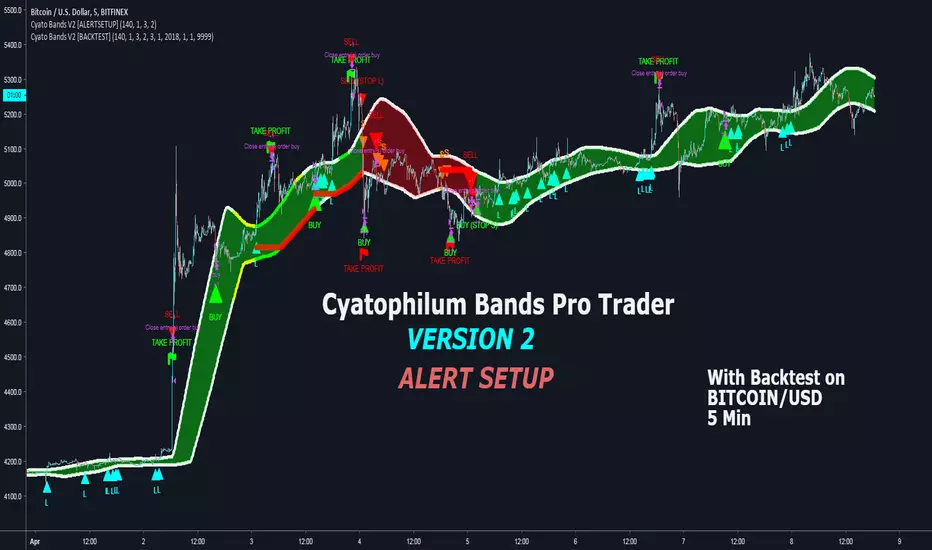
Cyatophilum Bands Pro Trader V2 [ALERTSETUP]An Original Automated Strategy that can be used for Manual or Bot Trading, on any timeframe and market.
Presentation page with video
How it works
The Cyatophilum Bands behave as either Trend Lines during a bear or bull market, or Support and Resistance during a Flat Market. Buy and Sell signals trigger upon Trend Reversal Breakouts.
Stop Loss System
An integrated Stop Loss System. Helps reducing risk by creating buy and sell signals when the price breaks through the red line.
Trailing Stop
Transform your Stop Loss into a Trailing Stop Loss. The red line will increase/decrease to secure profits.
Take Profit
Secure your profits using this new feature! When a flag appears, a buy/sell signal will trigger.
Re-Entries
A feature that can be helpful when using Take Profit or for manual trading in case you missed a trade.
Use it literally Anywhere
This indicator can be used on any timeframe and market (not only cryptocurrencies).
Backtest Below
Note: can be easily automated with Autoview
Get the indicator today!

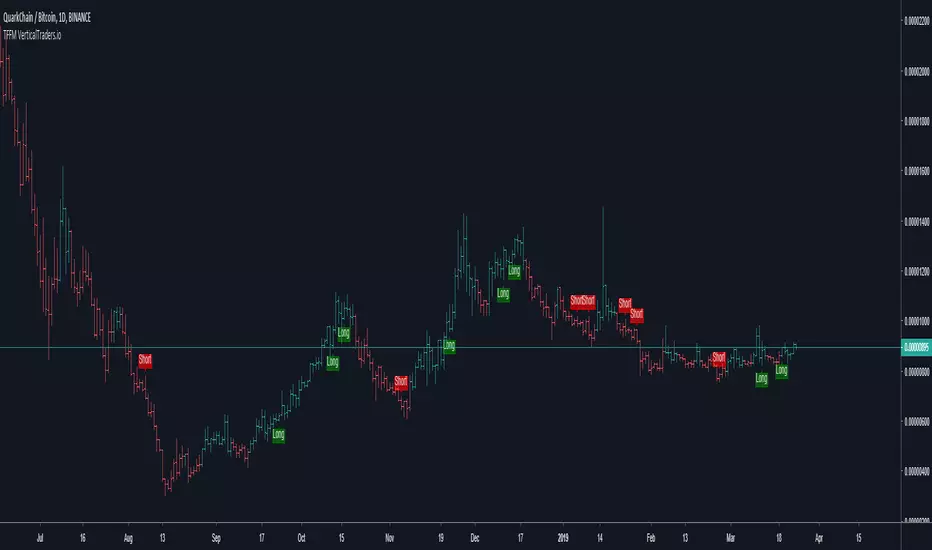
TFFM-This algorithm takes in consideration Media averages, Volatility Movements, trend direction and other Mathematical Properties.
-After adding this signal on TradingView, you will get notified every of potential long and short points triggered by the indicator.
-This signal alerts you anytime bars form a bullish or bearish pattern and price start to move in the suggested direction.
-It works in any time frame or market like Forex, Crypto, Commodities even Stocks.
-Recommended for bots or manual trading.
Do you need an Script or an expert adviser for Forex, contact our coding service:
Get this indicator today! contact us
Premium 3-This algorithm takes in consideration Media averages, Volatility Movements and other Mathematical Properties.
-Allows you to find divergences and price trends in a simple way
-After adding this signal on TradingView, you will see potential long and short according to the colors of the candlesticks.
-It works in any time frame or market like Forex, Crypto, Commodities even Stocks.
Bullish Strength
Olive: weak
Dark green: medium
Light green: strong
Lime: very strong
Bearish strength
Fuchsia: weak
Maron: medium
Red: strong
Intense red: very strong
Do you need an Script or an expert adviser for Forex, contact our coding service
Get this indicator today! contact us

Premium 2-This algorithm takes in consideration Media averages, Volatility Movements, trend direction and other Mathematical Properties.
-After adding this signal on TradingView, you will get notified every of potential long and short points triggered by the indicator.
-This signal alerts you anytime bars form a bullish or bearish pattern and price start to move in the suggested direction.
-It works in any time frame or market like Forex, Crypto, Commodities even Stocks.
-Recommended for bots or manual trading.
Do you need an Script or an expert adviser for Forex, contact our coding service: coding@verticaltraders.io
Get this indicator today! contact us
