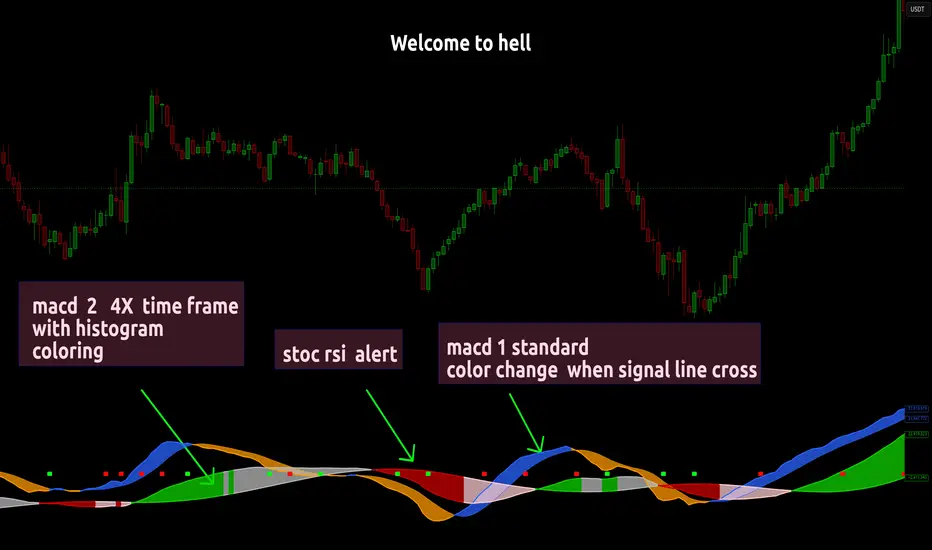
Dual MACD With Pilot Background + + Stoch RSI Alert HELL 2macd 1 chart time macd 2 4x chart time with over bought and over sold stoc rsi alerts
在脚本中搜索"stoch"
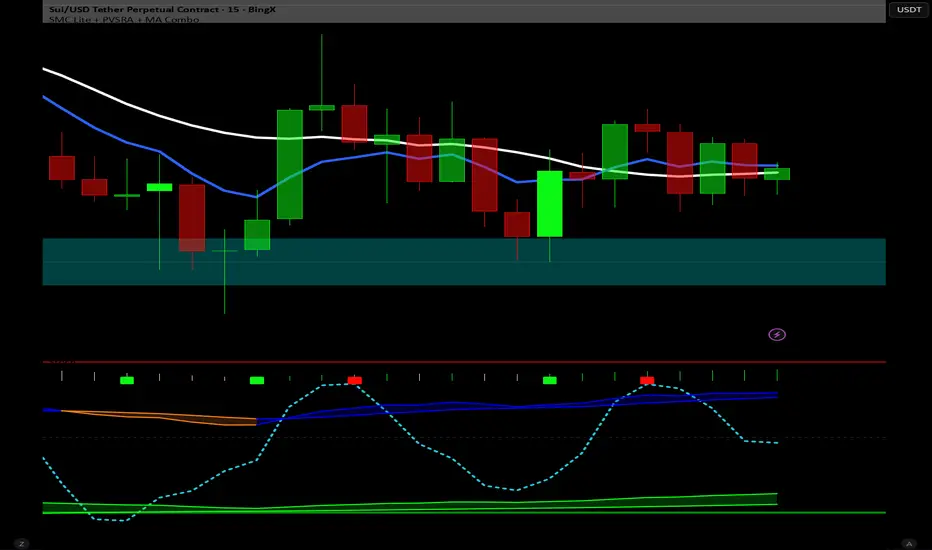
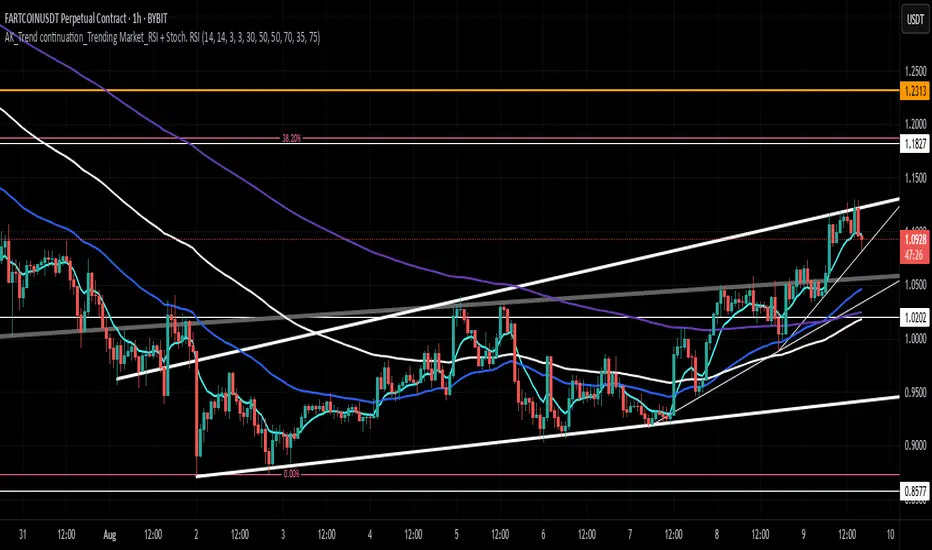
AK_Trend continuation_Trending Market_RSI + Stoch. RSIIndicator to predict where to buy and sell based on market structure. Most applicable in a trending market. Based on RSI and Stochastic RSI
RSS-Stochastik [afterworktrading]Hi all,
this is the first script from the series "afterworktrading". The goal is to develop and provide tools for traders with a fulltime job or little time for trading/analyzing charts.
Over time some of the scripts will also be linked to complete trading systems.
Let's start with my favourite one, the "RSS-Stochastik" with alert function.
The RSS-concept (Relative Spread Strength, developed by Ian Copsey) is based on the variance between a "short" and a "long" moving averages (or "slow" and "fast"), here between two EMA.
This variance is calculated and plotted in a RSI-diagram to show "overbought" and "oversold" conditions, helping to identify an ideal entry setup for trend continuation or catching a possible reversal.
Compared to the conventional RSI etc., possible reversal or trend continuation areas are often better represented in terms of quality, as an example see the Amazon-Chart.
The EMA-values, limit value thresholds and background colors can be set in the script. As a special feature, alarms can be set to be notified when a value has reached the extreme range. This reduces the screen time to the minimum.
In my personal trading, this indicator forms the basis for almost all trades, but is not a pure signal indicator on its own.
However, the informative value can be further improved if volume or support/resistance zones etc. are linked to the RSS, see example NASDAQ future with support zone price or 200 EMA.
Example for a possible RSS-Trade-Setup:
- choose an asset with a strong trend
- set alerts for crossing the oversold or overbought condition in direction of the trend
- in case of an alert check possible support/resistance areas on the current chart level (EMA, price zones, volume zones, anchored VWAP etc.)
- trade in the direction of the trend using your preferred entry setup
In my opinion, the system can be used very well, especially in trend phases, in order to obtain optimal entries.
Does it works also on lower timeframes?
Yes, it might work on every timeframe with a strong trend of high quality. Please see attached a 5m-Chart of GPBUSD-pair, notice the signal quality in direction of the trend.
Like every trading system this is not the "holy grail setup" and you will have losing trades. But handling this indicator with care you can have better entries especially in trend direction with less screen time due to the alert function.
Good luck with it! Further indicators will be published in the coming months, some will also be based on the RSS system.
As always: no liability for losing trades, no investment advice etc. Observe the risk limit for every trade!

Velocity And Acceleration with Strategy: Traders Magazine◙ OVERVIEW
Hi, Ivestors and Traders... This Indicator, the focus is Scott Cong's article in the Stocks & Commodities September issue, “VAcc: A Momentum Indicator Based On Velocity And Acceleration”. I have also added a trading strategy for you to benefit from this indicator. First of all, let's look at what the indicator offers us and what its logic is. First, let's focus on the logic of the strategy.
◙ CONCEPTS
Here is a new indicator based on some simple physics concepts that is easy to use, responsive and precise. Learn how to calculate and use it.
The field of physics gives us some important principles that are highly applicable to analyzing the markets. In this indicator, I will present a momentum indicator. Scott Cong developed based on the concepts of velocity and acceleration this indicator. Of the many characteristics of price that traders and analysts often study, rate and rate of change are useful ones. In other words, it’s helpful to know: How fast is price moving, and is it speeding up or slowing down? How is price changing from one period to the next? The indicator I’m introducing here is calculated using the current bar (C) and every bar of a lookback period from the current bar. He named the indicator the VAcc since it’s based on the average of velocity line (av) and acceleration line (Acc) over the lookback period. For longer periods, the VAcc behaves the same way as the MACD, only it’s simpler, more responsive, and more precise. Interestingly, for shorter periods, VAcc exhibits characteristics of an oscillator, such as the stochastics oscillator.
◙ CALCULATION
The calculation of VAcc involves the following steps:
1. Relatively weighted average where the nearer price has the largest influence.
weighted_avg (float src, int length) =>
float sum = 0.0
for _i = 1 to length
float diff = (src - src ) / _i
sum += diff
sum /= length
2. The Velocity Average is smoothed with an exponential moving average. Now it get:
VAcc (float src, int period, int smoothing) =>
float vel = ta.ema(weighted_avg(src, period), smoothing)
float acc = weighted_avg(vel, period)
3. Similarly, accelerations for each bar within the lookback period and scale factor are calculated as:
= VAcc(src, length1, length2)
av /= (length1 * scale_factor)
◙ STRATEGY
In fact, Scott probably preferred to use it in periods 9 and 26 because it was similar to Macd and used the ratio of 0.5. However, I preferred to use the 8 and 21 periods to provide signals closer to the stochastic oscillator in the short term and used the 0.382 ratio. The logic of the strategy is this
Long Strategy → acc(Acceleration Line) > 0.1 and av(Velocity Average Line) > 0.1(Long Factor)
Short strategy → acc(Acceleration Line) < -0.1 and av(Velocity Average Line) < -0.1(Long Factor)
Here, you can change the Short Factor and Long Factor as you wish and produce more meaningful results that are closer to your own strategy.
I hope you benefits...
◙ GENEL BAKIŞ
Merhaba Yatırımcılar ve Yatırımcılar... Bu Gösterge, Scott Cong'un Stocks & Emtia Eylül sayısındaki “VAcc: Hız ve İvmeye Dayalı Bir Momentum Göstergesi” başlıklı makalesine odaklanmaktadır. Bu göstergeden faydalanabilmeniz için bir ticaret stratejisi de ekledim. Öncelikle göstergenin bize neler sunduğuna ve mantığının ne olduğuna bakalım. Öncelikle stratejinin mantığına odaklanalım.
◙ KAVRAMLAR
İşte kullanımı kolay, duyarlı ve kesin bazı basit fizik kavramlarına dayanan yeni bir gösterge. Nasıl hesaplanacağını ve kullanılacağını öğrenin.
Fizik alanı bize piyasaları analiz etmede son derece uygulanabilir bazı önemli ilkeler verir. Bu göstergede bir momentum göstergesi sunacağım. Scott Cong bu göstergeyi hız ve ivme kavramlarına dayanarak geliştirdi. Yatırımcıların ve analistlerin sıklıkla incelediği fiyatın pek çok özelliği arasında değişim oranı ve oranı yararlı olanlardır. Başka bir deyişle şunu bilmek faydalı olacaktır: Fiyat ne kadar hızlı hareket ediyor ve hızlanıyor mu, yavaşlıyor mu? Fiyatlar bir dönemden diğerine nasıl değişiyor? Burada tanıtacağım gösterge, mevcut çubuk (C) ve mevcut çubuktan bir yeniden inceleme döneminin her çubuğu kullanılarak hesaplanır. Göstergeye, yeniden inceleme dönemi boyunca hız çizgisinin (av) ve ivme çizgisinin (Acc) ortalamasına dayandığı için VAcc adını verdi. Daha uzun süreler boyunca VACc, MACD ile aynı şekilde davranır, yalnızca daha basit, daha duyarlı ve daha hassastır. İlginç bir şekilde, daha kısa süreler için VAcc, stokastik osilatör gibi bir osilatörün özelliklerini sergiliyor.
◙ HESAPLAMA
VAcc'nin hesaplanması aşağıdaki adımları içerir:
1. Yakın zamandaki fiyatın en büyük etkiye sahip olduğu göreceli ağırlıklı ortalamayı hesaplatıyoruz.
weighted_avg (float src, int length) =>
float sum = 0.0
for _i = 1 to length
float diff = (src - src ) / _i
sum += diff
sum /= length
2. Hız Ortalamasına üstel hareketli ortalamayla düzleştirme uygulanır. Şimdi bu şekilde aşağıdaki kod ile bunu şöyle elde ediyoruz:
VAcc (float src, int period, int smoothing) =>
float vel = ta.ema(weighted_avg(src, period), smoothing)
float acc = weighted_avg(vel, period)
3. Benzer şekilde, yeniden inceleme süresi ve ölçek faktörü içindeki her bir çubuk için fiyattaki ivmelenler yada momentum şu şekilde hesaplanır:
= VAcc(src, length1, length2)
av /= (length1 * scale_factor)
◙ STRATEJİ
Aslında Scott muhtemelen Macd'e benzediği ve 0,5 oranını kullandığı için 9. ve 26. periyotlarda kullanmayı tercih etmişti. Ancak kısa vadede stokastik osilatöre daha yakın sinyaller sağlamak için 8 ve 21 periyotlarını kullanmayı tercih ettim ve 0,382 oranını kullandım. Stratejinin mantığı şu
Uzun Strateji → acc(İvme Çizgisi) > 0,1 ve av(Hız Ortalama Çizgisi) > 0,1(Uzun Faktör)
Kısa strateji → acc(İvme Çizgisi) < -0,1 ve av(Hız Ortalama Çizgisi) < -0,1(Uzun Faktör)
Burada Kısa Faktör ve Uzun Faktör' ü dilediğiniz gibi değiştirip, kendi stratejinize daha yakın, daha anlamlı sonuçlar üretebilirsiniz.
umarım faydasını görürsün...
[FC] Multi EMA Cross Alerts Fltered with RSI and StochThis script prints Green Dots and Red Dots on candle close using Faster EMA ( 5 ) and Slower EMA (10 ) filtering with RSI (50)+ Stochastic %K ( 20 to 80 ) Smoothning(3).
The idea behind is to you use dots for scalping on smaller timeframe(5) ,(10) etc but you can modify all values to better fit your needs.
Explaination for Green Dots and Red Dots:
---> Green dot : 5 Ema crosses above 10 Ema ( i.e faster EMA crosses above slower EMA which signals price is trying to move up
RSI value > 50 (filtering for quick move)
stoch %k value between 20 and 80 ( filtering to know there is leg left in the move and all movement is already not done)
---> Red dot : 5 Ema crosses below 10 Ema ( i.e faster EMA crosses above slower EMA which signals price is trying to move down
RSI value < 50 (filtering for quick move)
stoch %k value between 20 and 80 ( filtering to know there is leg left in the move and all movement is already not done)

RSI Overbought/Oversold + Divergence IndicatorDESCRIPTION:
This script combines the Relative Strength Index ( RSI ), Moving Average and Divergence indicator to make a better decision when to enter or exit a trade.
- The Moving Average line (MA) has been made hidden by default but enhanced with an RSIMA cloud.
- When the RSI is above the selected MA it turns into green and when the RSI is below the select MA it turns into red.
- When the RSI is moving into the Overbought or Oversold area, some highlighted areas will appear.
- When some divergences or hidden divergences are detected an extra indication will be highlighted.
- When the divergence appear in the Overbought or Oversold area the more weight it give to make a decision.
- The same color pallet has been used as the default candlestick colors so it looks familiar.
HOW TO USE:
The prerequisite is that we have some knowledge about the Elliot Wave Theory, the Fibonacci Retracement and the Fibonacci Extension tools.
Wave 1
(1) When we receive some buy signals we wait until we receive some extra indications.
(2) On the RSI Overbought/Oversold + Divergence Indicator we can see a Bullish Divergence and our RSI is changing from red to green ( RSI is higher then the MA).
(3) If we are getting here into the trade then we need to use a stop loss. We put our stop loss 1 a 2 pips just below the lowest wick. We also invest maximum 50% of the total amount we want to invest.
Wave 2
(4) Now we wait until we see a clear reversal and here we starting to use the Fibonacci Retracement tool. We draw a line from the lowest point of wave(1) till the highest point of wave (1). When we are retraced till the 0.618 fib also called the golden ratio we check again the RSI Overbought/Oversold + Divergence Indicator. When we see a reversal we do our second buy. We set again a stop loss just below the lowest wick (this is the yellow line on the chart). We also move the stop loss we have set in step (3) to this level.
Wave 3
(5) To identify how far the uptrend can go we need to use the Fibonacci Extension tool. We draw a line from the lowest point of wave(1) till the highest point of wave (1) and draw it back to the lowest point of wave (2). Wave (3) is most of the time the longest wave and can go till it has reached the 1.618 or 2.618 fib. On the 1.618 we can take some profit. If we don't want to sell we move our stop loss to the 1 fib line (yellow line on the chart).
(6) We wait until we see a clear reversal on the Overbought/Oversold + Divergence Indicator and sell 33% to 50% of our investment.
Wave 4
(7) Now we wait again until we see a clear reversal and here we starting to use the Fibonacci Retracement tool. We draw a line from the lowest point of wave(2) till the highest point of wave (3). When we are retraced till the 0.618 fib also called the golden ratio we check again the RSI Overbought/Oversold + Divergence Indicator. When we see a reversal we buy again. We set again a stop loss just below the lowest wick (this is the yellow line on the chart).
(8) If we bought at the first reversal ours stop los was triggered (9) and we got out of the trade.
(9) If we did not bought at step (7) because our candle did not hit the 0.618 fib or we got stopped out of the trade we buy again at the reversal.
Wave 5
(10) To identify how far the uptrend can go we need to use the Fibonacci Extension tool. We draw a line from the lowest point of wave(2) till the highest point of wave (3) and draw it back to the lowest point of wave (4). Most of the time wave 5 goes up till it has reached the 1 fib. And that is the point where we got out of the trade with all of our investment. In this trade we got out of the trade a bit earlier. We received the sell signals and got a reversal on the Overbought/Oversold + Divergence Indicator.
We are hoping you learned something so you can make better decisions when to get into or out of a trade.
If you have any question just drop it into the comments below.
FEATURES:
• You can show/hide the RSI .
• You can show/hide the MA.
• You can show/hide the lRSIMA cloud.
• You can show/hide the Stoch RSI cloud.
• You can show/hide and adjust the Overbought and Oversold zones.
• You can show/hide and adjust the Overbought Extended and Oversold Extended zones.
• You can show/hide the Overbought and Oversold highlighted zones.
• Etc...
HOW TO GET ACCESS TO THE SCRIPT:
• Favorite the script and add it to your chart.
REMARKS:
• This advice is NOT financial advice.
• We do not provide personal investment advice and we are not a qualified licensed investment advisor.
• All information found here, including any ideas, opinions, views, predictions, forecasts, commentaries, suggestions, or stock picks, expressed or implied herein, are for informational, entertainment or educational purposes only and should not be construed as personal investment advice.
• We will not and cannot be held liable for any actions you take as a result of anything you read here.
• We only provide this information to help you make a better decision.
• While the information provided is believed to be accurate, it may include errors or inaccuracies.
Good Luck and have fun,
The CryptoSignalScanner Team

LowLag Channel StochThis study is an experiment utilizing the Hull Filter technique applied to an exponential moving average that has a relatively low lag to analyze trend activity. The Hull method is adjusted by the length.
A modified stochastic is used to help confirm buy/sell opportunities. The stochastic limits of 0.2 and 0.8 may be adjusted.
The up/down arrows indicate buy/sell opportunities. At the color change a buy/sell condition is indicated. Confirmation is by the stochastic passing through the appropriate limits. A third confirmation should be considered.
The initial signals are occasionally repeated because of the wait for 2 time instants. This is included because some buy/sell opportunities were missed without the wait.

[blackcat] L2 SVE Stochastic RSI Level 2
Background
Sylvain Vervoort’ articles in the Aug issues on 2018,“The V-Trade, Part 6”.
Function
In “The V-Trade, Part 6: Technical Analysis—Divergence Indicators” in the August 2018 issue of STOCKS & COMMODITIES, author Sylvain Vervoort introduces a modified version of the stochastic RSI, an indicator that was first introduced by Tushar Chande and Stanley Kroll. That indicator applies a stochastic calculation to an RSI value rather than a simple value, and Vervoort’s update provides additional smoothing. Vervoort uses his new indicator primarily in the analysis of divergence.
Remarks
Tradingview official stoch RSI is added for comparison.
Feedbacks are appreciated.

RSI Stoch MACD EMARibbon (by WJ)Combination of RSI, Stochastic and MACD signals filtered by EMA Ribbon direction.
Long when:
RSI > 50
Stochastic crossover upwards k > d and k < 50
MACD crossover upwards
EMA fast > slow
Short when:
RSI < 50
Stochastic crossover downwards k < d and k > 50
MACD crossover downwards
EMA fast < slow
Make sure Stochastic has recently done a crossover from respective overbought/oversold zones.
[GJ]IFRSITHE INVERSE FISHER TRANSFORM STOCH RSI
HOW IT WORKS
This indicator uses the inverse fisher transform on the stoch RSI for clear buying and selling signals. The stoch rsi is used to limit it in the range of 0 and 100. We subtract 50 from this to get it into the range of -50 to +50 and multiply by .1 to get it in the range of -5 to +5. We then use the 9 period weighted MA to remove some "random" trade signals before we finally use the inverse fisher transform to get the output between -1 and +1
HOW TO USE
Buy when the indicator crosses over –0.5 or crosses over +0.5 if it has not previously crossed over –0.5.
Sell when the indicator crosses under +0.5 or crosses under –0.5 if it has not previously crossed under +0.5.
We can see multiple examples of good buy and sell signals from this indicator on the attached chart for QCOM. Let me know if you have any suggestions or thoughts!

LordPepe Stochastic SignalsThis is the Lord Pepe. Howdy. Basic buy/sell indicator to accumulate along a downtrend and release your stack during the uptrend and oversold levels of the stochastic. The buys should be used to stack, and sells indicate levels of profit taking, they do not signal a long term reversal, only < 25% of stack should be released on "OB" signals.
OB - overbought (sell)
OS - oversold (buy)
RSI / STOCH RSICan be used in any time frame, any market (crypto,stock and FX) and any symbol. Values changeable and turntable on/off.
Include's :
- RSI
- SRSI
TA-Money Flow-Version3This is the MACD of a stochastic OBV movement indicator. It is good (right) to work with both price and volume. I've included highlighting based on price divergence. It works great on any time frame, but you need to have volume data. Not sure where I originally got this (stoch-OBV, somewhere off Tradingview several years ago, thanks to the person who shared), just publishing because of a request.
Enjoy.
Version 2 - TA-Money-Flow-v2-Stochastic-OBV

RSI/Stoch/SRSI MTF COMBOThis combo-indicator is based on @ChrisMoody 's RSI and Stoch MTF original scripts.
It gives traders the possibility to overlay RSI, Stochastic and SRSI as well as to see how each element is behaving on a higher/lower TF.
RSI, Stoch and SRSI can be individually configured as well as turned on/off by the user.
Overbought/Oversold and Middle lines are available but only the formers can be configured by the user - Middle Line is fixed at 50.
This indicator is open source and free to use. Feel free to change it around to suit your needs.
***If you copy & paste the script, please remember to credit Chris Moody for his amazing work.***
Happy trading!

Multi-Timeframe StochasticView stochastics for multiple timeframes at the same time. (currentTimeframe -> x1, x2, x5)
Based on Oshis Slow Stochastic

ITCP ATR BB RSI Stoch SignalsThis indicator generates BUY/SELL signals when price stretches outside Bollinger Bands during elevated volatility, confirmed by RSI, a Stochastic crossover, and a volume filter. To reduce counter-trend entries, it applies a macro trend filter using the Daily SMA 200: it looks for longs only above the SMA 200 and shorts only below it.
It tends to perform best in Forex, especially on liquid pairs, because market conditions (liquidity, continuous sessions, and relatively stable spreads on major pairs) often suit this confirmation-based approach. That said, it can be adapted to other markets (indices, commodities, or crypto) by tuning parameters such as Bollinger length/deviation, RSI/Stoch thresholds, and ATR settings (multipliers/factors) to fit the asset’s volatility.
It also plots ATR-based stop-loss reference levels (configurable smoothing) and includes webhook-ready alerts with a JSON payload (action, symbol, price, stop_loss, time, and interval) for external automation. The goal is to support rules-based execution and reduce impulsive trades: if conditions don’t align, there’s no signal.
If you manage to improve it, discover better settings, or build a more robust solution inspired by this, I’d really appreciate it if you share it back (even if it’s just feedback or an idea). I’m open to collaborating and iterating together to create stronger versions over time.


MACD FROM HELLthis is a double macd with 2 time frames macd 1 is chart macd 4 is 4X meaning the 1hr becomes the 4hr and it uses the histogram coloring for added detail ,, on top of that it has stochastic rsi Alerts set to trigger when k line goes above 99.9 or below 0.01 and exits ,, alert triggers on exit
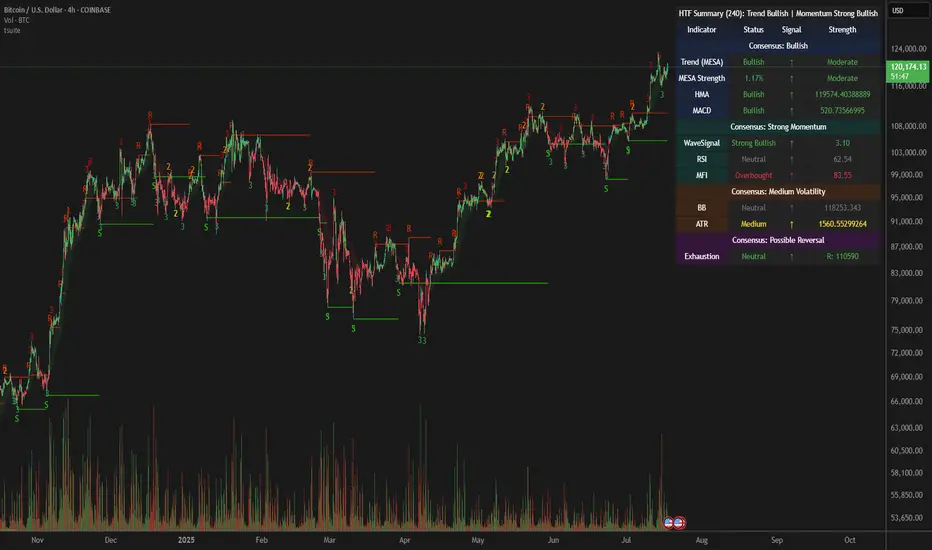
Dual Table Dashboard - Correct V3add RSI Data## 📈 Trading Applications
### 1. Trend Following Strategy
```
1. Check TABLE 1 for trend direction (AnEMA29 + PDMDR)
2. If both green → Look for longs
3. If both red → Look for shorts
4. Use TABLE 2 for entry levels
```
### 2. Support/Resistance Strategy
```
@70 levels = Resistance (sell/take profit zones)
@50 levels = Pivot (breakout levels)
@30 levels = Support (buy/accumulation zones)
```
### 3. Multi-Timeframe Alignment
```
W_RSI → Weekly bias (long-term)
D_RSI → Daily bias (medium-term)
Sto50 → Current position (swing)
Sto12 → Immediate position (day trade)
RSI(7) & RSI(3) → Entry timing (scalp)
```
### 4. Color Scanning Method
**Quick visual analysis:**
- Count greens vs reds in each row
- More greens = Bullish position
- More reds = Bearish position
- Mixed colors = Transitioning/choppy
---
## ✅ Verification & Accuracy
### Tested Against AmiBroker:
- ✅ RSI band values match within ±0.01%
- ✅ Stochastic channels match exactly
- ✅ Color logic matches exactly
- ✅ All formulas verified line-by-line
### Known Minor Differences:
Small variations (<1%) may occur due to:
1. **Platform calculation precision** - Different floating-point engines
2. **Historical data feeds** - Slight variations in past prices
3. **Weekly bar boundaries** - TradingView vs AmiBroker week definitions
4. **Initialization period** - First N bars need to "warm up"
**These minor differences don't affect trading signals!**
---
## ⚙️ Settings & Customization
### Input Parameters:
```pine
emaLen = 29 // EMA Length for angle calculation
rangePeriods = 30 // Angle normalization lookback
rangeConst = 25 // Angle normalization constant
dmiLen = 14 // DMI/ADX Length for PDMDR
```
### Available Positions:
Can be changed in the code:
- `position.top_left`
- `position.top_center`
- `position.top_right`
- `position.middle_left` (Table 2 default)
- `position.middle_center`
- `position.middle_right`
- `position.bottom_left` (Table 1 default)
- `position.bottom_center`
- `position.bottom_right`
### Text Sizes:
- `size.tiny`
- `size.small` (current default)
- `size.normal`
- `size.large`
- `size.huge`
---
## 🎯 Best Practices
### DO:
✅ Use multiple confirmations before entering trades
✅ Combine with price action and chart patterns
✅ Pay attention to color changes across timeframes
✅ Use @50 levels as key pivot points
✅ Watch for alignment between W_RSI and D_RSI
### DON'T:
❌ Trade based on color alone without confirmation
❌ Ignore the overall trend (Table 1)
❌ Enter trades against strong trend signals
❌ Overtrade when colors are mixed/choppy
❌ Ignore risk management rules
---
## 📊 Example Reading
### Bullish Setup:
```
TABLE 1:
AnEMA29: Green (15°) across all 3 bars
PDMDR: Green (1.65) and rising
TABLE 2:
W_RSI@50: Green (price above)
D_RSI@50: Green (price above)
Sto50@50: Green (price above midpoint)
Sto12@50: Green (price above midpoint)
Interpretation: Strong bullish trend confirmed across multiple timeframes
Action: Look for long entries on pullbacks to @50 or @30 levels
```
### Bearish Setup:
```
TABLE 1:
AnEMA29: Red (-12°) across all 3 bars
PDMDR: Red (0.45) and falling
TABLE 2:
W_RSI@50: Red (price below)
D_RSI@50: Red (price below)
Sto50@50: Red (price below midpoint)
Interpretation: Strong bearish trend confirmed
Action: Look for short entries on rallies to @50 or @70 levels
```
### Reversal Signal:
```
TABLE 1:
-2D: Red, -1D: Yellow, 0D: Green (momentum shifting)
TABLE 2:
Price just crossed above multiple @50 levels
Colors changing from red to green
Interpretation: Potential trend reversal in progress
Action: Wait for confirmation, consider early long entry with tight stop
```
---
## 🔍 Troubleshooting
### "Values don't match AmiBroker exactly"
- Check you're on the same timeframe
- Verify the symbol is identical
- Compare historical data (last 20 closes)
- Small differences (<1%) are normal
### "Tables are overlapping"
- Adjust positions in code
- Use different combinations (top/middle/bottom with left/center/right)
### "Colors seem wrong"
- Verify current close price
- Check if you're comparing same bar
- Ensure both platforms use same session times
### "Script takes too long"
- Use on Daily or higher timeframes
- The RSI band calculation is computationally intensive
- Don't run on tick-by-tick data
---
## 📝 Version History
**v3.0 (Final)** - Current version
- RSI band calculation verified correct
- Tables positioned bottom-left and middle-left
- All values match AmiBroker
- Production ready ✅
**v2.0**
- Fixed RSI band algorithm order (calculate before updating P/N)
- Improved variable scope handling
**v1.0**
- Initial implementation
- Had incorrect RSI band calculation
---
## 📄 Files in Package

SMI Base-Trigger Bullish Re-acceleration (Higher High)Description
What it does
This indicator highlights a two-step bullish pattern using Stochastic Momentum Index (SMI) plus an ATR distance filter:
1. Base (orange) – Marks a momentum “reset.” A base prints when SMI %K crosses up through %D while %K is below the Base level (default -70). The base stores the base price and starts a waiting window.
2. Trigger (green) – Confirms momentum and price strength. A trigger prints only if, before the timeout window ends:
• SMI %K crosses up through %D again,
• %K is above the Trigger level (default -60),
• Close > Base Price, and
• Price has advanced at least Min ATR multiple (default 1.0× the 14-period ATR) above the base price.
A dashed green line connects the base to the trigger.
Why it’s useful
It seeks a bullish divergence / reacceleration: momentum recovers from deeply negative territory, then price reclaims and exceeds the base by a volatility-aware margin. This helps filter out weak “oversold bounces.”
Signals
• Base ▲ (orange): Potential setup begins.
• Trigger ▲ (green): Confirmation—momentum and price agree.
Inputs (key ones)
• %K Length / EMA Smoothing / %D Length: SMI construction.
• Base when %K < (default -70): depth required for a valid reset.
• Trigger when %K > (default -60): strength required on confirmation.
• Base timeout (days) (default 100): maximum look-ahead window.
• ATR Length (default 14) and Min ATR multiple (default 1.0): price must exceed the base by this ATR-scaled distance.
How traders use it (example rules)
• Entry: On the Trigger.
• Risk: A common approach is a stop somewhere between the base price and a multiple of ATR below trigger; or use your system’s volatility stop.
• Exits: Your choice—trend MA cross, fixed R multiple, or structure-based levels.
Notes & tips
• Works best on liquid symbols and mid-to-higher timeframes (reduce noise).
• Increase Min ATR multiple to demand stronger price confirmation; tighten or widen Base/Trigger levels to fit your market.
• This script plots signals only; convert to a strategy to backtest entries/exits.

AK_Trend reversal_Range_Market_RSI + Stoch. RSIRSI + Stoch. RSI based indicator to predict trend reversal. Most applicable in range market

Pro Scalper AI [BullByte]The Pro Scalper AI is a powerful, multi-faceted scalping indicator designed to assist active traders in identifying short-term trading opportunities with precision. By combining trend analysis, momentum indicators, dynamic weighting, and optional AI forecasting, this tool provides both immediate and latched trading signals based on confirmed (closed bar) data—helping to avoid repainting issues. Its flexible design includes customizable filters such as a higher timeframe trend filter, and adjustable settings for ADX, ATR, and Hull Moving Average (HMA), giving traders the ability to fine-tune the strategy to different markets and timeframes.
Key Features :
- Confirmed Data Processing :
Utilizes a helper function to lock in price and volume data only from confirmed (closed) bars, ensuring the reliability of signals without the risk of intrabar repainting.
- Trend Analysis :
Employs ADX and Directional Movement (DI) calculations along with a locally computed HMA to detect short-term trends. An optional higher timeframe trend filter can further refine the analysis.
- Flexible Momentum Modes :
Choose between three momentum calculation methods—Stochastic RSI, Fisher RSI, or Williams %R—to match your preferred style of analysis. This versatility allows you to optimize the indicator for different market conditions.
- Dynamic Weighting & Volatility Adjustments :
Adjusts the contribution of trend, momentum, volatility, and volume through dynamic weighting. This ensures that the indicator responds appropriately to varying market conditions by scaling its sensitivity with user-defined maximum factors.
- Optional AI Forecast :
For those who want an extra edge, the built-in AI forecasting module uses linear regression to predict future price moves and adjusts oscillator thresholds accordingly. This feature can be toggled on or off, with smoothing options available for more stable output.
- Latching Mode for Signal Persistenc e:
The script features a latching mechanism that holds signals until a clear reversal is detected, preventing whipsaws and providing more reliable trade entries and exits.
- Comprehensive Visualizations & Dashboard :
- Composite Oscillator & Dynamic Thresholds : The oscillator is plotted with dynamic upper and lower thresholds, and the area between them is filled with a color that reflects the active trading signal (e.g., Strong Buy, Early Sell).
- Signal Markers : Both immediate (non-latching) and stored (latched) signals are marked on the chart with distinct shapes (circles, crosses, triangles, and diamonds) to differentiate between signal types.
- Real-Time Dashboard : A customizable dashboard table displays key metrics including ADX, oscillator value, chosen momentum mode, HMA trend, higher timeframe trend, volume factor, AI bias (if enabled), and more, allowing traders to quickly assess market conditions at a glance.
How to Use :
1. S ignal Interpretation :
- Immediate Signals : For traders who prefer quick entries, the indicator displays immediate signals such as “Strong Buy” or “Early Sell” based on the current market snapshot.
- Latched Signals : When latching is enabled, the indicator holds a signal state until a clear reversal is confirmed, offering sustained trade setups.
2. Trend Confirmation :
- Use the HMA trend indicator and the optional higher timeframe trend filter to confirm the prevailing market direction before acting on signals.
3. Dynamic Thresholds & AI Forecasting :
- Monitor the dynamically adjusted oscillator thresholds and, if enabled, the AI bias to gauge potential shifts in market momentum.
4. Risk Management :
- Combine these signals with additional analysis and sound risk management practices to determine optimal entry and exit points for scalping trades.
Disclaimer :
This script is provided for educational and informational purposes only and does not constitute financial advice. Trading involves risk, and past performance is not indicative of future results. Always perform your own analysis and use proper risk management strategies before trading.

Multi-Timeframe Stoch RSIThe Multi-Timeframe Stoch RSI Indicator analyzes Stochastic RSI values across multiple timeframes (5m, 15m, 30m, 1h, 3h, and 1D) to help identify overbought and oversold conditions. It displays a visual table where each timeframe is color-coded—red for overbought (🐻) and green for oversold (✅)—allowing traders to quickly assess market momentum at different intervals. This helps in making informed trading decisions based on multi-timeframe confluence.
