Stochastic [Paifc0de]Stochastic — clean stochastic oscillator with visual masking, neutral markers, and basic filters
What it does
This indicator plots a standard stochastic oscillator (%K with smoothing and %D) and adds practical quality-of-life features for lower timeframes: optional visual masking when %K hugs overbought/oversold, neutral K–D cross markers, session-gated edge triangles (K crossing 20/80), and simple filters (minimum %K slope, minimum |K–D| gap, optional %D slope agreement, mid-zone mute, and a cooldown between markers). Display values are clamped to 0–100 to keep the panel scale stable. The tool is for research/education and does not generate entries/exits or financial advice.
Default preset: 20 / 10 / 10
K Length = 20
Classic lookback used in many textbooks. On intraday charts it balances responsiveness and stability: short enough to react to momentum shifts, long enough to avoid constant whipsaws. In practice it captures ~the last 20 bars’ position of close within the high–low range.
K Smoothing = 10
A 10-period SMA applied to the raw %K moderates the “saw-tooth” effect that raw stochastic can exhibit in choppy phases. The smoothing reduces over-reaction to micro spikes while preserving the main rhythm of swings; visually, %K becomes a continuous path that is easier to read.
D Length = 10
%D is the moving average of smoothed %K. With 10, %D becomes a clearly slower guide line. The larger separation between %K(10-SMA) and %D(10-SMA of %K) produces cleaner crosses and fewer spurious toggles than micro settings (e.g., 3/3/3). On M5–M15 this pair often yields readable cross cycles without flooding the chart.
How the 20/10/10 trio behaves
In persistent trends, %K will spend more time near 20 or 80; the 10-period smoothing delays flips slightly and emphasizes only meaningful turn attempts.
In ranges, %K oscillates around mid-zone (40–60). With 10/10 smoothing, cross signals cluster less densely; combining with the |K–D| gap filter helps keep only decisive crosses.
If your symbol is unusually volatile or illiquid, reduce K Length (e.g., 14) or reduce K Smoothing (e.g., 7) to keep responsiveness. If crosses feel late, decrease D Length (e.g., 7). If noise is excessive, increase K Smoothing first, then consider raising D Length.
Visuals
OB/OS lines: default 80/20 reference levels and a midline at 50.
Masking near edges: %K can be temporarily hidden when it is pressing an edge, approaching it with low slope, or going nearly flat near the boundary. This keeps the panel readable during “stuck at the edge” phases.
Soft glow (optional): highlights %K’s active path; can be turned off.
Light/Dark palette: quick toggle to match your chart theme.
Scale safety: all plotted values (lines, fills, markers) are clamped to 0–100 to prevent the axis from expanding beyond the stochastic range.
Markers and filters
Neutral K–D cross markers: circles in the mid-zone when %K crosses %D.
Edge triangles: show when %K crosses 20 or 80; can be restricted to a session window (02:00–12:00 ET).
Filters (optional):
Min %K slope: require a minimum absolute slope so very flat crosses are ignored.
Min |K–D| gap: demand separation between lines at the cross moment.
%D slope agreement: keep crosses that align with %D’s direction.
Mid-zone mute: suppress crosses inside a user-defined 40–60 band (defaults).
Cooldown: minimum bars between successive markers.
Parameters (quick guide)
K Length / K Smoothing / D Length: core stochastic settings. Start with 20/10/10; tune K Smoothing first if you see too much jitter.
Overbought / Oversold (80/20): adjust for assets that tend to trend (raise to 85/15) or mean-revert (lower to 75/25).
Slope & gap filters: increase on very noisy symbols; reduce if you miss too many crosses.
Session window (triangles only): use if you want edge markers only during active hours.
Marker size and offset: cosmetic; they do not affect calculations.
Alerts
K–D Cross Up (filtered) and K–D Cross Down (filtered): fire when a cross passes your filters/cooldown.
Edge Up / Edge Down: fire when %K crosses the 20/80 levels.
All alerts confirm on bar close.
Notes & attribution
Original implementation and integration by Paifc0de; no third-party code is copied.
This indicator is for research/education and does not provide entries/exits or financial advice.
在脚本中搜索"stoch"

Stochastic Biquad Band Pass FilterThis indicator combines the power of a biquad band pass filter with the popular stochastic oscillator to provide a unique tool for analyzing price movements.
The Filter Length parameter determines the center frequency of the biquad band pass filter, affecting which frequency band is isolated. Adjusting this parameter allows you to focus on different parts of the price movement spectrum.
The Bandwidth (BW) controls the width of the frequency band in octaves. It represents the bandwidth between -3 dB frequencies for the band pass filter. A narrower bandwidth results in a more focused filtering effect, isolating a tighter range of frequencies.
The %K Length parameter sets the period for the stochastic calculation, determining the range over which the stochastic values are calculated.
The %K Smoothing parameter applies a simple moving average to the %K values to smooth out the oscillator line.
The %D Length parameter sets the period for the %D line, which is a simple moving average of the %K line, providing a signal line for the oscillator.
Key Features of the Stochastic Biquad Band Pass Filter
Biquad filters are known for their smooth response and minimal phase distortion, making them ideal for technical analysis. In this implementation, the biquad filter is configured as a band pass filter, which allows frequencies within a specified band to pass while attenuating frequencies outside this band. This is particularly useful in trading to isolate specific price movements, making it easier to detect patterns and trends within a targeted frequency range.
The stochastic oscillator is a popular momentum indicator that shows the location of the close relative to the high-low range over a set number of periods. Combining it with a biquad band pass filter enhances its effectiveness by focusing on specific frequency bands of price movements.
By incorporating this stochastic biquad band pass filter into your trading toolkit, you can enhance your chart analysis with clearer insights into specific frequency bands of price movements, leading to more informed trading decisions.

Stochastic Clean & ClearA simple yet sharp take on the Stochastic Oscillator, built for traders who want to read momentum cleanly without extra clutter.
💡 Main Features:
Dynamic %K and %D line colors — green for bullish momentum, red for bearish.
Auto dots appear whenever %K crosses %D, so you’ll never miss a signal.
Clearly marked overbought (80) and oversold (20) zones with a soft transparent background.
Adjustable smoothing parameters to fit your trading style.
🎯 Perfect for traders who rely on price action + momentum, especially on intraday and swing timeframes.
Minimalist design, no noise — just colors and dots that tell you when the market mood starts to shift.

Open Interest StochasticStochastic Money Flow Index(MFI) using open interest instead of volume.
Open Interest data for Binance, Bitmex, and Kraken

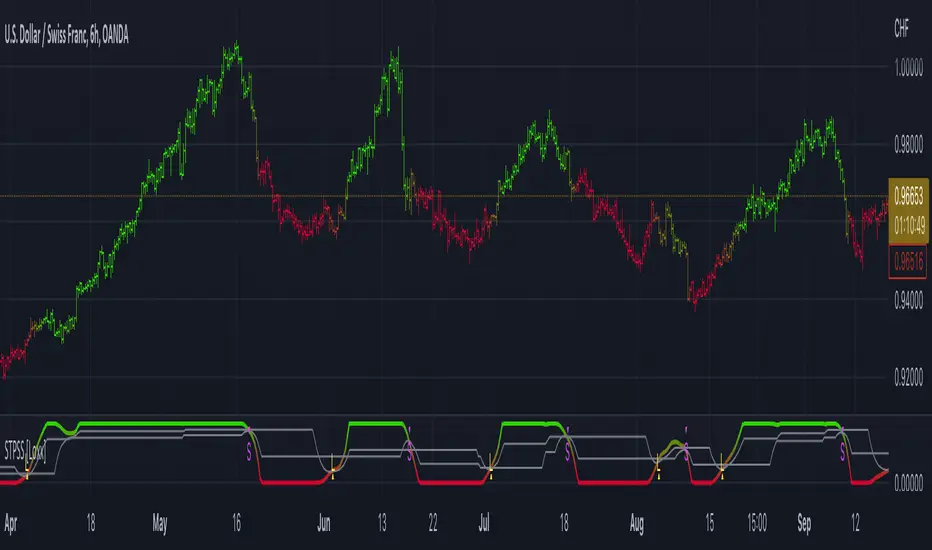
Stochastic of Two-Pole SuperSmoother [Loxx]Stochastic of Two-Pole SuperSmoother is a Stochastic Indicator that takes as input Two-Pole SuperSmoother of price. Includes gradient coloring and Discontinued Signal Lines signals with alerts.
What is Ehlers ; Two-Pole Super Smoother?
From "Cycle Analytics for Traders Advanced Technical Trading Concepts" by John F. Ehlers
A SuperSmoother filter is used anytime a moving average of any type would otherwise be used, with the result that the SuperSmoother filter output would have substantially less lag for an equivalent amount of smoothing produced by the moving average. For example, a five-bar SMA has a cutoff period of approximately 10 bars and has two bars of lag. A SuperSmoother filter with a cutoff period of 10 bars has a lag a half bar larger than the two-pole modified Butterworth filter.Therefore, such a SuperSmoother filter has a maximum lag of approximately 1.5 bars and even less lag into the attenuation band of the filter. The differential in lag between moving average and SuperSmoother filter outputs becomes even larger when the cutoff periods are larger.
Market data contain noise, and removal of noise is the reason for using smoothing filters. In fact, market data contain several kinds of noise. I’ll group one kind of noise as systemic, caused by the random events of trades being exercised. A second kind of noise is aliasing noise, caused by the use of sampled data. Aliasing noise is the dominant term in the data for shorter cycle periods.
It is easy to think of market data as being a continuous waveform, but it is not. Using the closing price as representative for that bar constitutes one sample point. It doesn’t matter if you are using an average of the high and low instead of the close, you are still getting one sample per bar. Since sampled data is being used, there are some dSP aspects that must be considered. For example, the shortest analysis period that is possible (without aliasing)2 is a two-bar cycle.This is called the Nyquist frequency, 0.5 cycles per sample.A perfect two-bar sine wave cycle sampled at the peaks becomes a square wave due to sampling. However, sampling at the cycle peaks can- not be guaranteed, and the interference between the sampling frequency and the data frequency creates the aliasing noise.The noise is reduced as the data period is longer. For example, a four-bar cycle means there are four samples per cycle. Because there are more samples, the sampled data are a better replica of the sine wave component. The replica is better yet for an eight-bar data component.The improved fidelity of the sampled data means the aliasing noise is reduced at longer and longer cycle periods.The rate of reduction is 6 dB per octave. My experience is that the systemic noise rarely is more than 10 dB below the level of cyclic information, so that we create two conditions for effective smoothing of aliasing noise:
1. It is difficult to use cycle periods shorter that two octaves below the Nyquist frequency.That is, an eight-bar cycle component has a quantization noise level 12 dB below the noise level at the Nyquist frequency. longer cycle components therefore have a systemic noise level that exceeds the aliasing noise level.
2. A smoothing filter should have sufficient selectivity to reduce aliasing noise below the systemic noise level. Since aliasing noise increases at the rate of 6 dB per octave above a selected filter cutoff frequency and since the SuperSmoother attenuation rate is 12 dB per octave, the Super- Smoother filter is an effective tool to virtually eliminate aliasing noise in the output signal.
What are DSL Discontinued Signal Line?
A lot of indicators are using signal lines in order to determine the trend (or some desired state of the indicator) easier. The idea of the signal line is easy : comparing the value to it's smoothed (slightly lagging) state, the idea of current momentum/state is made.
Discontinued signal line is inheriting that simple signal line idea and it is extending it : instead of having one signal line, more lines depending on the current value of the indicator.
"Signal" line is calculated the following way :
When a certain level is crossed into the desired direction, the EMA of that value is calculated for the desired signal line
When that level is crossed into the opposite direction, the previous "signal" line value is simply "inherited" and it becomes a kind of a level
This way it becomes a combination of signal lines and levels that are trying to combine both the good from both methods.
In simple terms, DSL uses the concept of a signal line and betters it by inheriting the previous signal line's value & makes it a level.
Included:
Bar coloring
Alerts
Signals
Loxx's Expanded Source Types
Stochastic MACDStochasticMACD (SMACD) is an oscillating momentum indicator. It is based on MACD but run through a stochastic oscillator.
This results in an indicator with all the same properties as MACD but with the benefit that the absolute levels can be compared to history values.

Stochastic + Keltner Channels for ScalpingSimple arrow indicator, indicating the direction go the next slight movement. This indicator will work on any time frame or market.
How does this indicator work?
It will use Stochastic and Keltner Channels to detect potential reversals depending on the frequency you choose in the indicator's settings. The higher the frequency, the fewer candles will be used in the calculation.
When to use this indicator?
It will work better in higher time frames for low volatility indicators. You can mix with other indicators like RSI or ADX. This way, you will be able to check if the time selected frame has enough volatility to move the price enough to cover the spreads and fees of your broker.
When to exit the trade after the signal from this indicator?
A good target would be for 1x ATR value and stop-loss 2x the ATR value. Doing trailing stop will reduce your risk and secure some profits, but make sure to use values for possible fakeouts
Can this indicator be used alone as the main source of entry signal for the trades?
You can use it alone, but I recommend mixing with other trend-based indicators, like Moving Averages, so you get the best results. Since it's for scalping purposes, small moments, and reversals, it doesn't have the trend filter, but it can work trading in favor of a significant trend as well
this is a better version of my other script Scalping Arrows

Stochastic RVIBased on the Stochastic RSI but uses RVI (Relative Volatility Index) as source. Another great tool for finding market lows and entry points. This oscillator is also good for finding accurate diversions.

Stochastic(4,3,2) Spread By Rajv1: This indicator plots a spread of %K - %D of the stochastic(4,3,2).

Stochastic ATR IIStochastic ATR(Higher timeframe)
- stochastic of macd of ATR.
- stochastic rsi of ATR

Stochastic with Lines - DefaultWhat is Stochastic with Lines - Default and why do you need it?
I use it for chart analysis to identify key K/D levels from which bullish / bearish market structure continues to develop.
Default means that every K/D cross above/below the signal lines will be notified on your Stochastic Indicator and not on your chart. To see them on your chart please choose "Stochastic with Lines - Chart" in my library.
Once K or the D line cross over or under your upper or lower signal line you will see background colors which you can adjust in the settings menu.
This small indicator is for a larger project which will be uploaded in several days/weeks.

Stochastic Oscillator [SystemAlpha]This is a Stochastic Oscillator enhanced with:
- Show Buy and Sell Alert
- Show Regular and Hidden divergence
- Show Divergence Labels
- Generate Alerts: Buy/Sell and Divergence

Stochastic RibbonA series of highs and lows of different lengths to create a ribbon-like indicator to emulate the stochastic oscillator's top (100), middle (50) and bottom (0). Traders can determine the strength of the support and resistance by the number of converging lines, choose price points and visualise momentum waves.
Inputs:
Theme: multiple colours/themes (theme 2)
Length: high/low length (14)
Start: plot number to start ribbon on (1)
PlotNumber: number of plots to show; maximum 10 per top, middle, bottom (10)
Example:
Length: 14
Start: 5
PlotNumber: 10

Stochastic FibonacciThis is your run-of-the-mill stochastic indicator, with one slight difference. I added Fibonacci ratios and colored them across the rainbow for aesthetics.
I noticed that the stochastic moving averages, K & D, would reverse in between 0 & 100. Just like price, they were likely Fibonacci ratios.
My original plan was to create a strategy script, and trade whenever K & D crosses the Fib levels. However, they do not cross them perfectly, rather they merely float near them and reverse. Therefore, the strategy would have never made the trades.
As you will notice in the script, there is Bitcoin Hash Rate data imported. I did so because I would like to create a stochastic hash rate indicator at some point. For those of you with this same passion, there is the hash data to mess around with; consider it an Easter Egg...

Stochastic Bollinger Strategy (Wicks)See 'Stochastic Bollinger Strategy' for details on how this works.
tips/donations are always appreciated venmo @rick-munoz

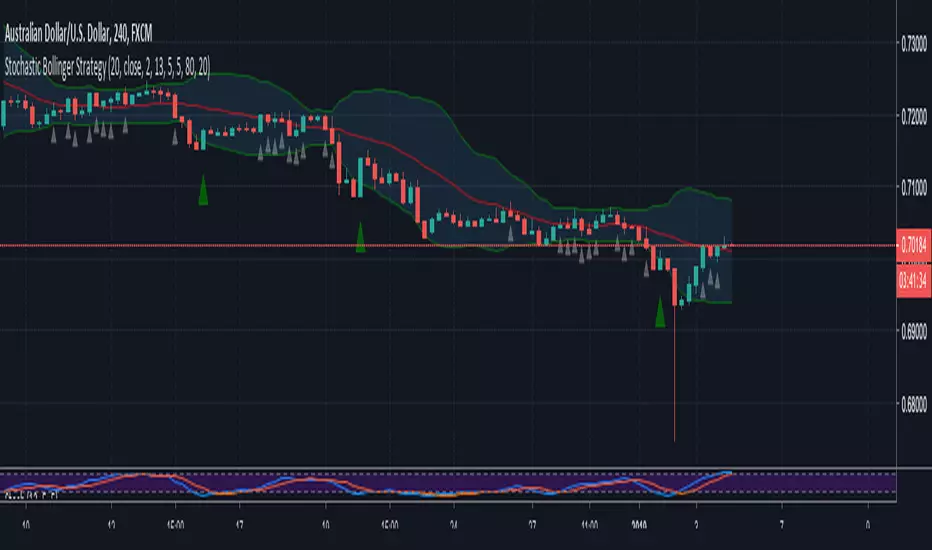
Stochastic Bollinger StrategyBollinger defaults = 20, close, 2
Stochastic defaults = 13, 5, 5
Buy Signal (GREEN triangle):
BULLISH candle formed
Candle OPEN is LESS than LOWER Bollinger Band
Stochastic (K) is LESS than 20
Sell Signal (RED triangle):
BEARISH candle formed
Candle OPEN is GREATER than UPPER Bollinger Band
Stochastic (K) is GREATER than 80
Read more about the strategy and where to set buy stops and sell stops here: swing-trading-strategies.com
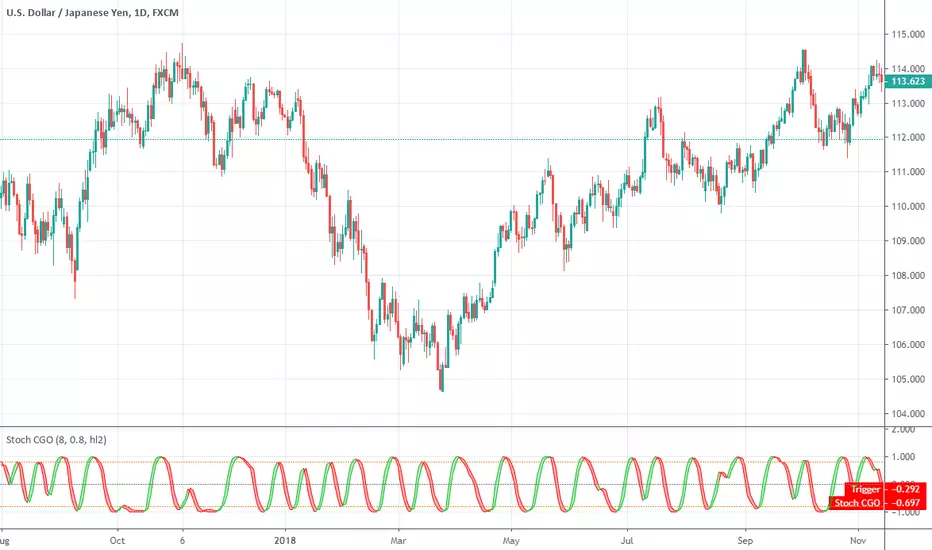
Stochastic CG Oscillator (Center of Gravity)Stochastic CG Oscillator (Center of Gravity) script.
This indicator was originally developed by John F. Ehlers (see his book `Cybernetic Analysis for Stocks and Futures`, Chapter 8: `Stochasticization and Fisherization of Indicators`).
Stochastic HistogramLast Edited: 5/19/16
Description:
This is a basic Stochastic histogram that essentially shows when the indicator
is either above or below the 50 level. Colors can be customized to your liking.
Length and smoothing factor can be adjusted as well. Defaults are 14 (Length)
and 3 (Smoothing Factor).
NOTE: The above chart contains the built-in stochastic indicator for comparison.

Stochastic In BandsWhat about to display Stochastic Oscilator in EMA-ATR Bands? If you like the idea I would code advanced version

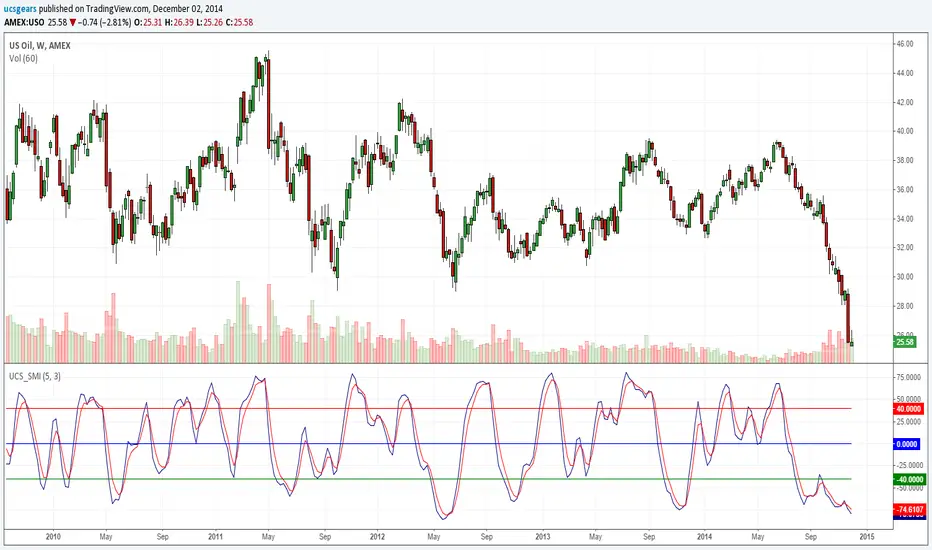
Stochastic Momentum Index _ UCSgearsThe Stochastic Momentum Index (SMI) was introduced by William Blau in 1993 as a way to clarify the traditional stochastic oscillator. SMI helps you see where the current close has taken place relative to the midpoint of the recent high to low range is based on price change in relation to the range of the price. This is a range based indicator, when used right. It can help momentum changes.
For those looking for help understanding this -
wiki.timetotrade.eu
www.tradingstrategyideas.com
tlc.thinkorswim.com
www.sierrachart.com
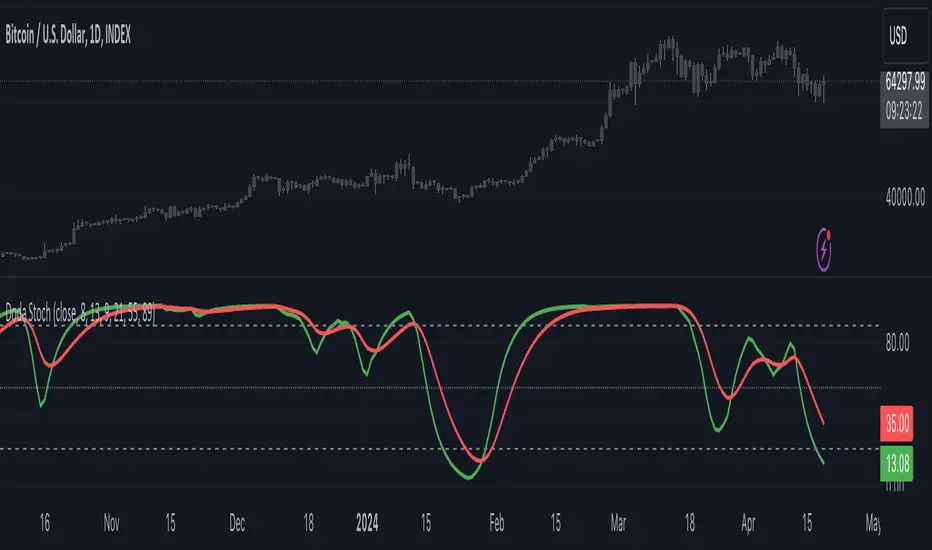
Doda StochasticThe Doda Stochastic Indicator is an oscillator designed to identify primary trends in asset price movements, operating on a scale from 0 to 100. It offers potential buying signals when it fluctuates between 0 and 20, and potential selling signals when it trends between 80 and 100. To reinforce the reliability of these signals, traders often complement them with price action indicators.
The indicator aims to display a modified version of the Stochastic Oscillator, highlighting filtered stochastic values along with related signals.
Traders often use Stochastic indicators to identify potential reversal points or overbought/oversold conditions in the market. The modified version might aim to reduce noise or improve signals compared to the standard Stochastic oscillator. Adjusting the input parameters can alter the sensitivity of the indicator to market movements.
It can also be used to identify trend by considering Doda Stochatic's Moving Average crossing the midline level. If it is above it is uptrend and if below midline then it is downtrend. It does not repaint. It is a lagging indicator because it heavily depends on Moving Averages.
What makes the Doda Stochastic Indicator unique is its attempt to eliminate false or misleading signals commonly found in standard stochastic tools. Instead of relying solely on the 20 and 80 markings for overbought and oversold conditions, it uses the crossing of the green and red lines within these segments to identify signals. However, fully grasping its functionality is pivotal to maximising its utility.
The indicator strategically analyses price movements by scrutinising key price levels, market momentum, and unexpected shifts in trends. By default, it operates with a bar count of 2000 and a PDS value of 13.0, parameters that have undergone extensive testing. It's important to note that tweaking these settings might not always be necessary, as they are well-calibrated.
How to Use the Doda Stochastic Indicator:
Setting up the Indicator:
- Begin incorporating the Doda Stochastic Indicator into your trading strategy once you're confident in identifying significant support and resistance levels.
Strategy with Doda Stochastic:
- Buy Signal Criteria:
- Asset displaying an upward trend.
- Green line crossing above the red line on the indicator.
- Confirm entry with bullish candlestick patterns.
- Set stop loss below the nearest swing low.
- Set take profit at the nearest resistance zone or exit when the green line crosses below the red line.
- Implement risk management with a risk-to-reward ratio of at least 1:2.
- Sell Signal Criteria:
- Asset demonstrating a downtrend.
- Green line crossing below the red line on the indicator.
- Confirm entry with bearish candlestick patterns.
- Set stop loss above the nearest swing high.
- Set take profit at the nearest support zone or exit when the green line crosses above the red line.
- Implement risk management with a risk-to-reward ratio of at least 1:2.
Advantages and Disadvantages:
Pros:
- Analyses crucial price levels, market momentum, and unexpected trend changes.
- Identifies overbought and oversold levels.
Cons:
- Overbought and oversold levels may not always lead to immediate price reversals.
- Signals might occasionally misinterpret a trend reversal as a correction, and vice versa.
The strength of the indicator lies in its intricate approach to price analysis and its effort to minimize false signals. However, traders should exercise caution and consider supplementary confirmation signals for more robust trade decisions.
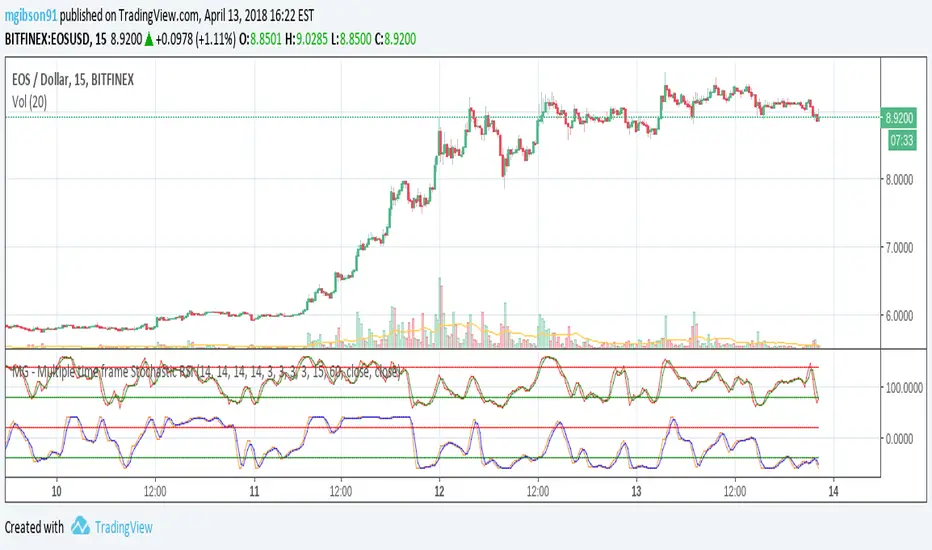
MG - Multiple time frame Stochastic RSIAllows user to view stochastic RSI from two different time frames.
Each stochastic RSI indicator is fully customizable, offering the following options:
- Timeframe
- RSI source
- RSI length
- Stochastic length
- Stochastic average length
- Stochastic smoothing length
Usage:
Comparing stochastic RSI across two different time frames can sharpen trades. For example, if you configure a 60 min and 5/15 min stochastic RSI pair, you might enter a long trade when the 60 min stoch RSI crosses up and exit / take profit when the 5 min stock RSI crosses down.