MTF rsi/stoch imdI just built this indicator.
It displays a multi-timeframe (MTF) table directly on the chart, showing Stoch RSI K and RSI values per timeframe.
Cell background colors are driven by predefined value ranges, while text color turns green or red depending on whether the value is rising or falling compared to the previous candle on the same timeframe.
The RSI color conditions are based on the levels 36, 46, 56, and 65.
The Timeframe Pack selector works as follows:
Pack 1 (BNC): 3m, 9m, 27m, 1h, 81m, 3h, 9h, 12h, 1D, 3D, 1W, 9D
Pack 2: 1h through 24h
Pack 3: 1D through 24D
Pack 4 (Custom): fully user-defined timeframes via the 24 slots
Only when Pack 4 (Custom) is selected do the custom timeframe slots apply; in Packs 1–3 they are ignored.
All visual behavior (box colors, text colors, transparency, or a single-color override) is configurable under Style, and the entire table can be toggled on or off.
在脚本中搜索"stoch"

EMA Trend & Stochastic Signal IndicatorThis indicator displays trend-aligned Stochastic crossover signals using EMA structure and swing-based directional filtering for market analysis.

REMS - Deep SynergyThis is a more flexible version of the REMS Synergy indicator. Like other indicators in the REMS family, it builds upon the foundations assessing the relationships between RSI, EMAs, MACDs, and Stochastic RSI across multiple timeframes. Designed to help traders identify less frequent, but high probability entries across 2 time frames. Uses 3 levels of confluence indicators for both long and short moves.
Features 3 levels of confluence across 2 timeframes. All 3 levels allow filtering of any combination of REMS filters. Features more options and customization than previous REMS Synergy.
Includes VWAP and 4 EMAs as optional visual representations.
Includes 'Enhanced Candles' than can colour code candlesticks for better visual identification. (off by default)
Originally designed with 5 minute and 2 minute timeframes in mind, and pairs well with REMS First Strike and/or REMS Snap Shot indicators.
This version features no hard-coded inputs and allows for more freedom than previous version. With the added flexibility comes the ability for the indicator to be more easily stacked.

Slow Stochastic 3-Minute Signalsdisplay B for buy signal, s for sell signal for slow stochastic 3 minute time frame

多周期Stoch RSI共振指标Multi-period Stoch RSI resonance indicator
This is a multi-period resonance indicator,4h、1h、30m、15m

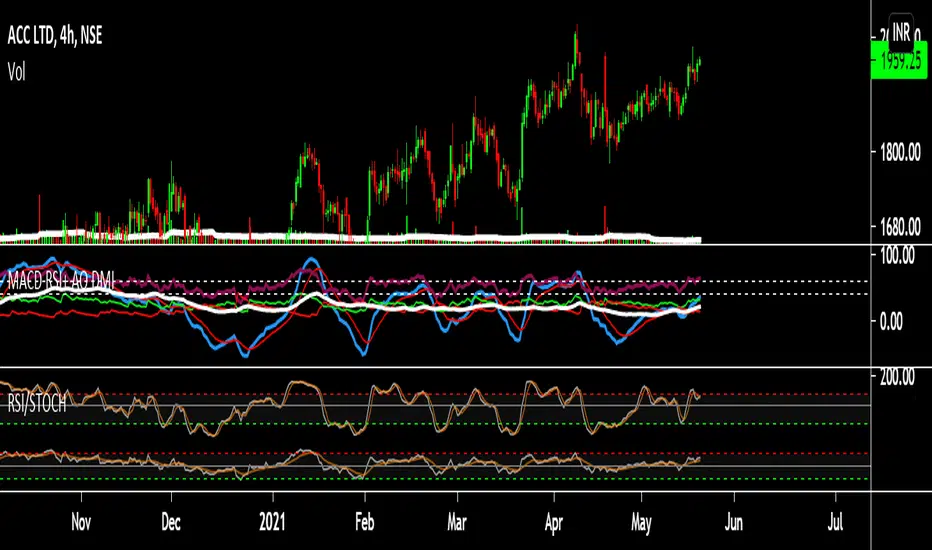
CMF, RSI, CCI, MACD, OBV, Fisher, Stoch RSI, ADX (+DI/-DI)Eight normalized indicators are used in conjunction with the CMF, CCI, MACD, and Stoch RSI indicators. You can track buy and sell decisions by tracking swings. The zero line is for reversal tracking at -20, +20, +50, and +80. You can use any of the nine indicators individually or in combination.

CMF, RSI, CCI, MACD, OBV, Fisher, Stoch RSI, ADX (+DI/-DI)Eight normalized indicators are used in conjunction with the CMF, CCI, MACD, and Stoch RSI indicators. You can track buy and sell decisions by tracking swings. The zero line is for reversal tracking at -20, +20, +50, and +80. You can use any of the nine indicators individually or in combination.


RSI + Stoch + Bollinger — Tableau compact (coin sup. droit)RSI + Stoch + Bollinger — Tableau compact (coin sup. droit)

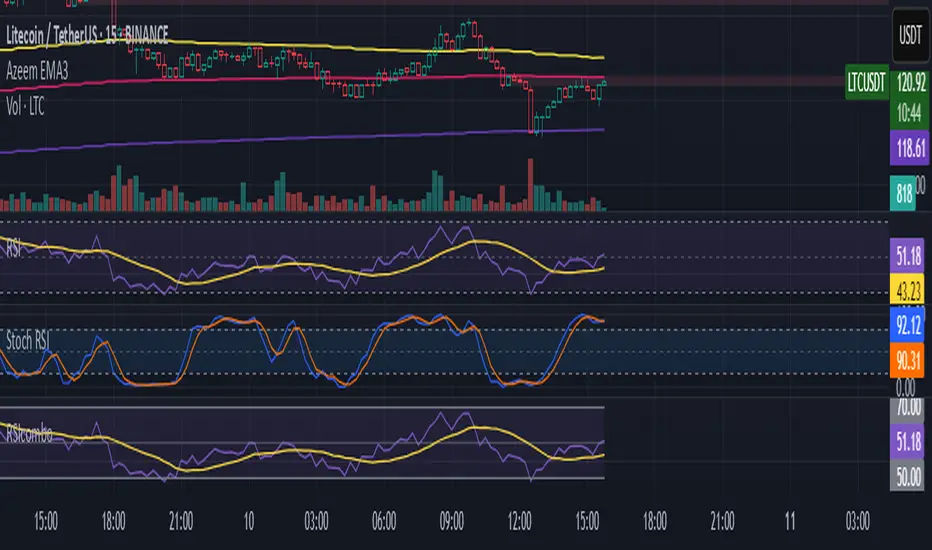
RSI/Stoch RSI ComboIt shows both rsi and stoch rsi as one indicator. You need to select which one using checkbox.
🔍 Confirmed Scalping Signals (Stoch+EMA+Supertrend)🔍 Confirmed Scalping Signals (Stoch+EMA+Supertrend)
Trend Momentum Strength Indicator, Built for Pairs TradingOverview:
This script combines multiple indicators to provide a comprehensive analysis of both trend strength and trend momentum. It is tailored specifically for pairs trading strategies but can also be used for other trading strategies.
Benefit of Comprehensive Analysis:
Having an indicator that evaluates both trend strength and trend momentum is crucial for traders looking to make informed decisions. It allows traders to not only identify the direction and intensity of a trend but also gauge the momentum behind it. This dual capability helps in confirming potential trade opportunities, whether for entering trades with strong trends or considering reversals during overbought or oversold conditions. By integrating both aspects into one tool, traders can gain a holistic view of market dynamics, enhancing their ability to time entries and manage risk effectively.
Features:
* Trend Strength:
Enhanced ADX Formula: The script includes modifications to the standard ADX formula along with DI+ and DI- to provide more responsive trend strength readings.
Directional Indicators: DI+ (green line) indicates positive directional movement, while DI- (red line) indicates negative directional movement.
Trend Momentum:
Modified Stochastic Indicators: The script uses %K and %D indicators, modified and combined with ADX to give a clear indication of trend momentum.
Momentum Strength: This helps determine the strength and direction of the momentum.
Trading Signals:
Combining Indicators: The script combines ADX, DI+, DI-, %K, and %D to generate comprehensive trading signals.
Optimal Entry Points: Designed to identify optimal entry points for trades, particularly in pairs trading.
Colored Area at Bottom:
This area provides two easy-to-read functions:
Color:
Green: Upward momentum (ratio above 1)
Red: Downward momentum (ratio below 1)
Height:
Higher in green: Stronger upward momentum
Lower in red: Stronger downward momentum
Legend:
Green Line: DI+ (Positive)
Red Line: DI- (Negative)
Black Line: ADX
How to Read This Indicator:
1) Trend Direction:
DI+ above DI-: Indicates an upward trend.
DI- above DI+: Indicates a downward trend.
2) Trend Strength:
ADX below 20: Indicates a neutral trend.
ADX between 20 and 25: Indicates a weak trend.
ADX above 25: Indicates a strong trend.
Trading Signals in Pairs Trading:
Neutral Trend: Ideal for pairs trading when no strong trend is detected.
Overbought/Oversold: Uses %K and %D to identify overbought/oversold conditions that support trade decisions.
Entry Signals: Green signals for long positions, red signals for short positions, based on combined criteria of neutral trend strength and supportive momentum.
Application in Pairs Trading:
Neutral trend: In pairs trading strategies, where neutral movement is often sought, this indicator provides signals that are especially relevant during periods of neutral trend strength and supportive momentum, aiding traders in identifying optimal entry
Risk Management: Combining signals from ADX, DI+, DI-, %K, and %D helps traders make more informed decisions regarding entry points, enhancing risk management.
Example Chart (The indicator is on the upper right corner):
Clean Presentation: The chart only includes the necessary elements to demonstrate the indicator’s functionality.
Demonstrates: Overbought/oversold conditions, upward/downward/no momentum, and trading signals with/without specific scenarios.

Dynamic Momentum Oscillator (DMO) [Angel Algo]Dynamic Momentum Oscillator (DMO)
OVERVIEW: The Dynamic Momentum Oscillator (DMO) is a technical indicator designed to measure the momentum of price movements in financial markets. It combines momentum calculation with dynamic range assessment to provide insights into potential trend reversals and overbought/oversold conditions.
DMO is different from classic momentum oscillators like the RSI or Stochastic Oscillator because it looks at the momentum in relation to how much the price is moving. This helps it give signals that better match what's happening in the market, especially when the market's volatility is changing.
HOW TO USE:
Interpretation:
Thresholds: Horizontal lines mark user-defined threshold levels for overbought (OB) and oversold (OS) conditions, aiding in identifying potential trend pullbacks and reversals.
DMO Line: The primary line on the indicator plot. It reflects momentum in relation to the dynamic price range. Positive values indicate bullish momentum, while negative values indicate bearish momentum.
Filled Area: The area between the DMO line and the zero line is filled with color to enhance visualization of momentum shifts.
Trading Signals:
Thresholds: Monitor for potential trend reversals when the DMO crosses above the overbought threshold or below the oversold threshold.
Crossovers: Look for buy signals when the DMO line crosses above the zero and sell signals when it crosses below.
Filled Area: The green color indicates bullish momentum, red indicates bearish momentum and gray color indicates neutral conditions.
Signals: Circles appear on the chart when the DMO crosses the overbought or oversold thresholds, indicating conditions for potential trend pullbacks or reversals.
SETTINGS:
Length: Adjust the length parameter to vary the number of periods considered in the momentum calculation.
Smoothing: Enable or disable smoothing of the DMO line using the provided option.
Thresholds: Customize the overbought and oversold threshold levels to suit specific market conditions and trading preferences.
Disclaimer: The DMO indicator serves as part of a comprehensive trading strategy and should not be solely relied upon for trading decisions. Past performance is not indicative of future results, and trading involves inherent risks.

Velocity Indicator [CC]The Velocity Indicator was created by Scott Cong (Stocks and Commodities Sep 2023, pgs 8-15). This is my variation of his formula designed to capture the overall velocity of the underlying stock by applying the typical velocity formula. This indicator is visually similar to a typical stochastic indicator but uses a different underlying calculation. This works well as a momentum indicator, and the values are completely unbounded, so the best ways to determine bullish or bearish trends is either by using a crossover or crossunder between the indicator and the midline or to buy or sell the indicator when it reaches a high or low point and starts to fall or rise respectively. For my default version, I used the zero line to help determine the bullish or bearish trends. I have also included multiple colors to differentiate between very strong signals and normal signals, so very strong signals are darker in color, and normal signals use lighter colors. Buy when the line turns green and sell when it turns red.
Let me know if there are any other indicators or scripts you would like to see me publish! I will have some more new scripts in the next week or so.

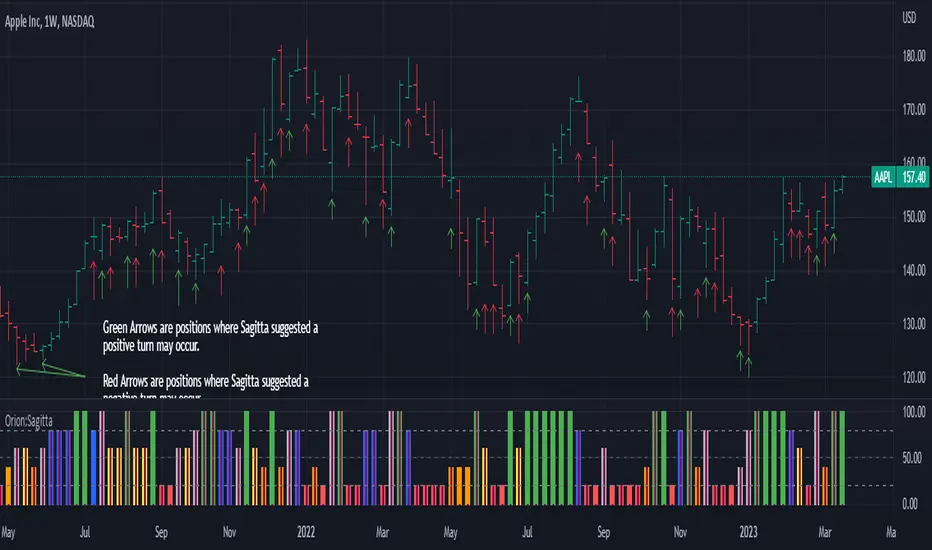
Orion:SagittaSagitta
Sagitta is an indicator the works to assist in the validation of potential long entries and to place stop-loss orders. Sagitta is not a "golden indicator" but more of a confirmation indicator of what prices might be suggesting.
The concept is that while stocks can turn in one bar, it usually takes two bars or more to signal a turn. So, using a measurement of two bars help determine the potential turning of prices.
Behind the scenes, Sagitta is nothing more than a 2 period stochastic which has had its values divided into five specific zones.
Dividing the range of the two bars in five sections, the High is equal to 100 and the Low is equal to 0.
The zones are:
20 = bearish (red) – This is when the close is the lower 20% of the two bars
40 = bearish (orange) – This is when the close is between the lower 20% and 40% of the two bars.
60 = neutral (yellow) – This is when the close is between the middle 40% - 60% of the two bars.
80 = bullish (blue) – This is when the close is between the upper 60% - 80% of the two bars.
100 = bullish (green) – This is when the close is above the upper 80% of the bar.
The general confirmation concept works as such:
When the following bar is of a higher value than the previous bar, there is potential for further upward price movement. Conversely when the following bar is lower than the previous bar, there is potential for further downward movement.
Going from a red bar to orange bar Might be an indication of a positive turn in direction of prices.
Going from a green bar to an orange bar would also be considered a negative directional turn of prices.
When the follow on bar decreases (ie, green to blue, blue to yellow, etc) placing a stop-loss would be prudent.
Maroon lines in the middle of a bar is an indication that prices are currently caught in consolidation.
Silver/Gray bars indicate that a high potential exists for a strong upward turn in prices exists.
Consolidation is calculated by determining if the close of one bar is between the high and low of another bar. This then establishes the range high and low. As long as closes continue with this range, the high and low of the range can expand. When the close is outside of the range, the consolidation is reset.
Signals in areas of consolidation (maroon center bar) should be looked upon as if the prices are going to challenge the high of the consolidation range and not necessarily break through.
The entry technique used is:
The greater of the following two calculations:
High of signal bar * 1.002 or High of signal bar + .03
The stop-loss technique used is:
The lesser of the following two calculations:
Low of signal bar * .998 or Low of signal bar - .03
IF an entry signal is generated and the price doesn’t reach the entry calculation. It is considered a failed entry and is not considered a negative or that you missed out on something. This has saved you from losing money since the prices are not ready to commit to the direction.
When placing a stop-loss, it is never suggested that you lower the value of a stop-loss. Always move your stop-losses higher in order to lock in profit in case of a negative turn.
inverse_fisher_transform_adaptive_stochastic█ Description
The indicator is the implementation of inverse fisher transform an indicator transform of the adaptive stochastic (dominant cycle), as in the Cycle Analytics for Trader pg. 198 (John F. Ehlers). Indicator transformation in brief means reshaping the indicator to be more interpretable. The inverse fisher transform is achieved by compressing values near the extremes many extraneous and irrelevant wiggles are removed from the indicator, as cited.
█ Inverse Fisher Transform
input = 2*(adaptive_stoc - .5)
output = e(2*k*input) -1 / e(2*k*input) +1
█ Feature:
iFish i.e. output value
trigger i.e. previous 1 bar of iFish * 0.90
if iFish crosses above the trigger, consider a buy indicated with the green line
while, iFish crosses below the trigger, consider a sell indicate by the red line
in addition iFish needs to be greater than the previous iFish

Multi-Indicator Divergence ScreenerHere is a new screener for everyone.
I have applied my Better Divergence On Any Indicator logic to scan 3 different indicators and up to 6 different assets at one time. Shoutout to LonesomeTheBlue and QuantNomad for their respective work on divergence and scanner scripts. I've implemented similar logic to put together this scanner.
So far, I have added support for RSI, OBV, MACD, MFI, Stochastic, and FSR, though I'm happy to add more by request. Please note, for simplicity, I have removed the logic to filter for only overbought/oversold divergences. Because this can scan both centered oscillators and non-centered indicators, overbought/oversold does not apply to all of them. I may try to find a way to work in back in later, as time allows.
Personally, I like to find confluences different types of indicators. For instance, agreeable divergence with a centered strength oscillator like RSI and a volume based indicator like OBV gives me more confidence that there will be follow-through.
Like in the Better Divergence script, you can opt to scan for confirmed divergences, potential divergences, or both.
You have the option to show or hide a table that will tell you exactly which assets have divergence, on which indicator they were found, and how many points of divergence were identified. By default, bull divergences will be green, bear will be red, but you can change these base colors to your liking. Confirmed divergences are shown with a solid background, while potentials (if selected) are shown with transparent background. If all 3 of your chosen indicators have divergence in the same direction, the asset name will show in the bull or bear color to highlight the confluence.
Alerts have also been set up to fire on bar close. The message will essentially tell you the same thing the table does, but in condensed format.
You can choose to have alerts fire any time there is any divergence detected across all assets, only when there are divergences on at least 2 of the chosen indicators for a given asset, or limit them to only when all 3 indicators show divergence in agreement.

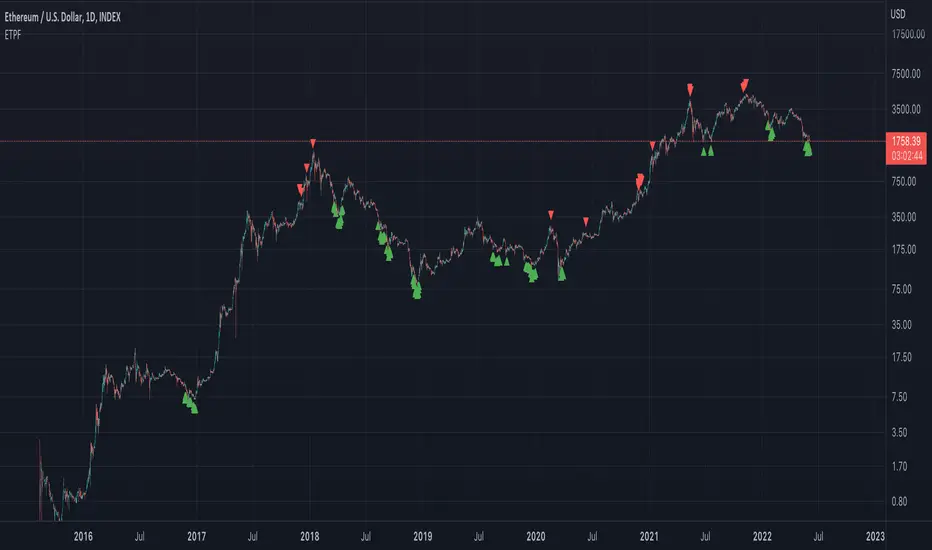
Exponential Top and Bottom FinderThis is an indicator to identify possible tops and bottoms after exponential price surges and drops, it works best on ETH 1D, but you can also use it for bitcoin and altcoins.
It's based on stochastic first and second derivatives of a close moving average
Money Maykah -- DC-ATR , Stochastic RSI signals v.1-89 --This indicator shows the Stochastic RSI (SSRI) for overbought when the Donchian Channel (DC) is in the upper zone (between basis and upper), and SSRI for oversold when the DC is in the lower zone.
The DC upper and lower have a percentage of the ATR added I call this DC-ATR.
There can be numerous ways to form a strategy based on this. For a bull trend, an ABCD could be traced by A/C = blue signals and B/D = red signals.
Let me know what you think or if there is something wrong with the code. It's probably not the cleanest or more efficient but I am not a pro. If you find a good way to make a strategy from the indicator let me know.
Hope you enjoy!
-Casey R

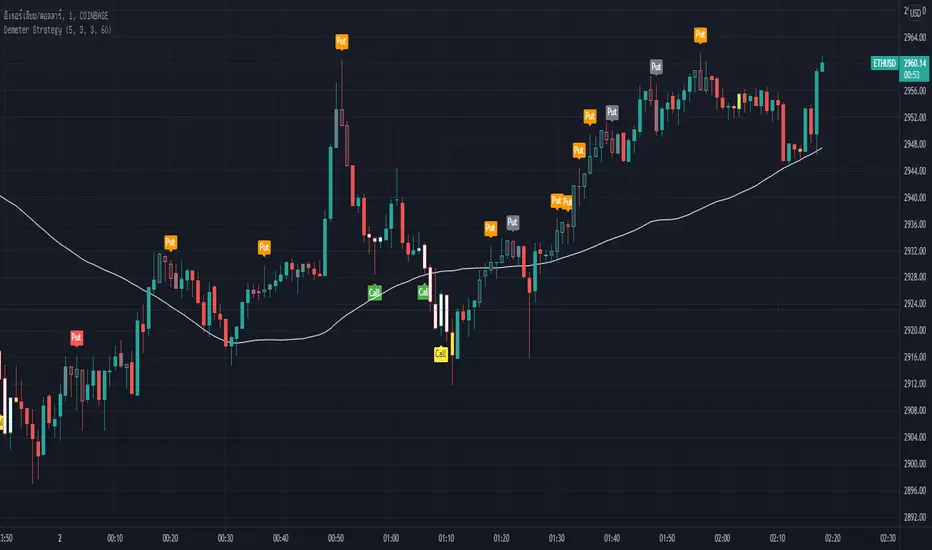
Demeter StrategyDemeter Strategy is Stochastic oscillator (5 3 3) and SMA (60) system with small modification.
This strategy has 6 signals.
(These 6 signals can be used in every market.)
Main signals :
Green Call : Call (Buy)
Reg Put : Put (Sell)
Secondary signal :
Yellow Call : Call (Buy)
Orange Put : Put (Sell)
Fast signal :
White Call : Call (Buy)
Gray Put : Put (Sell)
In trading, any signal can be used.
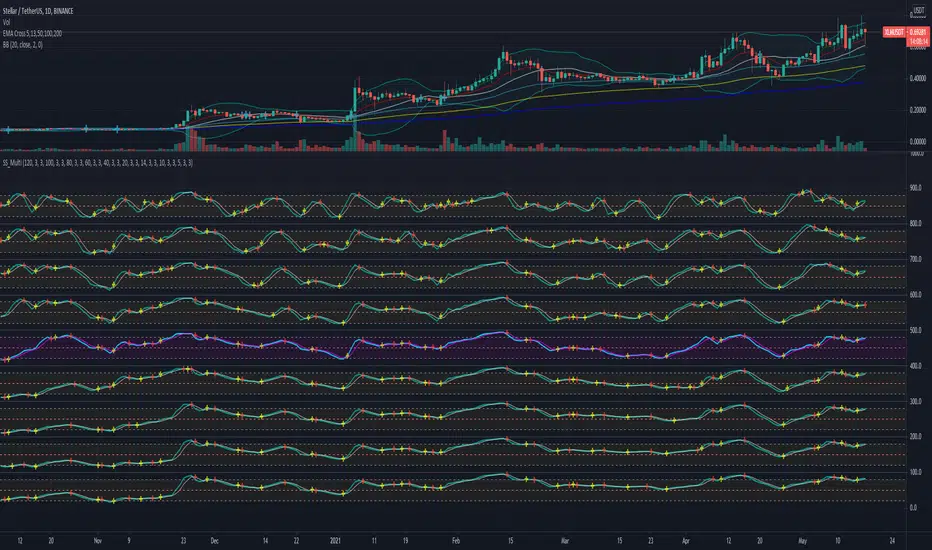
Slow Stochastic MultiFrame - AFPThis script enables you to use 9 slow stochastic with timeframe 5, 10, 14, 20, 40, 60, 80, 100, 120; on purposes to see from longterm and short term condition of a stock.
Dull Volume by EpullemanDull volume indicator with Stochastic oscillator
Blue = Dull
Red = Super Dull
helps to determine low volume movement on oversold
