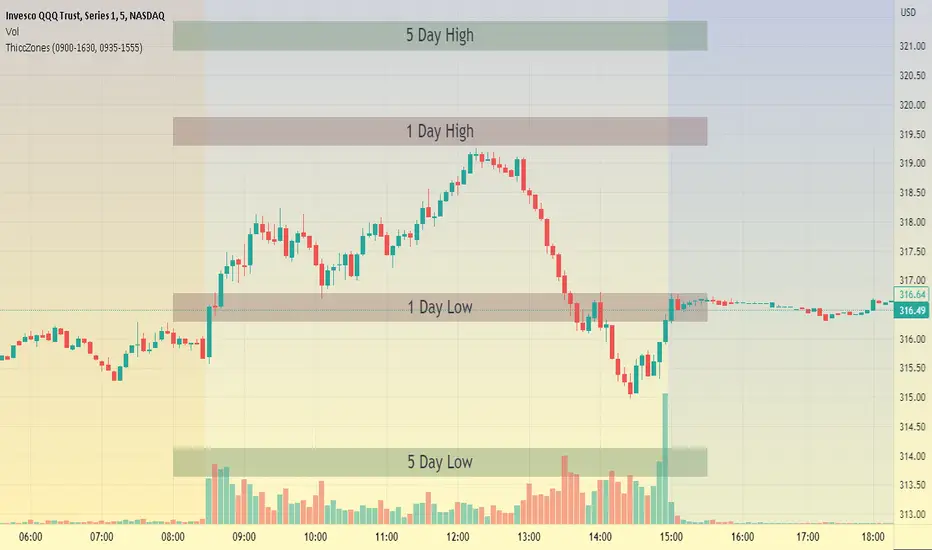
ThiccZonesThis indicator is a formula that includes 4 different zones which are different sizes based on the ticker you decide to use. It was optimized for SPY and other market ETFs but works well for all stocks on the market. The formula puts a zone at the previous day's high and low, and the previous 5 day's high and low. These zones are meant to be used as support and resistance and can even overlap, creating a 'master zone'. This is different than other zone indicators because the formula for these zones is something I created myself and have been unable to find on here. I have had the most success using a 1-15 minute chart and using my zones for reversal areas. I often look for other indications of reversal as well that line up with the area of the zones. It can also be used on the break and retest of these zones. I have found that when a stock breaks one of these zones it will often retest and continue that trend.
Support
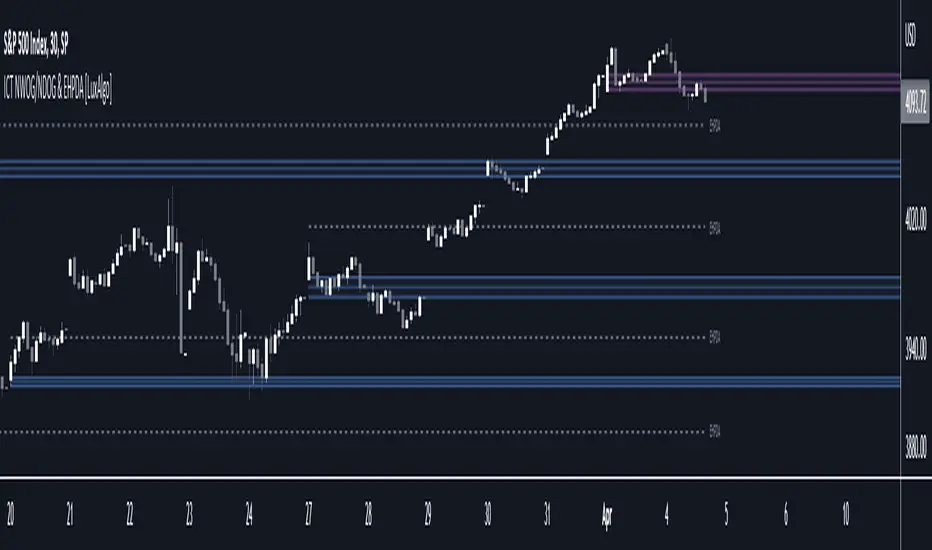
ICT NWOG/NDOG & EHPDA [LuxAlgo]This indicator displays New Week/Day Opening Gaps alongside Event Horizon PD Arrays which were conceptualized by a trader, ICT.
🔶 SETTINGS
Show: Determines if new week opening gaps (NWOG) or new day opening gaps (NDOG) are shown.
Amount: Controls the amount of most recent NWOGs/NDOGs to display on the chart.
Show EHPDA: Displays Event Horizons PD arrays.
🔶 USAGE
New Week/Day Opening Gaps are generally used as potential support or resistance areas.
Trader ICT describes that under consolidating market conditions, price tends to revert towards the opening gap area. This is consistent with other analysis suggesting that price has a tendency to come back toward gaps, ultimately looking to fill them.
ICT also introduces a novel concept, the "Event Horizon PD Array" (EHPDA) which are intermediary levels constructed from the average between the neighboring NWOGs or NDOGs.
EHPDA's are described by ICT as levels that "will not allow price to escape to the NWOG that will create a surge towards the NWOG it got too "close" to but has not yet reached."
Swing BoxesHey, folks!
Sorry for not posting anything for such a long time. Don't have enough ideas and resources to get inspiration, so trying to brainstorm good stuff in my free time from university studies.
But despite my absence more I now have 300+ people subscribed to me! Thanks, guys, for keeping interest for my work, as I still do value each boost on my script, for real :)
So here is new script , enjoy!
Swing Boxes is pretty simple indicator, which plots signals with "boxes", that help you determine price targets.
What is the idea behind?
I wanted to make indicator, that could help me make swing trades with nice accuracy (as all we want, lol), and for signal criteria I decided to use highs and lows of the price . Then I started coding some ideas to see which of them could be worthy. And, actually, Swing Boxes appeared to be good. But the thing is, that I didn't intend to build them, they appeared as an anomaly from my code :)
I started to explore this anomaly (it looked super cool, but was repainting hard) to fix it and I succeeded, now Swng Boxes don't repaint.
The main idea is that when price goes above it's highest value of p-bars back or below it's lowest value p-bars back, then there is a some god probability, that price will continue to follow current direction.
And the things about Swing Boxes is that when there is a good trend movement, the boxes become super small to track price movement and when price breaks out in the counter-trend direction, then you will be able to almost perfectly catch a top or a bottom! But most of the signals won't be so high-quality, so don't think that is this some holy grail to trade swing-trading, because it is not.
Signal logic
Quick hint:
- epsilon(variable e ) = ATR * ATR_Factor . It is used to determine box's sensitivity to price changes.
If previous close is higher than variable, which contains previous HIGHEST value (variable h in the code), then update the this variable by taking up-to-date highest value and add epsilon( e ) to it;
If previous close is lower than variable, which contains previous LOWEST value (variable l in the code), then update the this variable by taking up-to-date lowest value and substract epsilon( e ) from it.
Variables decribed above ( h and l ) are box's top and bottom respectively, so if price cross them, it is logical to update it is value.
Settings and what is what
Swing Box Period - numbers fo bars in the past to find highest and lowest price from. The bigger the input, the bigger the boxes will be;
ATR Period;
ATR Factor - multiplier for ATR, determines sensitivity for price changes. The bigger this input, the more accurate signals will be, but less the probability that the signal will be on the top or a bottom.
Show Boxes? - when chosen, plots box's top and bottom. Used to determine price targets.
Show Baseline? - when chosen, plot's baseline, which midline between box's top and bottom.
How to use?
This indicator plots green and red triangles by default.
- Green triangle --> Buy ;
- Red triangle --> Sell ;
As I've said before, many signals from indicator will probably be garbage, so you need to tune settings for youself, so it could satisfy you .
You can enable showing boxes to see box's top and bottom. Box's bottom --> your entry, top --> your profit target.
If you find a way to sort bad signals, you will be able to trade with super cool RR, because the signal from Swing Boxes appear to be a good one, there is almost 95% probability, that price will not even come close to your stop loss, so you can trade with super small stop-losses! Smaller stop-loss --> smaller risk --> smaller loss --> bigger profit, it is that easy.
Also you can enable baseline to use at as your 1st TP, and box's top/bottom as 2nd TP, closing 25% on TP1 and the rest on TP2 (but that is just mine recommendation, you can use different RM (risk-management), if you want).
Also you can use baseline as your S/R (Support/Resistance) line, test it out on your charts.
And please, hear me out: as all other indicators out here on the TradingView, Swing Boxes ARE NOT meant to be traded in solo! Many bad signal can go in a row, so PLEASE find your way to filter out bad signals with other indicators.
You can see here the example of a garabge-class signal in a row, so be don't be deluded!
I do hope that somebody will suggest and idea to improve this thing, as I personally don't have enough time to think about it because of my university studies, but I will probably try it make this thing better throughout the time.
And that's it for now, folks! If you have any ideas for scripts, strategies or anything else, feel free to DM me or leave a comment, I will check it.
Hope you will find this script useful.
Take your profits!
- Tarasenko Fyodor

Strongest Supports And ResistancesDraws the best support and resistance lines. How it works:
1) Tries every possible line through lows, highs, opens, closes
2) Finds the total hit counts given the confidence interval as input to the candlesticks
3) Calculates the strength of every line according to hit count, total volumes on hits, and timestamps
4) Eliminates similar lines, confidence interval is set as input
5) Selects the strongest 20(changable as an input) lines and draws them on the graph.
Makes your work way easier!!!
Feel free to adjust the parameters for your own style!
Cheers!!

Volume Based Support & ResistanceThis script uses the Volume of each candle to find support and resistances on the whole visible chart. There is a single easy to use setting that is the Distance between major S/R lines which is 10% for the default and better for Daily timeframe. If you set a lower number, for example 5% then there will be more lines on the chart which is better for lower time frames and higher number like 20% maybe better for weekly timeframes.
It is developed based on using for Bitcoin daily timeframe, but it can be used for any symbol on any timeframe with the proper settings.
The limitation is the number of visible candles which the data and S/R lines are calculated based on them (if the previous data was within the same price range and if not, there is no issue).
Also, this code is a good learning example of using arrays and lines together in the trading view's pine script.

The Perfect Support & ResistanceSupport & Resistance drawn based on overbought & oversold RSI . where the overbought acts as resistance and oversold acts as support.
It has 2 levels (for support and resistance - i call them level_n_high or level_n_low) for each lookback period. it checks the highest pivot and the lowest pivot based on the lookback period then we compare if rsi is higher than the highest pivot or the lowest pivot and we also check if rsi is overbought or oversold and if the statement is true, then we assign the high to the variable level_n_high or level_n_low. n being the number of levels. in total there are 5 levels with both high & low for 5 lookback periods. This is basically how the code works.
these levels can be accessed at any timeframe. the defaults are 5m and 30m.
RSI settings: (default)
-------------------
length - 14
source - close
overbought - 70
oversold - 30
lookback settings: (default)
---------------------
lookback_0 - 200
lookback_1 - 100
lookback_2 - 50
lookback_3 - 20
lookback_4 - 10
Timeframe Settings: (default)
-------------------
htf1 - 5m
htf2 - 30m
Enjoy!

Fibonacci Levels Based on Supertrend [By MUQWISHI]A “ Fibonacci Levels Based on Supertrend ” indicator is supertrend indicator planned with Fibonacci retracements levels. Fibonacci retracements provides a sequence of levels starting from 0% to 100% in addition to extension levels. 0% is measured to be the initial Supertrend line, and 100% is the previous Supertrend line where it has been broken by candle. This tool could be valuable in terms of managing trades by setting targets and reducing the risk in the trend direction.
█ OVERVIEW
█ INDICATOR SETTINGS
Please let me know if you have any questions.
Thank you.

PSAR-Support ResistanceParabolic Support Resistance -PSAR SR is based on the Dynamic Reversal Points of Price. This indicator eliminates the false signals of regular Parabolic SAR (Stop and Reverse). The Price of previous SAR Reversal point is plotted as Support and Resistance. The idea is to trade only after the previous reversal point is crossed and a new candle formation above / below the support resistance lines.
Price moves sideways in between the S/R Lines mostly.
Buy and Sell Signals are based on normal P-SAR settings however this S/R must be considered. Please be aware that the indicator cannot be used as a stand alone. Please make required confirmations before going into action.
Disclaimer: Please use it at your own Risk.

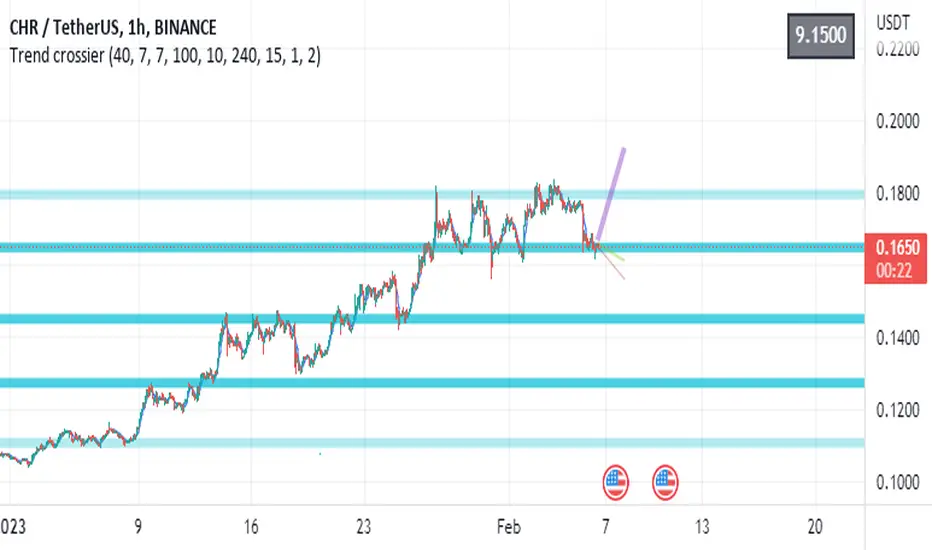
Trend crossierHello there!
I would like to share my script.
This is S/R levels indicator based on custom range for each step used for computing minimum/maximum of the range.
For example - we predefined step with 50 candles as one, after we have got the minimum and maximum of it - we come to the next 50 candles and do the same to it.
Finaly - we have got 20 lines for 10 steps.
After that - we set the ( SMA * mult) to have step between lines and if N of lines in range of step from eachother(if a+step > b and b+step > c ...) we call it a strong level.
It is not my idea(but my code), so I do not claim the uniqueness of this idea (the customer asked me to code it, but I also read about this method in open sources before).
The second thing - vectors of current trend direction on different timeframes.
For this task I took the same ranges, but ema () of each range. After first step it has an array with N values.
The next thing it does is take out "chain" one by one on each iteration. How does it do that? We take new AVG with neighbor values.
If we have 10 length at start - after iteration it becomes 9. So it repeats computing till length is 2.
After we have 2 points left - we can plot the line using indexes.
This way we can see the trend direction on different timeframes.
Feel free to use, change, put into another scripts. You can even never use it!
The right to publish this particular code was issued by the customer.
Have fun!
Sup/Res Levels [QuantVue]Shows basic pivot point of support and resistance levels. Will show alerts for break of sup. or res. Allows for a volume filter for sup. res. breaks as well.
"B" means break of either a Sup. or Res. level with volume greater than the threshold.
"Bull/Bear Wick" means bullish/bearish candle on break.
Left - number of bars left hand side of the pivot .
Right - number of bars right hand side of the pivot .
Volume Thres. - the threshold value (%) for the Volume.
This indicator is useful to filter our insignificant breaks of sup. or res. Can help trader determine when to sit on their hands, or enter a trade.

Support and Resistancewhat is "Support and Resistance"?
it is a support and resistance indicator.
what it does?
it draw support and resistance zones on the chart.
how it does it?
It determines the zones where the price leaves with a big candle after going horizontal for a while as support or resistance zones according to the price movement direction. while doing this, it compares the size of the candles and the elapsed time.
how to use it?
Red zones represent resistance and green zones represent support. You can buy in the support zone or sell in the resistance zone. my advice is to make your own interpretation by taking into account the price movement with different indicators. they are considered useful if there is a closure beyond the zones. otherwise, they continue to be shifted to the right.
notice: As new zones are created, old ones may disappear. so it might be wise to draw boxes using drawing tools where the old zones are.
Support and resistance are very important concepts for technical analysis. so I am thinking of updating and improving this indicator many times in the long run. but I couldn't wait long to post it.
examples:

Anchored VWAP BandSimple script to anchor vwap to a drag and drop spot on the chart and display it as a band instead of a line.
the AVAP Band displays:
1. The AVWAP using High as the source
2. The AVWAP using OHLC4 as the source
3. The AVWAP using Low as the source
This is just a different way of visualising VWAP from an anchored point in time (Band vs Line)
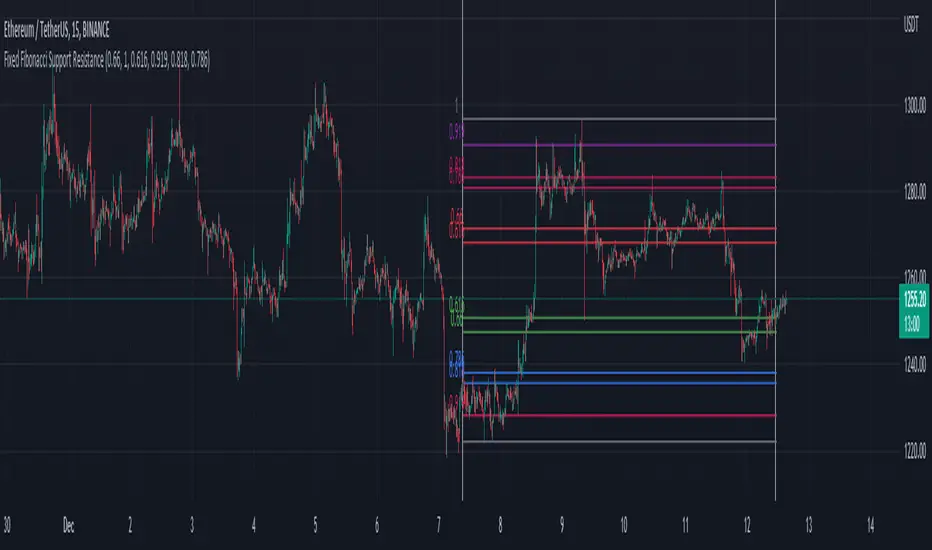
Fixed Fibonacci Support ResistanceI took the formula of the fibonacci from LonesomeTheBlue and made this script. You can take a look at his indicator here:
When you first add the indicator on the chart, click on the chart to select the first date and then the second date. It will then calculate the fibonacci support and resistance of the range you choose. You can also choose the date inside the inputs.
Be sure the first date is before the second date, otherwise it won't be able to show the fibonacci. If that happen, choose a correct date in the inputs.
Simple OHLC Custom Range Interactive█ OVERVIEW
This indicator show lines of OHLC which can be commonly used as support and resistance zones.
OHLC can be shown table with candlestick visual.
Color of candlestick depends on direction of bullish / bearish of the chosen candlestick.
█ INSPIRATION
Inspired by design, code and usage of CAGR . Basic usage of custom range / interactive, pretty much explained here . Credits to TradingView .
█ FEATURES
Table can positioned by any position and font size can be resized.
OHLC can be in full or simple name.
Lines can be extend either right, left, both or none.
█ HOW TO USE
Only 1 point is required.
Dont worry about magnet, point will attached depends on High or Low of the candle.
█ USAGE / TIPS EXAMPLES (Description explained in each image)

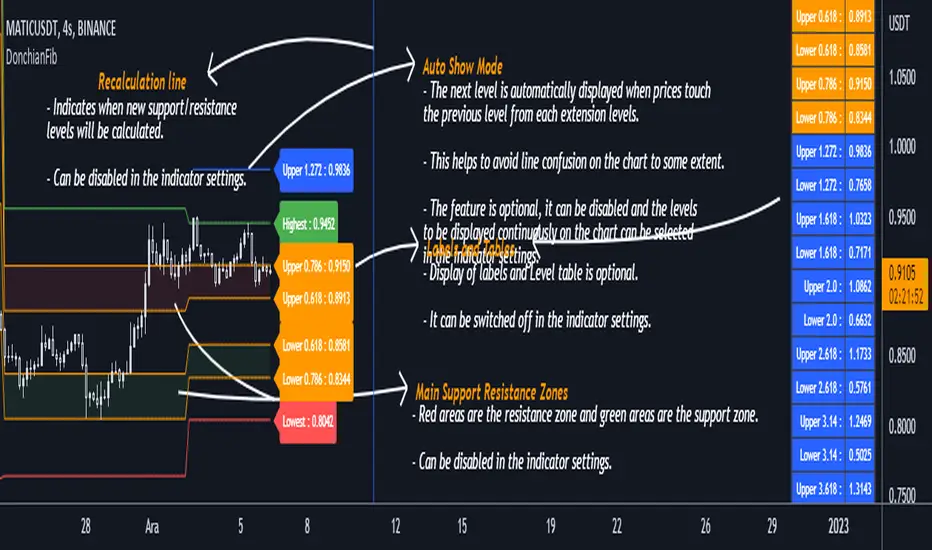
DonchianFib[Akcay]How does it work?
- The indicator detects the highest and lowest price level in the last x periods every time prices advance by x periods.
- From these values, retracement (0.618, 0.786) and expansion levels (1.272, 1.618, 2, 2.618, 3.14, 3.618, 4.236) are obtained.
- Since the symmetrical counterpart of the retracement levels is used, there are two of each of the 0.618 and 0.786 lines, for a total of four.
How can it be used?
- It can be used for step buying.
- It can be used for step selling.
- Can be used to set a profit target.
- Can be used to set a stop target.
- This indicator can be used in the same way as Pivot levels can be used. You can think of this indicator like the Pivot Points Standard indicator, where you set the period more flexibly.
Which indicators can it be combined with?
- I don't think there are any limitations, but I think it is compatible with trend detection indicators, trend detection with DonchianFib, and stepped buy/sell with limit orders.
- If you want to enter a position with mismatch signals, you can wait for the DonchianFib levels to break.
- Its use is limited by your imagination :)
Where does the name come from?
- As the name suggests, Donchian Channels. I was inspired by Donchian Channels when developing the indicator. Donchian channels show the highs and lows of prices over the last x number of periods. DonchianFib does this once for every x periods and uses the fibonacci levels to create upper and intermediate levels.
Note : I don't know if such an indicator has been done before or not. If it has been done, I haven't seen it in tradingview.
Çalışma mantığı nedir ?
- Gösterge, fiyatlar her x periyot kadar ilerlediğinde son x periyot içerisindeki en yüksek ve en düşük fiyat seviyesini tespit eder.
- Bu değerler üzerinden geri çekilme (0.618, 0.786) ve genişleme seviyeleri (1.272, 1.618, 2, 2.618, 3.14, 3.618, 4.236) elde edilir.
- Geri çekilme seviyelerinin simetrik karşılığı kullanıldığından 0.618 ve 0.786 çizgilerinden her birinden iki adet olmak üzere toplamda dört adet bulunur.
Nasıl kullanılabilir ?
- Kademeli alım yapmak için kullanılabilir.
- Kademeli satım yapmak için kullanılabilir.
- Kâr hedefi belirlemek için kullanılabilir.
- Stop hedefi belirlemek için kullanılabilir.
- Pivot seviyelerinden nasıl faydalanılıyorsa bu göstergeden de aynı şekilde faydalanılabilir. Bu göstergeyi, periyodunu kendinizin daha esnek bir şekilde belirlediğiniz Pivot Noktalar Standartı göstergesi gibi düşünebilirsiniz.
Hangi göstergelerle kombine edilebilir ?
- Bunun için herhangi sınırlama yapmak doğru değil ancak trend tespit etmeye çalışan göstergelerle uyumlu olduğunu düşünüyorum. Bu göstergeler ile trend tespiti yapıp DonchianFib ile alım/satım yerleri belirlenebilir ve limit emirleri ile kademeli alım/satım yapılabilir.
- Uyuşmazlık sinyalleri ile pozisyona girilmek isteniliyorsa DonchianFib seviyelerinin kırılması beklenebilir.
- Kullanımı sizin hayal gücünüz ile sınırlıdır :)
Adı nereden geliyor ?
- Adından da anlaşılacağı üzere Donchian Kanallarından. Göstergeyi geliştirirken Donchian Kanallarından ilham aldım. Donchian kanalları fiyatların son x periyot içerisindeki en yüksek ve en düşük seviyelerini grafikte gösteriyor. DonchianFib ise bunu her x periyot için bir defa yapıp, fibonacci seviyelerini de kullanarak üst ve ara seviyeler oluşturuyor.
Not : Daha önce böyle bir göstergenin yapılıp yapılmadığını bilmiyorum. Yapıldı ise ben tradingview'da görmedim.
Multi Timeframe Support and Resistance [ABA Invest]About
Automatic level of support and resistance ( SnR ) in the chart. It helps users to decide where is the level of SnR and also optimize the level by changing the input base on their needs
Input:
Pivot - The number of bars left and right side of the pivot to choose how detailed the SnR level
Type - To draw the line on the candle wick endpoints or body
Timeframes option - you can choose to display other timeframes beside the current chart timeframe
Adaptive moving average - to help users identify breaks of the SnR level with the moving average line
Line length - length of the moving average line if you activate the adaptive moving average option
How to use:
Attach the indicator to the chart and then you will find the red and green lines. Red line work as resistance level and green line works as support level and also you can merge adjacent line levels into an area of SnR.
The Adaptive moving average (AMA) line function is to see the break of SnR level and prepare for the setup.
Buy setup: AMA line break resistance level, when the price retest the support (the previous break resistance) we can enter buy trade
Sell setup: AMA line break support level, when the price retest the resistance (the previous break support) we can enter sell trade
Note: Don’t blindly follow the AMA trend signal

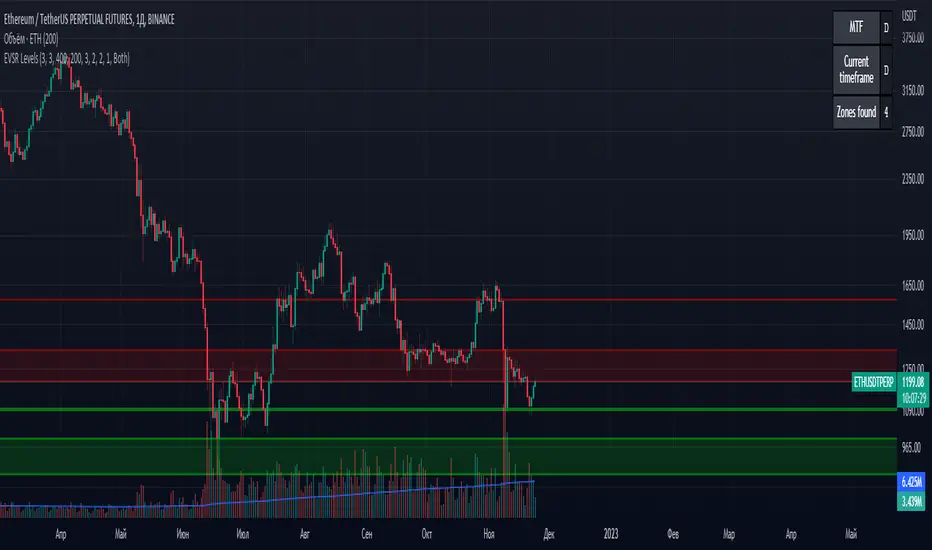
Extreme Volume Support Resistance LevelsExtreme Volume Support Resistance Levels are S/R levels(zones, basically), based on extreme volume .
Settings:
Lookback -- number of bars, which algorithm will be using;
Volume Threshold Period -- period of MA (Volume MA), which smoothers volume in order to find the extremes;
Volume Threshold Multiplier -- multiplier for Volume MA, which "lift" Volume MA and thus will provide the algorithm with more accurate extreme volume ;
Number of zones to show -- number of last S/R zones, which will be shown on the chart.
RU:
Extreme Volume Support Resistance Levels — это уровни S/R (зоны, в основном), основанные на избыточном объеме.
Параметры:
Lookback -- число баров, которое алгоритм будет использовать для расчётов;
Volume Threshold Period -- период MA (Volume MA), которая сглаживает объем для нахождения экстремумов объёма;
Volume Threshold Multiplier -- множитель для Volume MA, который "поднимает" Volume MA и тем самым обеспечивает алгоритм более точными значениями экстремального объёма;
Количество зон для отображения -- количество оставшихся зон S/R, которые отображаются на графике.
VWAP & Previous VWAP - MTF█ Volume Weighted Average Price & Previous Volume Weighted Average Price - Multi Timeframe
This script can display the daily, weekly, monthly, quarterly, yearly and rolling VWAP but also the previous ones.
█ Volume Weighted Average Price (VWAP)
The VWAP is a technical analysis tool used to measure the average price weighted by volume.
VWAP is typically used with intraday charts as a way to determine the general direction of intraday prices.
VWAP is similar to a moving average in that when price is above VWAP, prices are rising and when price is below VWAP, prices are falling.
VWAP is primarily used by technical analysts to identify market trends.
█ Rolling VWAP
The typical VWAP is designed to be used on intraday charts, as it resets at the beginning of the day.
Such VWAPs cannot be used on daily, weekly or monthly charts. Instead, this rolling VWAP uses a time period that automatically adjusts to the chart's timeframe.
You can thus use the rolling VWAP on any chart that includes volume information in its data feed.
Because the rolling VWAP uses a moving window, it does not exhibit the jumpiness of VWAP plots that reset.
For the version with standard deviation bands.
MTF VWAP & StDev Bands

4C Expected Move (Weekly Options)This indicator plots the Expected Move (EM) calculated from weekly options pricing, for a quick visual reference.
The EM is the amount that a stock is predicted to increase or decrease from its current price, based on the current level of implied volatility.
This range can be viewed as support and resistance, or once price gets outside of the range, institutional hedging actions can accelerate the move in that direction.
The EM range is based on the Weekly close of the prior week.
It can be useful to know what the weekly EM range is for a stock to understand the probabilities of the overall distance, direction and volatility for the week.
To use this indicator you must have access to a broker with options data (not available on Tradingview).
Look at the stock's option chain and find the weekly expected move. You will have to do your own research to find where this information is displayed depending on your broker.
See screenshot example on the chart. This is the Thinkorswim platform's option chain, and the Implied Volatility % and the calculated EM is circled in red. Use the +- number in parentheses, NOT the % value.
Input that number into the indicator on a weekly basis, ideally on the weekend sometime after the cash market close on Friday, and before the Market open at the beginning of the trading week.
The indicator must be manually updated each week.
It will automatically start over at the beginning of the week.

Gap ZonesSharing a simple gap zone identifier, simply detects gap up/down areas and plots them for visual reference. Calculation uses new candle open compared to previous candle close and draws the zone, a mid point is plotted also as far too often it's significance is proven effective.
Works on any timeframe and market though I recommend utilizing timeframes such as weekly or daily for viewing at lower timeframes such as 5, 15 or 30 minutes.
Often price is observed reaching towards zone high/mid/low before rejection/bouncing. These gap zones can give quantitative basis for trade management.
Future features may include alerts based on price crossing up/down gap low, mid and highs. Feel free to message with any other suggestions.

MTF MA Ribbon and Bands + BB, Gaussian F. and R. VWAP with StDev█ Multi Timeframe Moving Average Ribbon and Bands + Bollinger Bands, Gaussian Filter and Rolling Volume Weighted Average Price with Standard Deviation Bands
Up to 9 moving averages can be independently applied.
The length , type and timeframe of each moving average are configurable .
The lines, colors and background fill are customizable too.
This script can also display:
Moving Average Bands
Bollinger Bands
Gaussian Filter
Rolling VWAP and Standard Deviation Bands
Types of Moving Averages:
Simple Moving Average (SMA)
Exponential Moving Average (EMA)
Smoothed Moving Average (SMMA)
Weighted Moving Average (WMA)
Volume Weighted Moving Average (VWMA)
Least Squares Moving Average (LSMA)
Hull Moving Average (HMA)
Arnaud Legoux Moving Average (ALMA)
█ Moving Average
Moving Averages are price based, lagging (or reactive) indicators that display the average price of a security over a set period of time.
A Moving Average is a good way to gauge momentum as well as to confirm trends, and define areas of support and resistance.
█ Bollinger Bands
Bollinger Bands consist of a band of three lines which are plotted in relation to security prices.
The line in the middle is usually a Simple Moving Average (SMA) set to a period of 20 days (the type of trend line and period can be changed by the trader, a 20 day moving average is by far the most popular).
The SMA then serves as a base for the Upper and Lower Bands which are used as a way to measure volatility by observing the relationship between the Bands and price.
█ Gaussian Filter
Gaussian filter can be used for smoothing.
It rejects high frequencies (fast movements) better than an EMA and has lower lag.
A Gaussian filter is one whose transfer response is described by the familiar Gaussian bell-shaped curve.
In the case of low-pass filters, only the upper half of the curve describes the filter.
The use of gaussian filters is a move toward achieving the dual goal of reducing lag and reducing the lag of high-frequency components relative to the lag of lower-frequency components.
█ Rolling VWAP
The typical VWAP is designed to be used on intraday charts, as it resets at the beginning of the day.
Such VWAPs cannot be used on daily, weekly or monthly charts. Instead, this rolling VWAP uses a time period that automatically adjusts to the chart's timeframe.
You can thus use the rolling VWAP on any chart that includes volume information in its data feed.
Because the rolling VWAP uses a moving window, it does not exhibit the jumpiness of VWAP plots that reset.
Made with the help from scripts of: adam24x, VishvaP, loxx and pmk07.

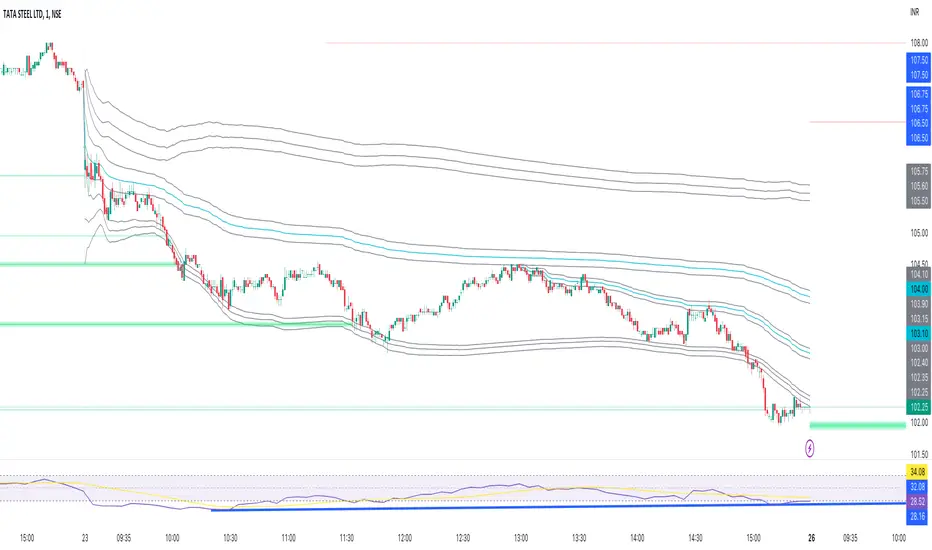
Trend SuggestionsThis brings together a number of variables to produce trend predictions that could be utilized as decision-making tools.
Uses the aforementioned price and volume derivatives
- A moving average and three weighted moving averages (WMA1, WMA2, WMA3)
- Super Trend Line (ST)
- Opening Range Breakout on Five Minutes, Resistance Bands Pocket pivots, support, and price volume
he Direction is determined by the High and Low Bands of WMAs and the Supertrend Line, which are used to determine the Upper and Lower Lines around the Price. When the price passes below the lower boundary of the band, a downtrend is said to have begun.
Similarly, for an uptrend, this continues until the price passes over the upper edge of the band. Teal for an uptrend and fuchsia for a downturn area shared by the band to identify the trend.
The first five minutes of the breakout lines have a tiny buffer augmentation of 11% applied to them.
Based on what has been observed, support and resistance zones have been somewhat changed from the figures that are often utilized (might work other markets as well)
The markings that may be seen are as follows:
- Blue Triangle indicates a pocket pivot with an upward bias;
- Maroon Triangle indicates a pocket pivot with a downward bias;
- Teal colored Diamonds indicate price upthrusts and potential trend confirmation locations, depending on success or failure.
- Similar backdrop color changes that look as vertical shading are also used to identify them.
- Fuchsia-colored diamonds indicate price declines and a potential trend, depending on whether it persists or fails.
- Dark green and maroon square boxes indicate potential price reversals in the support and resistance bands, respectively.
It goes without saying that this work is derived from numerous other open-source community initiatives.
Feel free to adjust anything you'd like, and we appreciate any feedback.

PA Swings [TTA]Hello traders!
This script helps identify swing high levels of resistance and swing low levels of support via price action.
The indicator is designed to help identify support and resistance by measuring retracements. When the retracement has reached the threshold, the indicator identifies the high or low with a horizontal, solid line.
This line will continue until it is violated. Once it is violated it will adjust to a dashed line and continue until it is violated again (retested).
Therefore, a solid line resembles an unviolated swing level; a dashed line resembles a violated swing level that has yet to be retested.
Ideally, this script will filter some movements by identifying impulses in the market. Knowing that price is in a trending move rather than bouncing around in a range can help traders in their analysis. In range bound conditions the indicator will show small impulses, sometimes trapped by a support and/or resistance line. In trending markets there will be separation between the support and resistance lines.
Retests are also identified by the indicator.
Retests of swing highs and lows may induce precise, repeatable price moves - something a trader might find advantageous. A log is included to help identify potential price levels based on historical actions when an impulse or a retest occurs.
Consequently, this may help traders identify take-profit targets and avoid stop losses that are too close to the entry point.
The indicator has a color identity panel to help you get familiar with the colored lines, line types, and what they mean. The color panel is concealable. Additional customization options are available, such as toggling the chart labels. These labels distinguish impulses up and down, retests, and the distance price has traveled since breaking or creating a support or resistance level.
This can be toggled off. A High-Volume Swings only option is available for those that wish to filter out low volume movements (such as extended market hours).
You also have the option of hiding far away lines and can define what is “far away” for them % wise. It is defaulted to 15% which may need to be adjusted on lower timeframes.
Inactive lines can be shown or they can be removed in the settings as well. While this indicator can find some great levels of support or resistance it is important to remember that, should you find this script helpful, it is a tool in your toolbox!! (:
Hope you enjoy and thank you for checking this out!
