TDI Hedge Strategy
This is the incomplete version but upon multiple requests, I have released it early. All of the strategy and alert functions are yet to be written and I'll get around to it soon.
This indicator aims to be the best TDI indicator on TradingView. It is a strategy or study. It will have all of the filter, entry, and exit conditions for the strategies around the TDI.
What is implemented
MFI or RSI: the MFI is a much better TDI baseline than the RSI, in my opinion, and very effective
EMA or SMA used for the moving averages on fast, slow, and volatility band
Dynamic timeframe: set a factor of current timeframe and indicator will analyse higher timeframe automatically
Manual timeframe: set a higher timeframe to analyse different to currently viewed
Features for later
conditions for TDI filters/entries/exits
Strategy functions to use built-in strategy tester
BTE signal plot for Backtesting & Trading Engine
alerts
Enjoy!
波动率

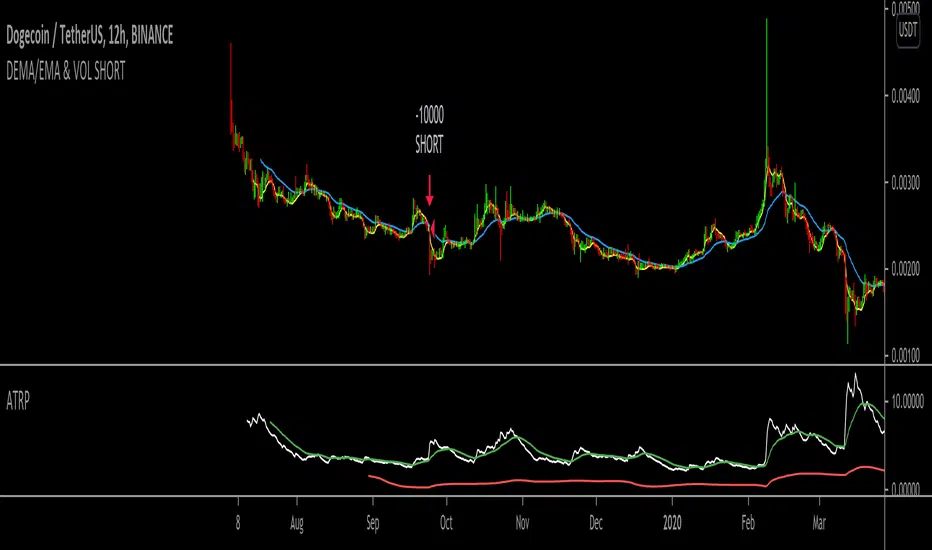
DEMA/EMA & VOL (Short strategy)Hello,
I am trying to build a short momentum strategy that is based off of the DEMA crossing under the EMA, but because many momentum strategies send too many signals, I have also implemented a volatility condition based on the average true range percentage (ATRP). Essentially, as momentum moves downwards + volatility (ATRP) moves upwards, it shorts the security. However, I am having an issue with exiting trades. I think this would be a great strategy if I could simply get the strategy to exit the trades. Does anyone mind looking through the source code and tell me what I might be doing wrong? In return, I would hope that this strategy could be useful to you in same way! Thank you for looking!
3x SuperTrend Strategy (Mel0nTek) V1This is a triple SuperTrend based strategy for lower time frame trades such as day trades and scalping. I have not seen many strategies that combine multiple SuperTrends so I thought I would publish this one since I put it together and have been quite happy with the results. I have found through testing that the best results are on currency exchange markets such as Crypto or Forex on 1-15 min time frames.
The core idea was inspired by a youtube video put out by Trade Pro:
"Trade Pro - HIGHEST PROFIT Triple Supertrend Trading Strategy Proven 100 Trade Results"
I went ahead and set the defaults to the ones he uses in his video for anyone who wants to try a configuration similar to his. They work pretty well in general, however the EMA, SuperTrend ATR multipliers, and P/L ratio can be tuned/optimized to fit the timeframe/market desired. The video is quite good but not a required watch as I will explain below.
The 200EMA is used as a medium-term trend direction indicator.
- Price closing consistently above the 200EMA means that only long positions should be entered.
- Price closing consistently below 200EMA means that only short positions should be entered.
The 3 SuperTrend indicators should be used as direction confirmation for entries. Typically, price above SuperTrend indicates bullish movement, while price below SuperTrend indicates Bearish movement. However by itself, it is not a great indication to enter/exit positions in my experience. By combining 3 of them with slightly longer periods and increased ATR multipliers, we can get much stronger confirmation of trend direction/strength.
The way they are used in this strategy is such that:
- We only want to enter a position if at least 2 out of 3 SuperTrends are on our side.
- 3/3 SuperTrends on our side is the best case, since we are taking trades WITH momentum/price strength.
- The second farthest SuperTrend from entry price is used as a Stop Loss
SuperTrend being on our side is not the only requirement for an entry however. The probability of success is increased with SuperTrend, and a longer EMA on our side, but we want to be sure that we aren't getting in too late/after the movement has already happened.
So we use Stoch RSI to pick our entries where price is oversold/overbought and reversing. That means the Stoch RSI is above 80, or below 20, and our indication to enter the trade is when the 2 lines cross/begin reversing direction.
So with trend direction on our side, we can get really good entries at these oversold/overbought extremes, especially as it's reversing (Stoch RSI K and D are crossing). This allows us to use the SuperTrend as a support/stop loss on our entry since price should be above it.
Then we just target 1.5x our max loss so that even if we only win 50% of the time, we still make a profit.
The explicit rules of this strategy are as follows:
=== Rules ===
long only
- price above EMA200
short only
- price below EMA200
Stop Loss = 2nd SuperTrend line above (short) or below(long) entry candle
Profit = 1.5x SL/risk (Profit Ratio x Max Loss)
=== Entry Setup ===
LONG
- Stoch RSI below 20, cross up
- at least 2 SuperTrend lines below close
SHORT
- Stoch RSI above 80, cross down
- at least 2 SuperTrend lines above close
P.S. Special thanks to Trade Pro for producing so many quality videos, putting strategy claims to the test, and providing me with so many good ideas I apply to my own strategies.

Simple way to BEAT the market [STRATEGY]This script has been created to demonstrate the effectiveness of using market regime filters in your trading strategy, and how they can improve your returns and lower your drawdowns
This strategy adds a simple filter (A historical volatility percentile filter, an implementation of which can be found on my trading profile) to a traditional buy and hold strategy of the index SPY.
Note, There are other filters that could also be added including a long-term moving average/percentile rank filter/ADX filter etc, to improve the returns further.
The filter closes our long position during periods of volatility that exceed the 95th percentile (or in the top 5% of volatile days) and buys back when the volatility is below 95% rank of the past 100 days
Have included the backtest results since 1993 which is 28 years of data at the time of writing. Comparison of traditional buy and hold with this modified strategy can be found below:
Traditional buy and hold:
Return per year: 7.95 % (ex Dividends)
Total return: 851.1 %
Max drawdown: 50.79 %
'Modified' buy and hold (this script):
Return per year: 9.92 % (ex Dividends)
Total return: 1412.2 %
Max drawdown: 31.57 %
Feel free to use some of the market filters in my trading profile to improve and refine your strategies further, or make a copy and play around with the code yourself. This is just a simple example for demo purposes.

[KL] Bollinger bands + RSI StrategyThis strategy is based on two of my previous scripts, one called “RSI14 + 10”; the other one called “Bollinger Bands Consolidation”. At its core, it combines the main setups from each of those two scripts but excludes the auxiliary features that were considered as experimental. This strategy will identify periods of squeeze, and then enter long during consolidation with a trailing stop loss set.
Primary indicator will be the Bollinger Bands. By comparing the width of the BBs with the ATR of the same lookback period (i.e. 2 standard deviations of the 20 recent closing prices vs ATR(20) x2), we begin to look for confirmation for entry whenever the standard deviation of prices is less than the ATR. This can be seen visually in the plots (i.e. default gray lines representing ATRx2 relative to BB center line).
Confirmation for entry will be the RSIs (slow-14, and fast-10). If both are upward sloping, then we assume prices are in an uptrend and may eventually break above upper band. RSIs are typically in mid-range when prices are consolidating, therefore no need to measure it.
Exits will happen in two cases, (1) when trailing stop loss hits, or (2) when RSIs signal that the instrument is overbought. No. 1 is self-explanatory. No. 2 happens, when RSI14 reaches above 70 (can be changed), followed by RSI10 catching up and surpassing RSI14.

Moving Average ScalperThe main goal of a scalping strategy is to open and close trades frequently, profiting from small gains and limiting the downside risk.
This strategy, on average, manages to close trades within one day, meaning that you are not exposed to the risk of holding that coin for long. In this way, market conditions affect much less the overall performance of the trading system.
The setup of this strategy uses four moving averages combined with an unconventional approach. On one side, the strategy aims to catch assets trading in a downtrend but on the verge of a possible reversal. Then, the goal of the trading strategy is not to ride the eventual uptrend but to close the trade with minimal profit so that it can scan the market for a new opportunity again.
ENTRY
The buy order is placed on assets that most likely are about to have at least a short-term "relief rally." To capture this setup, the strategy buys when
the MA9 crosses above the MA50
the MA50 is lower than the MA100
the MA100 is lower than the MA200
EXIT
The trading system closes the trade when the MA9 crosses above the MA200, which could be the first major resistance the asset faces before developing a more sustained uptrend.
As a reminder, the goal of the strategy is not to catch the whole upside of the asset but has a more conservative approach. This allows keeping the risk of the strategy low.
Pro tip: The 15-min time frame has proven to return the best results on average. The strategy can work well also in the 5-min time frame.
The strategy assumes each order to trade 30% of the available capital and opens a trade at a time. A trading fee of 0.1% is taken into account.
CRYPTO 3EMA Strategy with Take Profit & Stop Loss based on ATRSimple 3 EMA Strategy with plotted Take Profit and Stop Loss
Entry condition:
- Middle EMA cross above the Slow EMA
- Set take profit and stop loss exit conditions based on ATR Indicator
Exit condition:
- Fast EMA cross below the Middle EMA

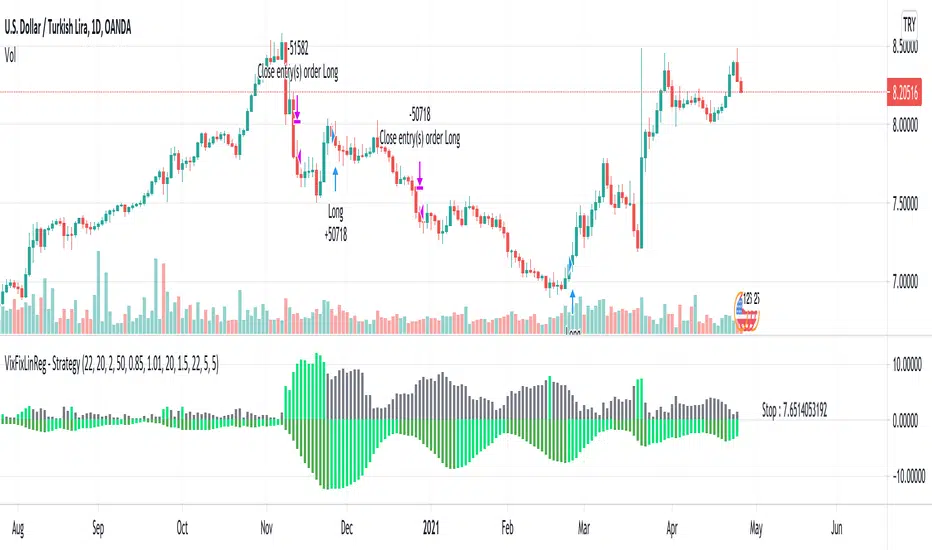
VixFixLinReg-StrategyThis idea came up while discussing about strategies with one of the trading enthusiast from tradingview community.
Strategy basically uses existing script of Vix Fix by Chris Moody:
VixFix is a great indicator for finding the market bottoms. But, sometimes it generates signal too early. But, we can apply linear regression on vix fix to find vix fix top to make timing much better.
Entry condition:
Wait for Vix fix bar to turn lime.
Once vix fix is turned lime, then wait for linear regression (shown below 0) to turn lime from green. This indicates VIX-Fix has started declining.
Go long once above two conditions are satisfied
Exit Condition:
ATR Based Stop
Applied only if linear regression is green - which means VixFix rising.
Note: This is ideal for identifying market bottom. May not yield good results on individual stocks.
Bollinger Blast Buy Unholy GrailThis strategy copy the Nick Radge's trading ideas for a profitable systems. He mentions a Bollinger Band idea which is also published in his book Unholy Grails. Nick says:
he strategy that we did test and showed very promising results was an entry using a Bollinger band and an exit using the opposite Bollinger band, but we use 3 standard deviations for the entry and 1 standard deviation for the exit, just to keep the trailing stop a little bit tighter.”
Entry: Buy on the Open the day after a stock closes above the top Bollinger Band
Exit: Exit on the Open the day after a stock closes below the lower Bollinger Band
Results tested on Nasdaq market are very good and better than simply buy& hold

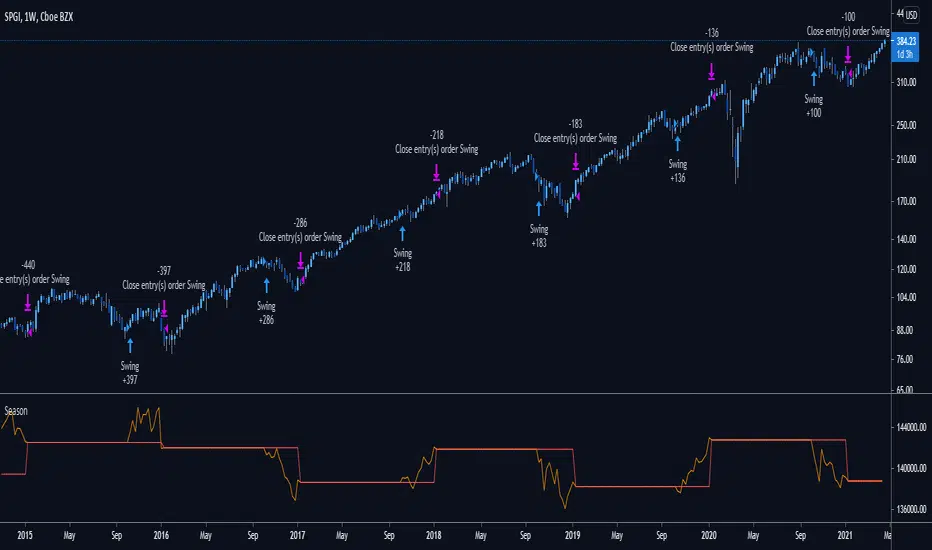
Does your trading pass the seasonality test?Are you consistently beating the standard "Buy and Hold" benchmark?
Check your performance against the next most common strategy:
Buy at the start of the holiday season and close in the new year.
By default, the strategy starts with $100,000 and risks 25% of the account on each swing trade.
Commission is set to be 0.5% of each trade.
You can tweak the direction of trades by adjusting the first setting.
Tweak the holding period by changing the Entry and Exit months.
Red plot: Balance of account
Orange plot: Equity of account
Reversal with Bollinger Bands + RSI + ADX + ATR (Upgraded)Hi,
Welcome to my 4th script.
Someone asked me some questions about the Bollinger Band strategy I previously published. When I went back to my published script I couldn't help myself but simply try and make it better. Which I did.
Since I've published that script, I've gained much more knowledge about how Pinescript functions. As well as gaining more and more knowledge about how the markets are structered etc.
In this reversal script we use 4 indicators to determine good entry signals, we determine whether the market is ranging or trending and we still only want to take trades in the direction of the "trend".
Bollinger Bands are used for our entry signal. When price hits either side of the band, we wait for a reverse candlestick before we enter a position.
RSI is used to determine if we're in a trending market or in a ranging market. You can adjust the values in the inputs. You can determine the minimum RSI value and the maximum RSI value.
ADX is used the same way as RSI, you can adjust the value in the inputs. You can determine the minimum ADX value.
Last but not least we use two EMA's, a 200 EMA and 100 EMA. Both are adjustable through the inputs. I used two EMA's because I noticed when using this strategy that we'd enter a new position often after having a bad trade. Using two EMA's might clean up some signals, in my case with EUR/USD on a 15m timeframe, it didn't clean up enough signals.
All the default values are pretty decent but might require some finetuning on a certain instrument. Don't overfit the strategy though, that'll only give you bad signals in the future.
Then we are off to our exit signals.
Initially I wanted to incorporate my previous Bollinger Band exit signals as well, but it was too much of a hassle to make the script work as intended so I left it out. If you want to use those exit signals, just find my other script.
When we're in a position and price crosses the opposite band, we wait for a reverse candlestick before we exit the position.
Additionally we want our losses to be as small as possible, so we use RSI to signal us when the market is, or starts to, trend against us. This is where you use the minimum and maximum exit values. So when RSI crosses over or under that value, it'll exit the position.
Furthermore, we use the ATR indicator to set our stop loss, which is pretty basic stuff. You can adjust the ATR multiplier in the inputs. Disabling "Use Trailing Stop?" is really inadvisable unless you know this script inside out as your only exit signals will be opposite Bollinger Band Cross and RSI overbought / oversold areas.

[laoowai]BNB_USDT_3m_3Commas_Bollinger_MACD_RSI_StrategyBNB_USDT _3m
Release Notes:
Time: 3min
Pair: BNB_USDT
Use: {{strategy.order.alert_message}}
What's the difference with 3Commas Bollinger Strategy by tedwardd:
1. Initial capital: 1210 USDT (10$ Base order / 400$*3 Safety order), if you will change, please change JUST safety order volume or number of safety orders 2-3
2. Using just 2(3) safety order (original script 4)
3. More high-performance strategy for BNB_USDT
4. Using MACD to sell order (original script take profit by scale), thanks Drun30 .
5. Using RSI to analyze the market conditions.
Need to change:
bot_id = input(title="3Commas Bot ID", defval=" YOUR DATA ")
email_token = input(title="Bot Email Token", defval=" YOUR DATA ")
---------------------------------------------------------------------------------------------------------------------------------------------------------------------------------------------------
FAQ copy from tedwardd
---------------------------------------------------------------------------------------------------------------------------------------------------------------------------------------------------
This strategy is intended for use as a way of backtesting various parameters available on 3commas.
The primary inputs for the strategy are:
---------------------------------------------------------------------------------------------------------------------------------------------------------------------------------------------------
// USER INPUTS
Short MA Window - The length of the Short moving average
Long MA Window - The length of the Long moving average
Upper Band Offset - The offset to use for the upper bollinger offset
Lower Band Offset - The offset to use for the lower bollinger offset
Long Stop Loss % - The stop loss percentage to test
Long Take Profit % - The Take profit percentage to test
Initial SO Deviation % - The price deviation percentage required to place to first safety order
Safety Order Vol Step % - The volume scale to test
3Commas Bot ID - (self-explanatory)
Bot Email Token - Found in the deal start message for your bot (see link in the previous section for details)
3Commas Bot Trading Pair - The pair to include for composite bot start deals (should match the format of 3commas, not TradingView IE. USDT_BTC not BTCUSDT )
---------------------------------------------------------------------------------------------------------------------------------------------------------------------------------------------------
Start Date, Month, Year and End Date, Month, and Year all apply to the backtesting window. By default, it will use as much data as it can give the current period select (there is less historical data available for periods below 1H) back as far as 2016 (there appears to be no historical data on Trading view much before this). If you would like to test a different period of time, just change these values accordingly.
---------------------------------------------------------------------------------------------------------------------------------------------------------------------------------------------------
Composite bot using a Bollinger band type trading strategy. While its primary intention is to provide users a way of backtesting bot parameters, it can also be used to trigger a deal start by either using the {{strategy.order.alert_message}} field in your alert and providing the bot details in the configuration screen for the strategy or by including the usual deal start message provided by 3commas.
---------------------------------------------------------------------------------------------------------------------------------------------------------------------------------------------------
Original script:
1. 3Commas Bollinger Strategy by tedwardd
2. Momentum Strategy ( BTC /USDT; 1h) - MACD (with source code) by Drun30

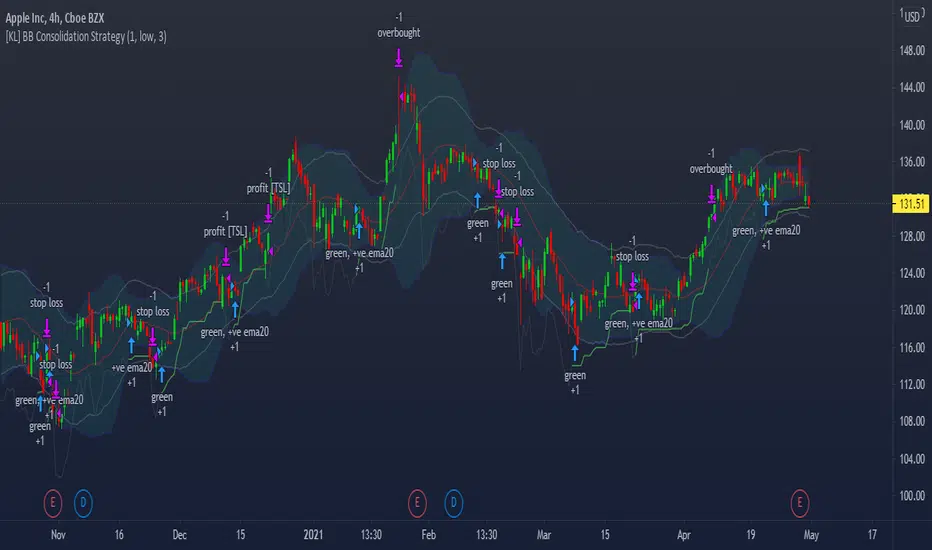
[KL] Bollinger Bands Consolidation StrategyThis strategy will enter into long position based on the volatility of prices implied by indicators of (a) Bollinger bands, and (b) ATR.
Application of Bollinger bands ("BOLL")
Using plain vanilla settings for BOLL (i.e. 20 period moving average, and 2 standard deviations of closing prices), we are interested to know about the shape of the area that is bounded by the upper and lower bands.
In theory, consolidation happens when volatility of price decreases. Visually speaking, this is represented by the narrowing of the upper/lower bands. This strategy considers the narrowing of BOLL bands as the primary indicator for long-entry.
Application of ATRs (as confirmations)
Firstly, to confirm that BOLL bands are narrowing (as mentioned above), the ATR at a potential point of entry is compared against the standard deviation of prices over BOLL's lookback periods. Once again, visualizing the shape of BOLL bands during consolidation, we assume the lines begin to squeeze when the distance between the center line and upper/lower band is less than two current ATRs.
Secondly, this strategy looks into the moving average of ATRs to assure that prices are not too choppy when entering into market. If the moving average of ATR decreases at a point in time such that all the above conditions are met, then we can assert that the volatility of price is decreasing.
Thirdly, ATR is used for determining the size of our trailing stop loss. We will keep the multiplier fixed at two.
72s Strat: Backtesting Adaptive HMA+ pt.1This is a follow up to my previous publication of Adaptive HMA+ few months ago, as a mean to provide some kind of initial backtesting tools. Which can be use to explore many possible strategies, optimise its settings to better conform user's pair/tf, and hopefully able to help tweaking your general strategy.
If you haven't read the study or use the indicator, kindly go here first to get the overall idea.
The first strategy introduce in this backtest is one most basic already described in the study; buy/sell is when movement is there and everything is on the right side; When RSI has turned to other side, we can use it as exit point (if in profit of course, else just let it hit our TP/SL, why would we exit before profit). Also, base on RSI when we make entry, we can further differentiate type of signals. --Please check all comments in code directly where the signals , entries , and exits section are.
Second additional strategy to check; is when we also use second faster Adaptive HMA+ for exit. So this is like a double orders on a signal but with different exit-rule (/more on this on snapshots below). Alternatively, you can also work the code so to only use this type of exit.
There's also an additional feature which you can enable its visuals, the Distance Zone , is to help measuring price distance to our xHMA+. It's just a simple atr based envelope really, I already put the sample code in study's comment section, but better gonna update it there directly for non-coder too, after this.
In this sample I use Lot for order quantity size just because that's what I use on my broker. Also what few friends use while we forward-testing it since the study is published, so we also checked/compared each profit/loss report by real number. To use default or other unit of measurement, change the entry code accordingly.
If you change your order size, you should also change the commission in Properties Tab. My broker commission is 5 USD per order/lot, so in there with example order size 0.1 lot I put commission 0.5$ per order (I'll put 2.5$ for 0.5 lot, 10$ for 2 lot, and so on). Crypto usually has higher charge. --It is important that you should fill it base on your broker.
SETTINGS
I'm trying to keep it short. Please explore it further again. (Beginner should also first get acquaintance with terms use here.)
ORDERS:
Base Minimum Profit Before Exit:
The number is multiplier of ongoing ATR. Means that when basic exit condition is met, algo will check whether you're already in minimum profit or not, if not, let it still run to TP or SL, or until it meets subsequent exit condition, then it will check again.
Default Target Profit:
Multiplier of ATR at signal. If reached before any eligible exit condition is met, exit TP.
Base StopLoss Point:
You can change directly in code to use other like ATR Trailing SL, fix percent SL, or whatever. In the sample, 4 options provided.
Maximum StopLoss:
This is like a safety-net, that if at some point your chosen SL point from input above happens to be exceeding this maximum input that you can tolerate, then this max point is the one will be use as SL.
Activate 2nd order...:
The additional doubling of certain buy/sell with different exits as described above. If enable, you should also set pyramiding to at least: 2. If not, it does nothing.
ADAPTIVE HMA+ PERIOD
Many users already have their own settings for these. So in here I only sample the default as first presented in the study. Make it to your adaptive.
MARKET MOVEMENT
(1) Now you can check in realtime how much slope degree is best to define your specific pair/tf is out of congestion (yellow) area. And (2) also able to check directly what ATR lengths are more suitable defining your pair's volatility.
DISTANCE ZONE
Distance Multiplier. Each pair/tf has its own best distance zone (in xHMA+ perspective). The zone also determine whether a signal should appear or not. (Or what type of signal, if you wanna go more detail in constructing your strategy)
USAGE
(Provided you already have your own comfortable settings for minimum-maximum period of Adaptive HMA+. Best if you already have backtested it manually too and/or apply as an add-on to your working strategy)
1. In our experiences, first most important to define is both elements in the Market Movement Settings . These also tend to be persistent for whole season since it's kinda describing that pair/tf overall behaviour. Don't worry if you still get a low Profit Factor here, but by tweaking you should start to see positive changes in one of Max Drawdown and Net Profit, or Percent Profitable.
2. Afterwards, find your pair/tf Distance Zone . When optimising this, what we seek is just a "not to bad" equity curves to start forming. At least Max Drawdown should lessen more. Doesn't have to be great already, but should be better, no red in Net Profit.
3. Then go manage the "Trailing Minimum Profit", TP, SL, and max SL.
4. Repeat 1,2,3. 👻
5. Manage order size, commission, and/or enable double-order (need pyramiding) if you like. Check if your equity can handle max drawdown before margin call.
6. After getting an acceptable backtest result, go to List of Trades tab and find the biggest loss or when many sequencing loss in a row happened. Click on it to go to exact point on chart, observe why the signal failed and get at least general idea how it can be prevented . The rest is yours, you should know your pair/tf more than other.
You can also re-explore your minimum-maximum period for both Major and minor xHMA+.
Keep in mind that all numbers in Setting are conceptually in a form of range . You don't want to get superb equity curves but actually a "fragile" , means one can easily turn it to disaster just by changing only a fraction in one/two of the setting.
---
If you just wanna test the strength of the indicator alone, you can disable "Use StopLoss" temporarily while optimising settings.
Using no SL might be tempting in overall result data in some cases, but NOTE: It is not recommended to not using SL, don't forget that we deliberately enter when it's in high volatility. If want to add flexibility or trading for long-term, just maximise your SL. ie.: chose SL Point>ATR only and set it maximum. (Check your max drawdown after this).
I think this is quite important specially for beginners, so here's an example; Hypothetically in below scenario, because of some settings, the buy order after the loss sell signal didn't appear. Let's say if our initial capital only 1000$ using leverage and order size 0,5 lot (risky position sizing already), moreover if this happens at the beginning of your trading season, that's half of account gone already in one trade . Your max SL should've made you exit after that pumping bar.
The Trailing Minimum Profit is actually look like this. Search in the code if you want to plot it. I just don't like too many lines on chart.
To maximise profit we can try enabling double-order. The only added rule coded is: RSI should rising when buy and falling when sell. 2nd signal will appears above or below default buy/sell signal. (Of course it's also prone to double-loss, re-check your max drawdown after. Profit factor play its part in here for a long run). Snapshot in comparison:
Two default sell signals on left closed at RSI exit, the additional sell signal closed later on when price crossover minor xHMA+. On buy side, price haven't met our minimum profit when first crossunder minor xHMA+. If later on we hit SL on this "+buy" signal, at least we already profited from default buy signal. You can also consider/treat this as multiple TP points.
For longer-term trading, what you need to maximise is the Minimum Profit , so it won't exit whenever an exit condition happened, it can happen several times before reaching minimum profit. Hopefully this snapshot can explain:
Notice in comparison default sell and buy signal now close in average after 3 days. What's best is when we also have confirmation from higher TF. It's like targeting higher TF by entering from smaller TF.
As also mention in the study, we can still experiment via original HMA by putting same value for minimum-maximum period setting. This is experimental EU 1H with Major xHMA+: 144-144, Flat market 13, Distance multiplier 3.6, with 2nd order activated.
Kiwi was a bit surprising for me. It's flat market is effectively below 6, with quite far distance zone of 3.5. Probably because I'm using big numbers in adaptive period.
---
The result you see in strategy tester report below for EURUSD 15m is using just default settings you see in code, as follow:
0,1 lot for each order (which is the smallest allowed by my broker).
No pyramiding. Commission: 0.5 usd per order. Slippage: 3
Opening position is only using basic strategy #1 (RSI exit). Additional exit not activated.
Minimum Profit: 1. TP: 3.
SL use: Half-distance zone. Max SL: 4.5.
Major xHMA+: 172-233. minor xHMA+: 89-121
Distance Zone Multiplier: 2.7
RSI: Standard 14.
(From our forward-testing, the difference we get from net profit is because of the spread, our entry isn't exactly at the close/open price. Not so much though, but not the same. If somebody can direct me to any example where we can code our entry via current bid/ask price, that would be awesome!)
It's already a long post (sorry), think I'm gonna pause here. Check out the code :)
---
DISCLAIMER: Past performance is no guarantee of future results , and so on.. you know the drill ;)
Please read whole description first before using, don't take 1-2 paragraph and claim it's the whole logic, you are responsible of your own actions and understanding.

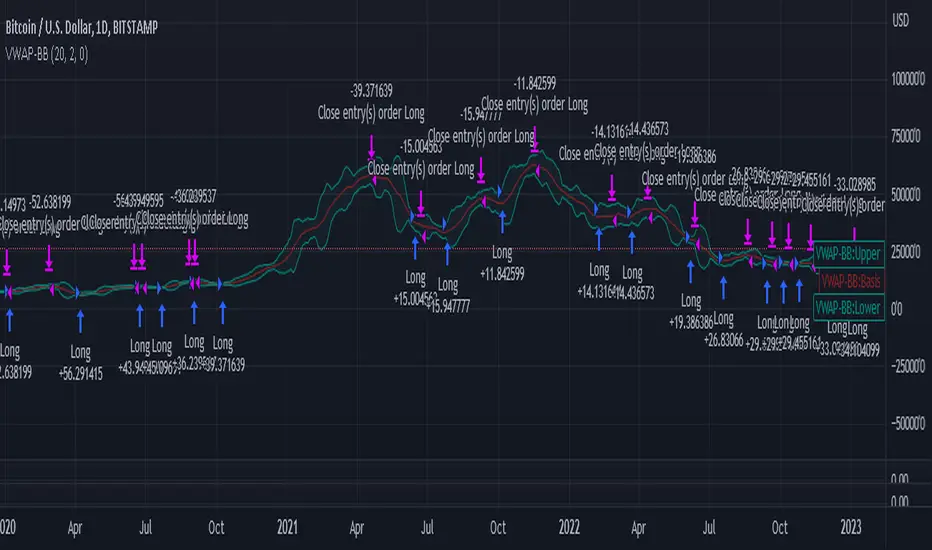
VWAP-Bollinger BandsThis script uses Bollinger bands but with a VWAP as the source, it uses the high crossing the upper band as a buy signal and a low crossing the lower band as a sell signal
Its default settings are for a day chart - Crypto 30 periods, forex 24 periods and stocks 20 periods, which basically line up with a month per asset class
ive seen good results in crypto and stocks, settings used between1% and 10% equity per trade with a 0.1% fee which lines up with Binance fee structure and $25 per trade which lines up with Commsec on the ASX
Bollinger Bands strategy with RSI and MACD v1.0 This is a strategy based on the Bollinger Bands, where buy trades are made when the price crosses the lower line of the Bollinger Bands upwards, and sell trades are made when the price crosses the upper line downwards.
In addition, it is possible through the inputs to enable trading with RSI and MACD, so that buy or sell trades are supported by these two indicators.
Trades are partially and fully closed in the following way, a buy trade will close half of the position when the price touches the middle line of the Bollinger bands and will be fully closed when the price touches the upper band. In the case of a sell position, half of the position will be closed if the price touches the middle band and the entire position will be closed when the price touches the lower band. Alternatively, a fixed take profit can be placed. In case the price moves against us, trailing stops can be placed.
In case of selecting to use RSI, MACD, or MACD variation, trades will be executed as long as The Bollinger Bands, and all the above-mentioned indicators give the same signals, either buy or sell.
For example in the case of selecting only Use RSI, buy trades would be made as long as RSI and BB give buy signals.
Strategy inputs:
-BB source: Bollinger Bands price source.
-Bollinger Bands SMA length: Bollinger Bands simple moving average length.
-Bollinger Bands StdDev length: Bollinger Bands standard deviation length.
-Trail Long Loss (%): Distance in percentage at which the stop loss will initially be placed for buy trades.
-Trail Short Loss (%): Distance in percentage at which the stop loss will be initially placed for sell trades.
-Maximum orders: Maximum of simultaneous operations, for example, if it is 3, up to 3 parallel operations of buy and up to 3 parallel operations of sell will be carried out.
-Position size: Number of contracts per trade.
-Use RSI: If selected, the strategy will also trade based on oversold or overbought signals provided by the RSI.
-RSI source: RSI price source.
-RSI period: The RSI period to use.
-RSI value for buy: If the RSI is below this value, it will give a buy signal.
-RSI value for sell: If the RSI value is above this value, it will give a sell signal.
-Use MACD: If selected, buy trades will be made when the MACD crosses 0 upwards, and sell trades will be made when the MACD crosses 0 downwards.
-Use MACD variation: Only available if MACD is previously selected. In this case, buy trades are made if the MACD value in the last 3 candles has been decreasing, and sell trades are made if the MACD value has been increasing.
-MACD source: MACD price source.
-MACD fast length: MACD fast EMA lenght.
-MACD slow length: MACD slow EMA lenght.
-MACD signal length: MACD signal EMA lenght.
-Use maximum TP long: If selected, a fixed take profit will be placed for buy trades. The position could be closed before reaching this take profit if the price touches one of the lower or upper lines first.
-Maximum take profit long (%): Distance in percentage at which the take profit will be placed for buy trades.
-Use maximum TP short: if selected, a fixed take profit will be placed for sell trades. The position could be closed before reaching this take profit if the price touches one of the lower or upper lines first.
-Maximum take profit short (%): Distance in percentage at which the take profit will be set for sell trades.
I hope you like it and as always all feedback is welcome.

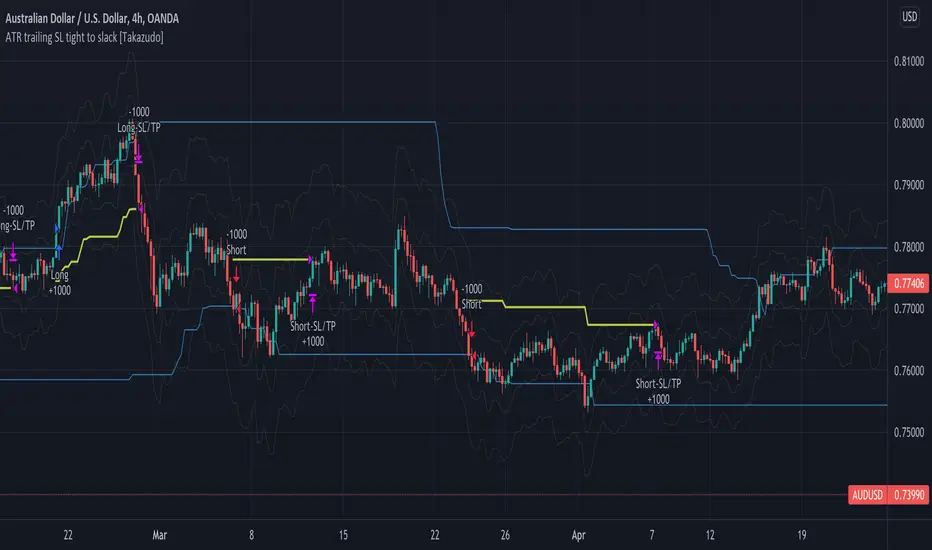
ATR trailing Stop Loss tight to slack [Takazudo]This is a demo of ATR based trailing Stop Loss.
This SL strategy uses 2 types of ATR based SL.
tight SL as initial (ATR * 1.5)
slack SL as trailing (ATR * 4)
When any entry singal occurs by the buy/sell conditions, this SL strategy uses the "tight SL" as the initial SL.
Then the SL will chase the price as trailing SL. However, this strategy uses the "slack SL" in this trailing phase.
So you can set the tight SL first.
Then SL will chase the price as the slack one.
Note: The entry strategy in this script is not intented to win. Check the result. Be careful. Just a module of my strategy.
Full strategy Psar+ adx + cmf + rsi This ia full strategy made with a combination of a trender, volume, volatility and oscillator.
In this case we only go long.
Indicators used:
Default PSAR
Default CMF
Modified RSI logic, not using OB/OS
ADX with EMA applied
The rules are : we check if we are in a uptrend on psar, together with a positive value in volume, rsi is above the middle line(50), using a big length, and lastly the ADx is superior to the ema ADx
For exit, we check the opposite, like downtrend psar, negative value volume, rsi < 50, and adx < ema adx
If you have any questions let me know.

ATR with EOM and VORTEXThis is a strategy, designed for long trends for stock and crypto market.
Its made of ATR for volatility, EOM for volume and VORTEX for the trend direction.
In this case on the ATR, I applied an EMA to check if current position is above the EMA -> bull trend, below ema -> bear trend
For EOM I am using the positive and negative value scale, if its positive we are in a bull movement, otherwise a bear movement.
Lastly for VORTEX, I took the min and max, and made an average, after that I am using the average and compare it with 1 value. Above 1 -> bull, belowe 1-> bear.
This strategy only goes long.
If you have any questions, let me know.

Bollinger DCA v1Simple "benchmark" strategy for ETFs, Stocks and Crypto! Super-easy to implement for beginners, a BTD (buy-the-dip) strategy means that you buy a fixed amount of an ETF / Stock / Crypto every time it falls. For instance, to BTD the S&P 500 ( SPY ), you could purchase $500 USD each time the price falls. Assuming the macro-economic conditions of the underlying country remain favourable, BTD strategies will result in capital gains over a period of many years, e.g. 10 years.
Recommended Chart Settings:
Asset Class: ETF / Stocks / Crypto
Time Frame: H1 (Hourly) / D1 (Daily) / W1 (Weekly) / M1 (Monthly)
Necessary ETF Macro Conditions:
1. Country must have healthy demographics, good ratio of young > old
2. Country population must be increasing
3. Country must be experiencing price-inflation
Necessary Stock Conditions:
1. Growing revenue
2. Growing net income
3. Consistent net margins
4. Higher gross/net profit margin compared to its peers in the industry
5. Growing share holders equity
6. Current ratios > 1
7. Debt to equity ratio (compare to peers )
8. Debt servicing ratio < 30%
9. Wide economic moat
10. Products and services used daily, and will stay relevant for at least 1 decade
Necessary Crypto Conditions:
1. Honest founders
2. Competent technical co-founders
3. Fair or non-existent pre-mine
4. Solid marketing and PR
5. Legitimate use-cases / adoption
Default Robot Settings:
Contribution (USD): $500
When: Dips below lower Bollinger Band
*Robot buys $500 worth of ETF , Stock, Crypto, every time price falls below the lower Bollinger Band
*Equity curve can be seen from the bottom panel*
Risk Warning:
This strategy is low-risk, however it assumes you have a long time horizon of at least 5 to 10 years. The longer your holding-period, the better your returns. The only thing the user has to keep-in-mind are the macro-economic conditions as stated above. If unsure, please stick to ETFs rather than buying individual stocks or cryptocurrencies.

RSI Trend CryptoDear community,
Today I want to present you one of my favorite and simple trading bots: The RSI Trend.
This bot is based on the RSI, which normally is used as a trend reversal indicator. However, here it’s used as a trend finding indicator, often with great success. This bot making long-only trades, which is quite successful in bull-markets like the one we’re currently in.
In case you want to use an emergency exit for your trade, toggle the Emergency Exit parameter. During bull-markets it’s better in the long term to keep this option off.
Currently the bot only makes one trade at a time (pyramiding = 1), for higher risk and higher rewards you can increase this parameter. More than 5 is not advised.
I’ve optimized this bot on 15min time frame. It has some decent results for most cryptos on this TF, feel free to test this out.
In case you want to hook this bot up to your exchange, feel free to edit the ALERT messages in the code.
Default Trading Rules:
Long: RSI crosses over 35
Close Long: RSI crosses under 75
Emergency Exit: RSI crosses under 10

Trend Surfers - Premium Breakout + AlertsTrend Surfers - Premium Breakout Strategy with Alerts
I am happy today to release the first free Trend Surfers complete Breakout Strategy!
The strategy includes:
Entry for Long and Short
Stoploss
Position Size
Exit Signal
Risk Management Feature
How the strategy works
This is a Trend Following strategy. The strategy will have drawdowns, but they will be way smaller than what you would go through with buy and old.
As a Trend Following strategy, we will buy on strength, when a breakout occurs. And sell on weakness.
The strategy includes a FIX Stoploss determined by an ATR multiple and a trailing Stoploss/Takeprofit also determined by an ATR multiple.
You can also manage your risk by entering the maximum % you are willing to risk on every trade. Additionally, there is an option to enter how many pairs you will be trading with the strategy. This will change your position size in order to make sure that you have enough funds to trade all your favorite pairs.
Use the strategy with alerts
This strategy is alert-ready. All you have to do is:
Go on a pair you would like to trade
Create an alert
Select the strategy as a Trigger
Wait for new orders to be sent to you
Every Entry (Long/Short) will include:
Market Entry (Enter position NOW!)
Stoploss price
Position Size
Leverage
* If you do not wish to use leverage, you can multiply the Position Size by the Leverage. But doing that, you might end up with a position greater than your equity. Trading on Futures is better in order to have accurate risk management.
Exit signals:
When you receive an exit signal, you need to close the position ASAP. If you want to keep your results as close as possible to the backtest results, you need to execute quickly and follow what the strategy is telling you.
Do not try to outsmart the strategy
Leave your emotion out of trading! If you trust the strategy, you will have way better returns than if you try to outsmart it. Follow each signal you receive even if it doesn't seem logical at the moment.
Become a machine that executes. Don't look at fundamentals. Follow the trend! Trust the strategy!
I hope you enjoy it!
