


黄金1.618关键位置出现集中抛售,谨防跳水风险自上一篇观点后黄金如期来到最高5111.51一线,接近一个月时间上涨800多个点,这一涨速已经表现出了后段加速的特性。
关注1月29日 03:00的利率决议数据,另外美国政府面临再次停摆,届时所有数据可能再次延期公布,所以当前阶段当打起精神跟随移动止损,谨防跳水风险,另外国内交易所对金银多次限仓动作也一定程度上制衡了多头情绪,再次提升风险,下方核心支撑4600附近,右侧关注低多机会。

请不要继续坚持美股泡沫爆破的想法给同志们送上迟来的新年快乐!
去年年末标普最高点位是6986,还是没能突破7000点。估计近期还要会上破7000大关,毕竟上升三角实在是经典得非常老套。继续上破估计是大概率事件。
估计上破后的跟进速度不会太慢。川武大帝的美丽法案的减税福利在第一季就要到账了。
而且这年头,全民都得炒股。不然就是给通胀当义工。现在的z世代没几个会像父辈殷勤在企业打工至退休。炒股才是他们的出路。
现在自媒体的泛滥成灾,不可能学不会炒股。只要足够时间,核弹怎样做也能在youtube学到。更何况现在有AI。所以全民炒股的时代要来了。流入股市的钱可能是我们难以想象。
回想两三个月前,市场都在担心泡沫,估值,市盈

19-20日黄金做多计划上周五在消息面的加持下,价格在美盘极速向下清除了左侧的低阻力流动性池,随时抵达4H 看涨FVG 50%区域后又快速拉回到了1H OB+区域内。
周一期望价格高开,突破周五高点4621后形成结构反转,下方30M看涨OB就会生效,它将是一个摆动点OB,随后再耐心等待价格回到4575区域,在5M图表上观察价格是否会极速反转并创造新的OB+FVG,配合2022模型建立多头仓位,自行分阶段止盈,留尾仓推保护看历史新高。
周一价格如果高开后没有动力,再极速向下,不要追空,仍然关注
4575区域的反转机会。
日内短空机会在频道内更新。新手谨慎做空,耐心等待多头机会。
基于SMC流动性思考,仅做交流学

白银结构性崩塌预警:1980式“瀑布”前的最后备战清单
当前状态:暴风雨前的宁静 很多交易者还在盯着 K 线的高位震荡,试图寻找突破做多的机会。但作为专业交易者,我们必须看到冰山之下的裂痕:
地基塌陷:期限结构(SI1!-SI2!)已跌入深度的 Super Contango(超级升水)。现货买盘消失,这是典型的“有价无市”。
共振确认:XAGUSD 与交叉盘(XAGJPY)出现大周期空头共振。
扳机在即:美元指数(DXY)正在筑底,未来两周是关键变盘窗口。
这不只是一次回调,技术图形显示我们可能正面临一次类似 1980 年的流动性枯竭式崩盘(Waterfall Crash)。
【行动指南:现在该做什么?】 在瀑布

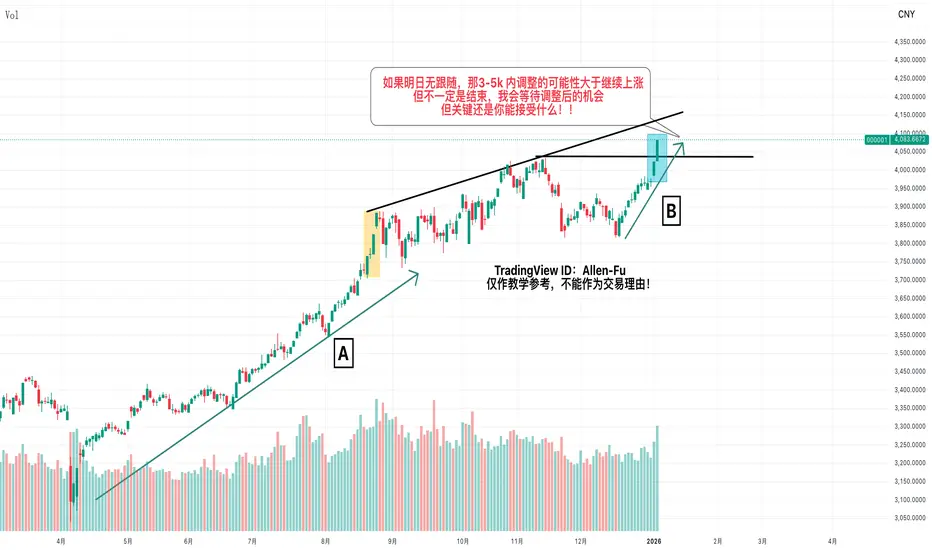
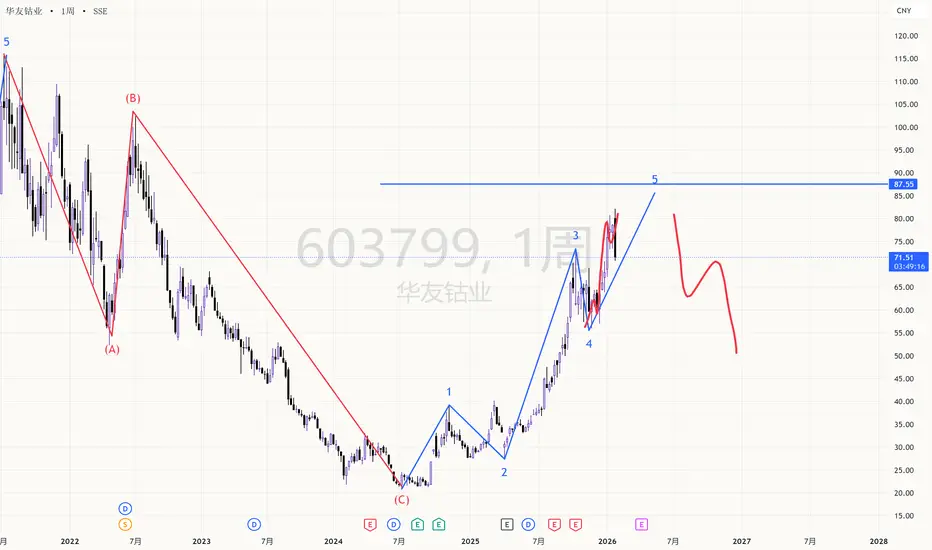
上证指数新高, 是多头的开始还是结束?---各位交易员朋友好久不见,虽然这半年来很少发文章,但是交易却未停过一日,我们直接进入主题,2026 年的第二个交易日 也就是 1 月 6 日,上证指数触及 4083 ,创2015 年 7 月以来新高,听起来很热血沸腾,但技术上只是超过了25 年 11 月14 日的 4034 新高。所以 是新趋势的开始,还是上个趋势的强弩之末,最后的奋力一击呢? 下面从我个人的分析系统的视角出发,做个简单分析,供大家参考。
---B 段中的蓝色区域,是 A段以来最强势的一段上涨。也是A 到 B ,这段宽幅调整以来最强势的上涨,今日的放量也明显增大了,有明显高位离场。从供应的角度来看这似乎是,强弩之末的铁证,

查看所有编辑精选观点
Smart Trader, Episode 03, by Ata Sabanci, Candles and TradelinesA volume-based multi-block analysis system designed for educational purposes. This indicator helps traders understand their current market situation through aggregated block analysis, volumetric calculations, trend detection, and an AI-style narrative engine.
━━━━━━━━━━━━━━━━━━━━━━━━━━━━━━━━━━━━━━━

Asset Drift ModelThis Asset Drift Model is a statistical tool designed to detect whether an asset exhibits a systematic directional tendency in its historical returns. Unlike traditional momentum indicators that react to price movements, this indicator performs a formal hypothesis test to determine if the observed d

Hyperfork Matrix🔱 Hyperfork Matrix 🔱 A manual Andrews Pitchfork tool with action/reaction propagation lines and lattice matrix functionality. This indicator extends Dr. Alan Andrews' and Patrick Mikula's median line methodology by automating the projection of reaction and action lines at equidistant intervals, cr

Arbitrage Matrix [LuxAlgo]The Arbitrage Matrix is a follow-up to our Arbitrage Detector that compares the spreads in price and volume between all the major crypto exchanges and forex brokers for any given asset.
It provides traders with a comprehensive view of the entire marketplace, revealing hidden relationships among d

Wyckoff Schematic by Kingshuk GhoshThe "Wyckoff Schematic" is a Pine Script indicator that automatically detects and visualizes Wyckoff Method accumulation and distribution patterns in real-time. This professional tool helps traders identify smart money movements, phase transitions, and critical market structure points.
Key Features

Volume Cluster Profile [VCP] (Zeiierman)█ Overview
Volume Cluster Profile (Zeiierman) is a volume profile tool that builds cluster-enhanced volume-by-price maps for both the current market window and prior swing segments.
Instead of treating the profile as a raw histogram only, VCP detects the dominant volume peaks (clusters) insid

DeeptestDeeptest: Quantitative Backtesting Library for Pine Script
━━━━━━━━━━━━━━━━━━━━━━━━━━━━━━━━━━
█ OVERVIEW
Deeptest is a Pine Script library that provides quantitative analysis tools for strategy backtesting. It calculates over 100 statistical metrics including risk-adjusted return ratios (Sharpe

Arbitrage Detector [LuxAlgo]The Arbitrage Detector unveils hidden spreads in the crypto and forex markets. It compares the same asset on the main crypto exchanges and forex brokers and displays both prices and volumes on a dashboard, as well as the maximum spread detected on a histogram divided by four user-selected percenti

Multi-Distribution Volume Profile (Zeiierman)█ Overview
Multi-Distribution Volume Profile (Zeiierman) is a flexible, structure-first volume profile tool that lets you reshape how volume is distributed across price, from classic uniform profiles to advanced statistical curves like Gaussian, Lognormal, Student-t, and more.
Instead of forcin

Multi-Ticker Anchored CandlesMulti-Ticker Anchored Candles (MTAC) is a simple tool for overlaying up to 3 tickers onto the same chart. This is achieved by interpreting each symbol's OHLC data as percentages, then plotting their candle points relative to the main chart's open. This allows for a simple comparison of tickers to tr

查看所有指标和策略
社区趋势
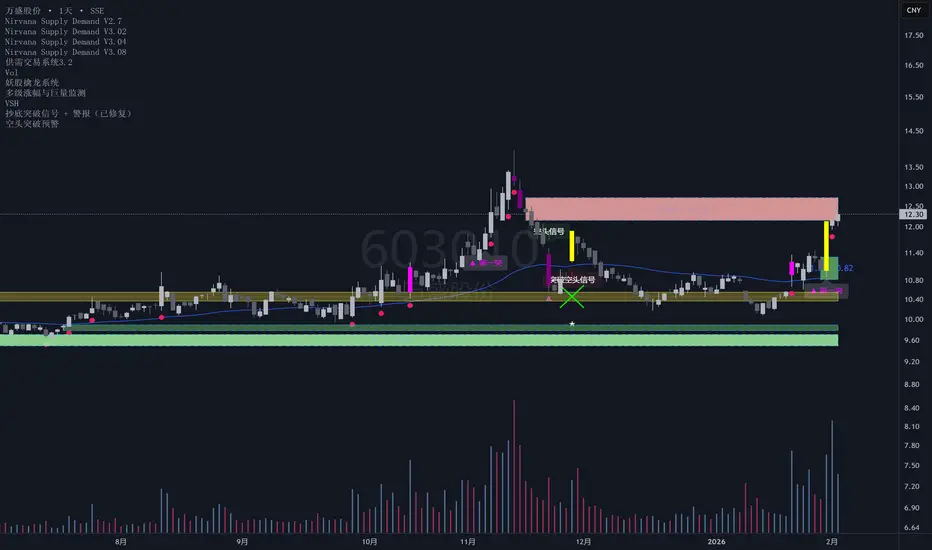
万盛股份:《全球磷系阻燃剂龙头:从“规模壁垒”到“新能源材料”的护城河延伸》万盛股份作为全球磷系阻燃剂细分领域绝对龙头,其护城河源于规模与技术壁垒、客户与渠道粘性、产业链垂直整合三大核心维度,叠加全球化布局与多业务协同的辅助优势,形成了难以复制的竞争优势。尽管短期受行业供需失衡(产能过剩、需求疲软)影响业绩承压,但长期看,其龙头地位与护城河仍将支撑其在新能源、5G等新兴领域实现复苏与增长。
二、具体护城河分析
1. 规模与技术壁垒:全球磷系阻燃剂龙头的“不可复制性”
万盛股份的核心业务是磷系阻燃剂(属于功能性精细化学品),其护城河的首要来源是全球领先的规模优势与持续的技术创新能力。
规模优势:公司是“全球最主要的磷系阻燃剂生产、供应商”,现有年产能13.5万

牧原股份周线级别突破回踩结构,关注入场机会黄金的加速上涨会快速传导至消费端,农林牧渔、生猪粮食、农产品是接下来的重头戏,种业农产品养殖业已经开始表现,牧原股份周线级别的突破回踩结构是不错的介入时机,右侧关注企稳后的入场机会。


查看所有股票观点
社区趋势

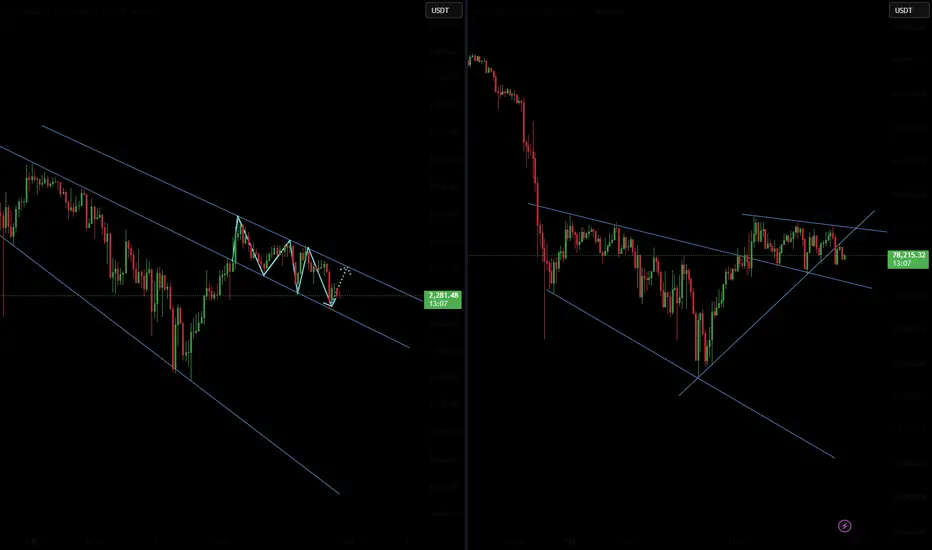


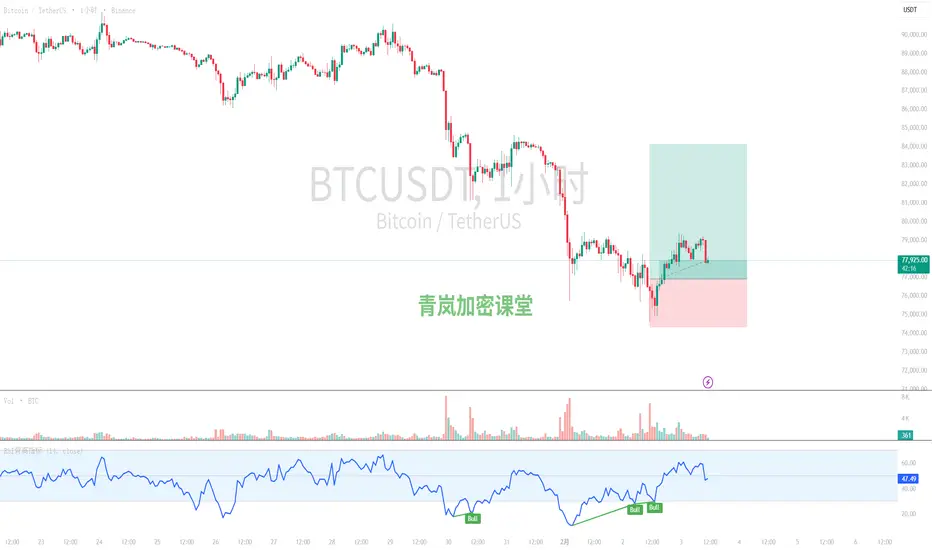
青岚加密课堂:2月3日 BTC分析| 比特币绝地警报:78K成多空生死线欢迎来到青岚加密课堂,咱们今天对BTC 四个周期包括消息面进行分析:
一、技术面:四周期层层剥茧
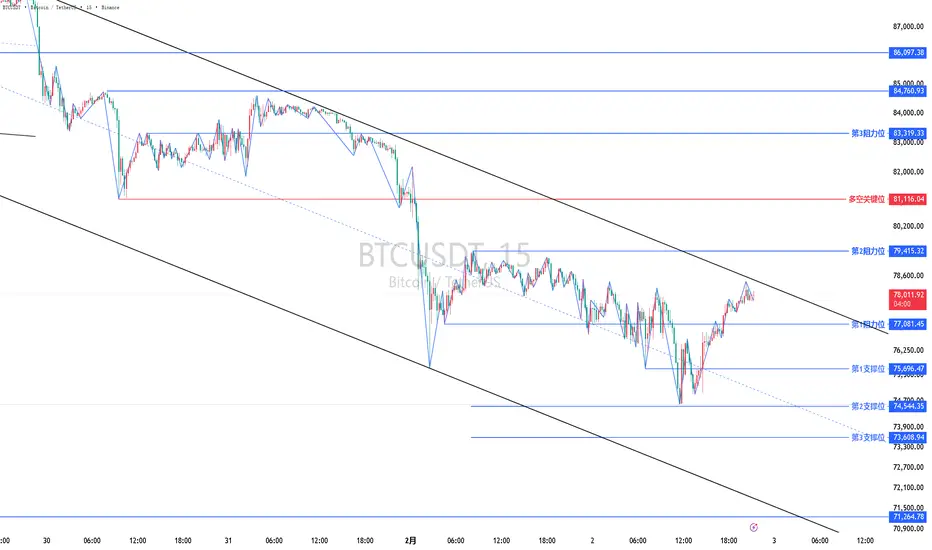
1. 短期(15分钟图):震荡偏弱,寻找方向。
* 走势:价格在78,000-79,000美元区间窄幅震荡,最新一根K线(11:00)收在77,807附近,有下探迹象。
* 指标:MA5/MA10/MA20开始粘合并拐头向下,形成短期压制。MACD在零轴上方死叉后,快慢线已双双跌至零轴下方,绿柱(负值)持续放大,显示短线空头动能增强。RSI从50中位线附近快速跌至34,进入弱势区域。
* 关键位:上方阻力先看78,500(MA均线粘合区),强阻力79,000。下方支撑看77,500(近期低点)
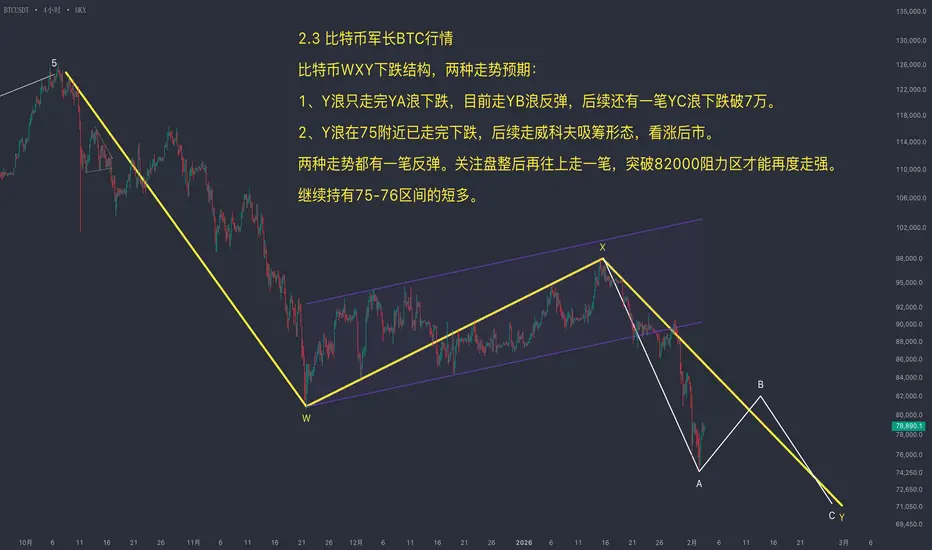
2.3 比特币走势分析:自75000点反弹第一段完成进入横盘,震荡后上行第二目标看向82000点关键阻力,突破与否决定反弹级别(2.3 比特币价格今日行情:比特币从75000点附近的反弹,其第一段已于79000点附近完成,目前价格进入横盘震荡阶段。预期震荡结束后将启动第二段上行,目标指向约82000点的关键阻力区域,该位置亦与斐波那契1.618扩展位重合。
当前策略以持有多单为主,核心关注点在于价格抵达82000点附近时,能否有效突破。若无法突破,则需考虑止盈离场;若能强势突破,则反弹空间可进一步看高。


(有梦分析)多空关键位之下偏空,以回调看空为主,二次不破前低回调看多为辅。或背靠下跌通道高抛低吸为主,突破看多,下破看空为辅。多空关键位之下偏空,以回调看空为主,二次不破前低回调看多为辅。或背靠下跌通道高抛低吸为主,突破看多,下破看空为辅。
查看所有加密观点
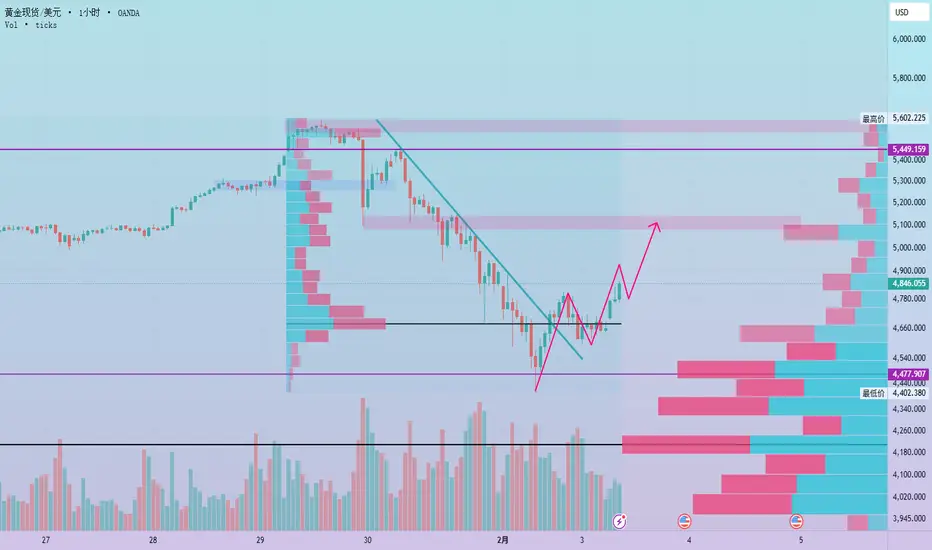
黄金小时线反抽,向上关注供给区千点下跌后的反抽不能错过,目前下方买盘意愿同样强劲,黄金的长期叙事没有问题,短线顺势向上关注,供给区5100-5150附近关注突破有效性,若下方4600破位则谨防再次下跌风险。

金汇得手:黄金到5000整数关口 关注是否有效破位 美元指数昨天小区间震荡,今天关注97.6-96.8区间。
黄金昨天开盘就涨,凌晨到目标5000附近,日线收阳。今天还有一涨,如果单看日线收线,大概率会去5100-5140。站稳5140,下个目标5400,只是时间问题。 5140不破,行情继续大区间震荡为主。目前下方支撑日内低点附近4910附近,触及可以做多。如果行情走震荡洗盘,给到4800也是做多位置。上方关注5000附近或昨天高点阻力,破位回落多,不破小止损空。
操作建议:早盘注意4910-5000区间,未破位前小止损高空低多,上破再看50-140美金,5100上方或5140继续空。昨天给到4745多,4933和4948空。晚间建议489

(有梦分析)多空关键位之上偏多,以回调看多为主,或背靠上涨通道高抛低吸为主,突破看多,下破看空为辅。多空关键位之上偏多,以回调看多为主,或背靠上涨通道高抛低吸为主,突破看多,下破看空为辅。每一次进场必须要信号+关键位。

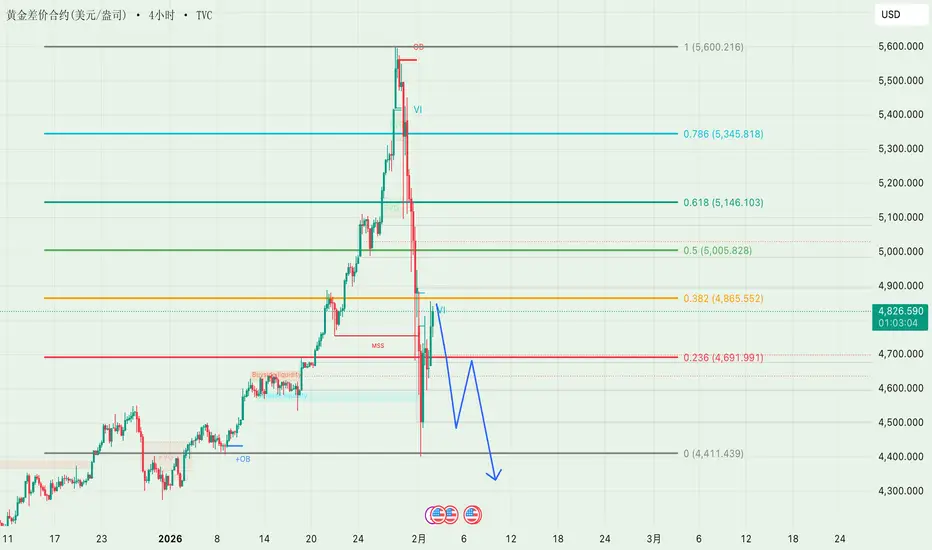
黄金反弹还是陷阱?黄金正在反弹——但背景很重要。
在强烈的抛售之后,价格现在正在回撤到一个关键的阻力区,没有打破结构。这是许多交易者被困于追逐“底部”的地方,而聪明的钱在分配。
市场结构
清晰的下行趋势:低高点和低低点保持完好
当前的走势 = 回撤,并不是强劲的看涨延续
价格在下降趋势线下反应
关键技术区
FVG / 供应区在5.26x左右 → 高概率反应区域
该区域与回撤水平和之前的失衡相一致
如果-那么场景
如果价格拒绝5.26x:
→ 下行趋势持续,目标4.63x → 4.51x → 4.40x
如果价格突破并保持在5.26x以上(H1收盘):
→ 看跌偏见减弱,等待新的结构再进行交

黄金GOLD趋势与基本交易策略周线复合:混合,但从超买区反转,初始信号已出现。
日线复合:在日低点完成之前,短期趋势应当横盘⾄下跌,约 4–5 天左右。
关键因素:黄⾦和白银已经形成了教科书式的衰竭性反转,这应当完成⼀个多周,甚⾄多月级别的顶部。
交易策略建议:黄⾦和白银都已经形成了更低的周线收盘价,其中白银的收盘价低于此前连续两周的周线收盘价。
⚠ 短期交易者应以TradingBox信号系统为准!


黄金 GOLD 行情大局以及趋势分析大局趋势:熊市,周高点应该已经完成。
关键阻力:行情完成 W.5:5:3结构持续数周、甚至数月高点。
关键支撑:更低的周线收盘价这将是周高点已经完成的初始信号。
关键因素:上周已警告,在FOMC 会议当周,出现周线反转的概率较高。黄金与白银已经形成了教科书式的投机性高点以及衰竭性反转。
⚠更多交易分析及工具可以关注 NeuraAlgo 进行查看!


查看所有期货观点


欧元 EUR 行情大局以及趋势分析大局趋势:混合状态,偏多,在未来 3–4 周内大概率整体偏多。
关键阻力:日线收盘价 高于12 月 23 日的摆动高点收盘价。该条件已于周五实现,一次修正应已完成。
关键支撑:日线收盘价 低于 1月 16 日的潜在第二浪(W.2)低点收盘价。若收盘跌破该位置,将警告欧元可能继续下跌至 7 月低点下方。
关键因素:周线与日线收盘价均高于各自的周线收盘高点,这是一个周线低点已经完成的强烈形态信号。任何回落都应被视为周线牛市趋势中的修正。
⚠更多交易分析及工具可以关注 NeuraAlgo 进行查看!
NeuraAlgo 实时追踪外汇、加密货币与美股走势,通过趋势强度、市场偏向、情绪结构与资

欧元EUR趋势与基本交易策略周线复合:混合,中性。
日线复合:日线未处于超买(OB),这意味着短期趋势应为横盘⾄上⾏,并可能在约 2–3 天后完成⼀个日线⾼点。
关键因素:日线与周线收盘价站上近期收盘⾼点,这是⽜市趋势延续的强势形态位置。欧元在继续⽜市之前的下⾏空间甚⾄比我原先预期的还要少。
交易策略建议:周低点应该已经完成,下⼀次日线动能周期与多头反转(不太可能早于下周后段),应当构成周线甚⾄月线⽜市趋势做多的⼊场条件。
⚠ 短期交易者应以TradingBox信号系统为准!


查看所有外汇观点
| - | - | - | - | - | - | - | ||
| - | - | - | - | - | - | - | ||
| - | - | - | - | - | - | - | ||
| - | - | - | - | - | - | - | ||
| - | - | - | - | - | - | - | ||
| - | - | - | - | - | - | - | ||
| - | - | - | - | - | - | - | ||
| - | - | - | - | - | - | - |
通过我们支持的、经过全面验证和用户审查的经纪商,直接在超级图表上交易。


